How to Trade with ZigZag Indicator: Settings and Use

5 minutes for reading
In this review, we will discuss a popular forex indicator called ZigZag. This indicator makes it easier to interpret charts, showing important price changes, and helps to carry out tech analysis.
What is ZigZag and is it helpful?
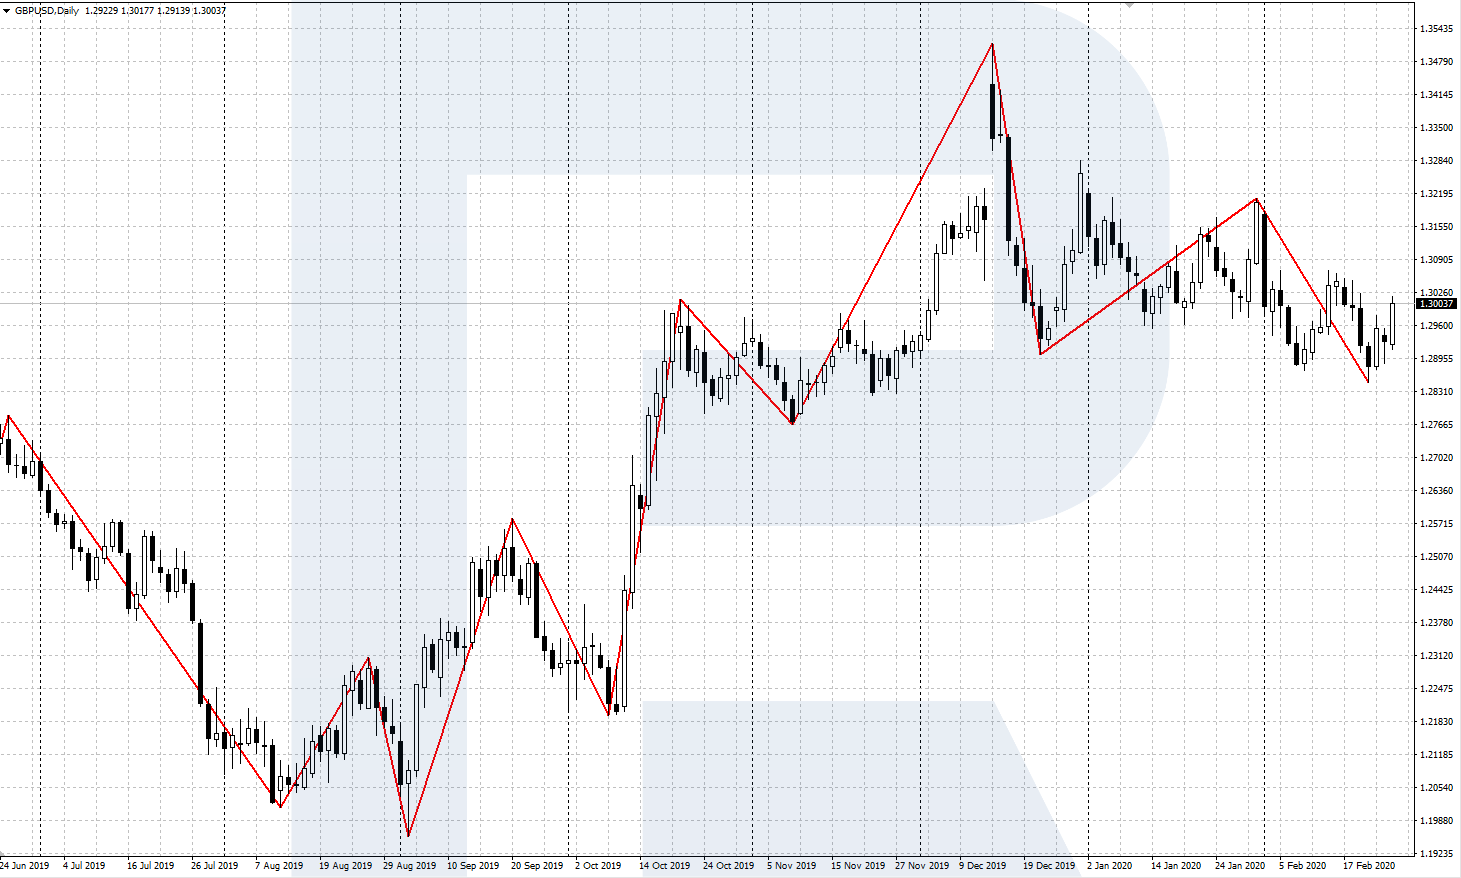
ZigZag is quite a popular indicator featured by many trading platforms, including MT4 and MT5. The indicator is a broken line linking lows and highs on the price chart. As long as ZigZag is drawn through the most important highs and lows, it is very easy to use for price chart analysis.
ZigZag links highs and lows on the chart in accordance with the settings. You must keep in mind that the last line of the indicator remains incomplete until the last high or low is formed.
ZigZag helps analyze the price movement on the chart. Traders who use Elliott waves in their strategy, often use ZigZag as well to identify waves. It helps to filter minor "noise" on the chart and to define current wave structure (motive or corrective).
Also, ZigZag will help define the actual trend and draw trendlines. With it, it is easier to find technical support and resistance levels, price and tech analysis patterns. As a rule, ZigZag supplements tech analysis or helps find trading signals along with other indicators.

Characteristics and settings
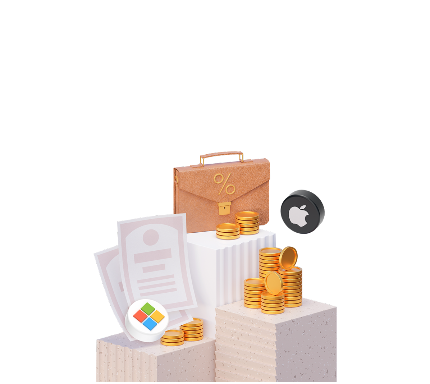
On popular trading platforms MetaTrader 4 and MetaTrader 5, ZigZag applies on the chart of an instrument via the Main menu: Insert - Indicators - User - ZigZag.
A standard ZigZag has three main settings:
- Deviation sets the minimal price change necessary for the indicator to form a high/low on the chart. It measures in %, by default set as 5.
- Depth sets the minimal interval on which the indicator will draw a new extreme if the Deviation setting is complied with. It is measured in the number of candlesticks, the default setting is 12.
- Backstep is the minimal number of candlesticks that must divide two local extremes. At this interval, new highs/lows will not be drawn if they differ from the previous ones for the size of Deviation. The default setting is 3.
ZigZag normally uses with default settings. Of course, they can always be altered, evaluate the effect of the new settings historically and choose optimal parameters for your trading style.
The logic of the indicator line on the chart (with default settings) is as follows:
First, ZigZag chooses an extreme on an interval of 12 candlesticks. The number of candlesticks set by Depth in the indicator settings.
If the price was growing for some time and then started to decline, the indicator starts looking for a local high on the 12-candlestick interval.
The distance between the last local high and low takes as 100%, the Deviation parameter (5%) calculates in relation to it.
If the price does not reverse down and growth for 5% more of the basic movement, the high will be transferred to a new peak.
When the price declines, a new low will be formed after ZigZag defines the local extreme by the same algorithm.


Trading with ZigZag
You can use the indicator as an independent trading system, but most often it uses with other trading instruments to make trading more efficient. Let us discuss two trading methods.
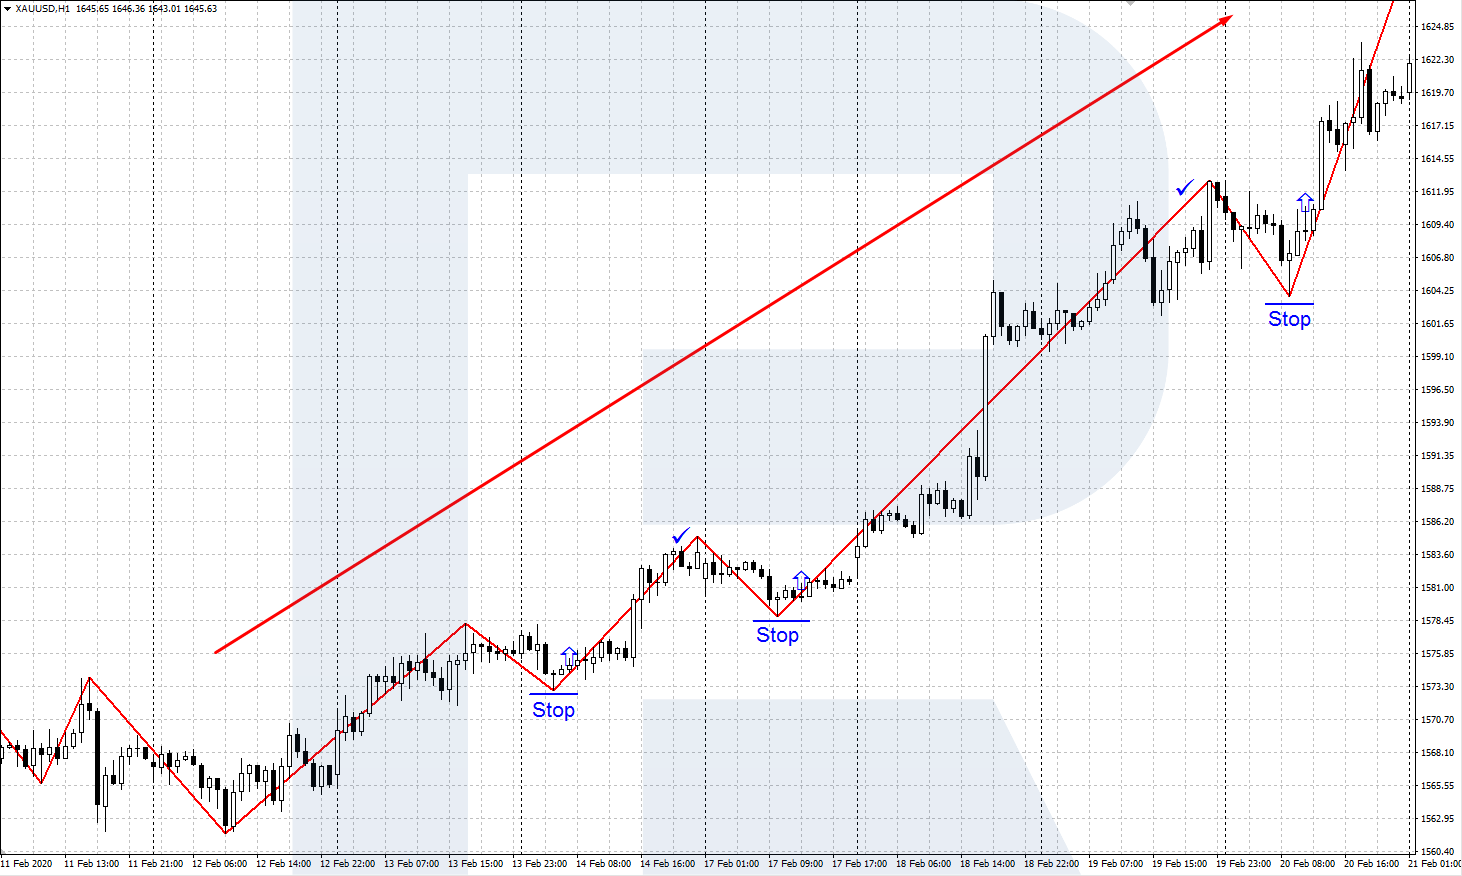
Trading the trend with ZigZag
This method uses ZigZag signals to trade the main trend. To define the direction of the trend, we recommend using classic tech analysis or trend indicators.
Buying along with the trend
Define an uptrend on the market. Wait for ZigZag to form another low. After two candlesticks to the right from the low close, enter the market to buy. Place a Stop Loss 5 points below the low of the indicator. Do not place a Take Profit, close the buy right after ZigZag forms another high.
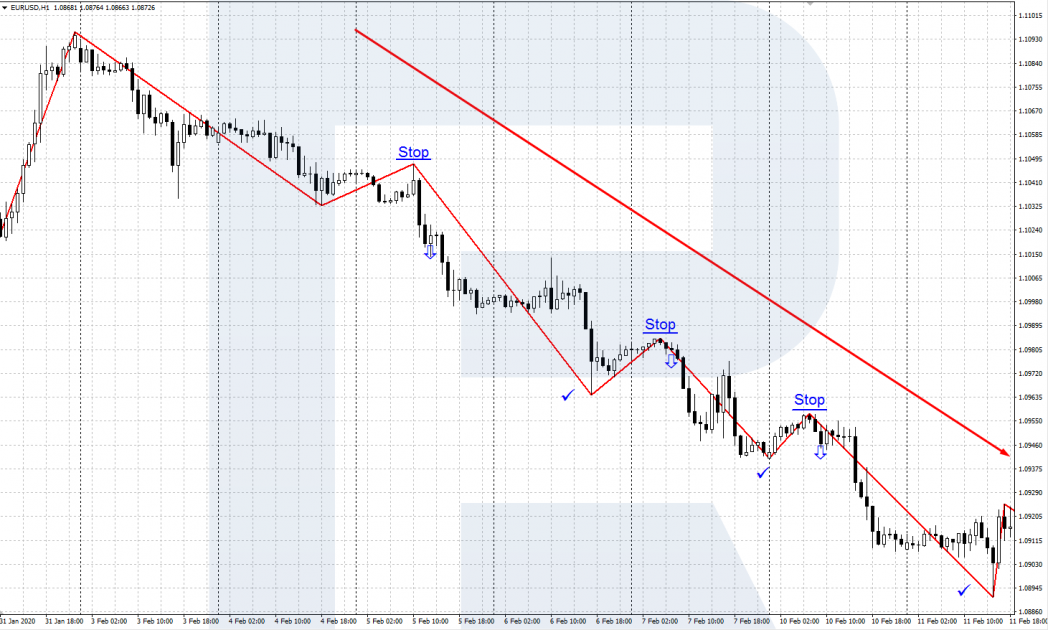
Selling along with the trend
Define a downtrend on the market. Wait for ZigZag to form another high. After two candlesticks to the right from the high close, enter the market to buy. Place a Stop Loss 5 points above the high of the indicator. Do not place a Take Profit, close the trade right after ZigZag forms another low.
ZigZag + 1-2-3 Reversal
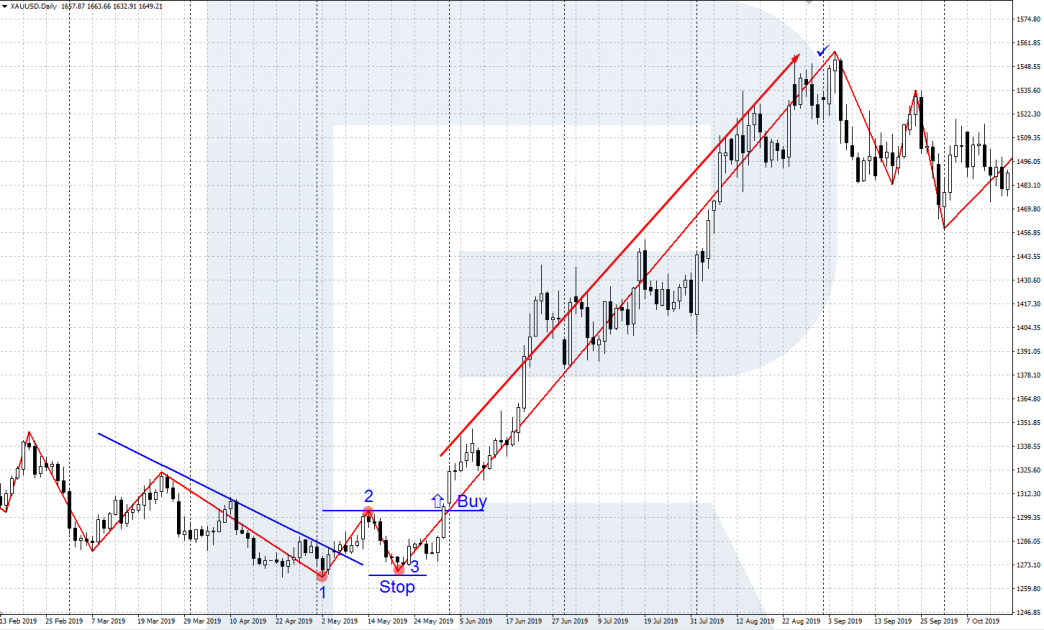
In this method, the indicator helps find and use Sperandeo’s 1-2-3 reversal pattern:
- Find the actual trend and draw a trendline by Sperandeo.
- The last and lowest low of the trend mark as point 1.
- Wait for ZigZag to cross the trendline and form a new local high – this will be point 2.
- Then a correction must follow and a local low at ZigZag must form; it must not be lower than point 1. This local low will be called point 3 of the reversal pattern.
- After point three forms, in point 2, place a pending order Buy Stop; the Stop Loss is somewhat below point 3.
- After the position opens, track the price moving upwards and close the position after ZigZag forms a local high.
Closing thoughts
The ZigZag indicator is quite popular among traders, though, in essence, it simply shows the price fluctuations in a simpler way. The indicator helps see the main price movement clearer, cutting off useless market “noise”. Also, ZigZag is a good helper in identifying Elliott waves.
To my mind, ZigZag is a comfortable and accessible (available on most platforms) instrument that enhances your tech analysis. It will supplement well almost any trading system. With ZigZag, you can automatize (creating an expert advisor) various trading strategies.