Trading Forex, Futures, and Stocks by Synergy Strategy
5 minutes for reading
Forex is quite a complicated business sphere. Hence, many traders struggle for a long time on this market. One solution that may help you yield your first stable results is a maximally formalized trading strategies, the Synergy strategy being one example.
Description of Synergy
This strategy may be used not only on Forex but also on futures and stock markets if there are indicators for the respective trading terminals. For Synergy, timeframes from M1 to MN are suitable, however, I would recommend using it on a longer timeframe, such as H4. I must admit that this strategy works well only on strong movements without pullbacks.
Synergy desktop
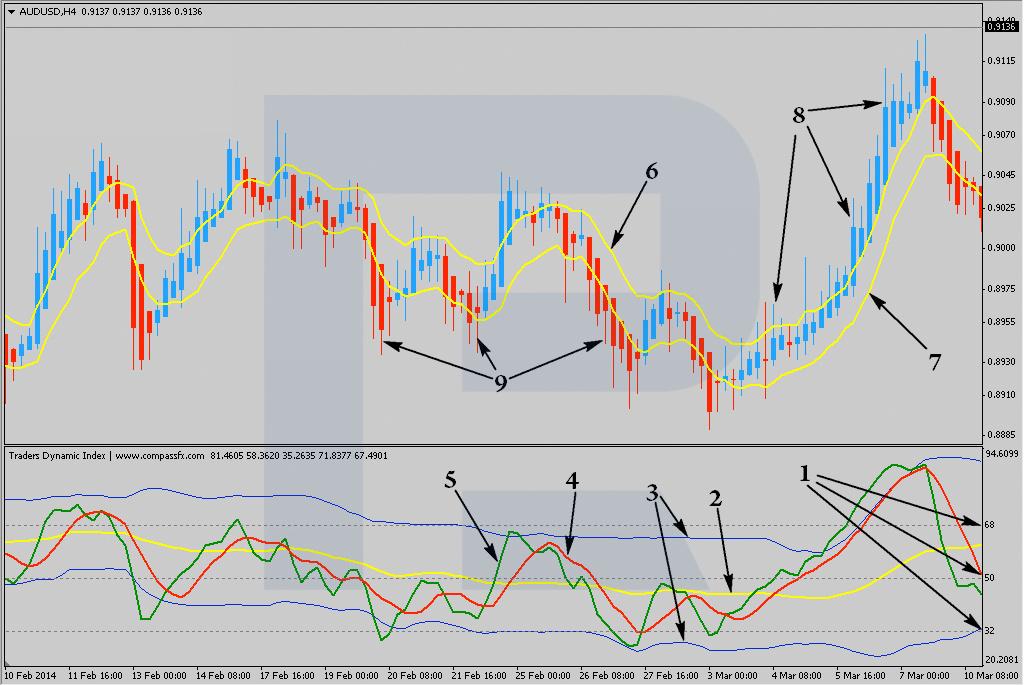
The desktop of the strategy looks as follows:
- the levels of the Trader Dynamic Index indicator; level 50 acts as a filter for Synergy signals.
- Market Base Line, the main line of Trader Dynamic Index, below which no signal to buy and above it - no signal to sell may form, by Synergy.
- Volatility Bands.
- Trade Signal Line, the line that crosses with the signal line most often.
- RSI Price Line, the main signal line of the strategy that creates a part of Synergy trading signals by crossing the Trader Dynamic Index.
- 5-period Smoothed Moving Average, built on High.
- 5-period Smoothed Moving Average, built on Low.
- bullish candlesticks by Heiken Ashi.
- bearish candlesticks by Heiken Ashi.
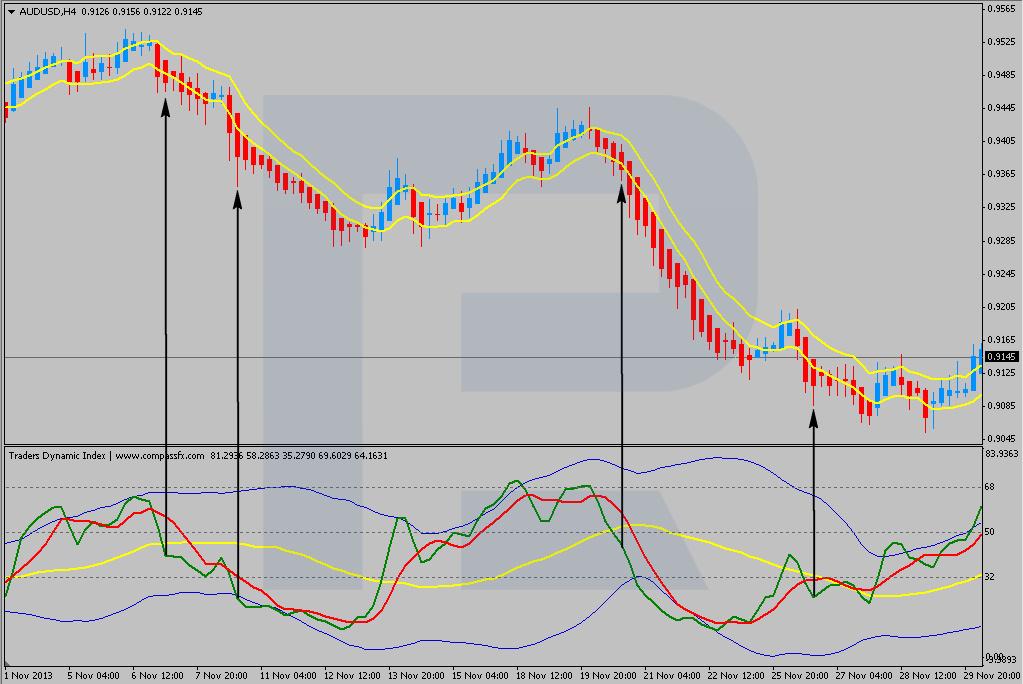
A Synergy signal to buy for Forex, stocks, and futures
As it should be in a maximally formalized strategy, all rules of opening a long position are unequivocal. Here is the list of conditions for opening a buying position by Synergy:
- a bullish Heiken Ashi candlestick must close above the 5-day Smoothed Moving Average (High);
- the RSI Price Line must simultaneously be above the following three lines: the Trade Signal Line, Market Base Line, and level 50 of the Trader Dynamic Index.
Examples of a signal to buy by Synergy

Black arrows indicate the candlesticks at the closing of which all the above-mentioned requirements were fulfilled.
A Synergy signal to sell for Forex, stocks, and futures
To open a short position by Synergy, the following conditions should be complied with at the closing of one candlestick:
- a bearish Heiken Ashi candlestick must close below the 5-day Smoothed Moving Average (Low);
- the RSI Price Line must simultaneously be below the following three lines: the Trade Signal Line, Market Base Line, and level 50 of the Trader Dynamic Index.
Examples of a signal to sell by Synergy
Black arrows indicate the bearish candlesticks at the closing of which all the above-mentioned requirements were fulfilled.
Stop Loss and Take Profit by Synergy
Trading by Synergy, the initial SL must be several ticks below the low of the bullish Heiken Ashi candlestick, when buying. When selling, it must be several ticks (several tens of pips, if there are 5 decimal figures) above the bearish candlestick plus spread. Further moving of the SL is done in several ways. The first way, applicable to buys, is moving the SL constantly under the lowest low of the two recently closed Heiken Ashi candlesticks. When buying, the SL will be moved above the highest high of the two recently closed candlesticks. The second way is to wait until a candlestick of the opposite color appears - then the SL is transferred under this candlestick when buying and above it - when selling.
Alternatively, the position may be followed by one of the described ways only after the RSI Price Line crosses back one of the signal lines. Special attention must be paid to the cases when, at a buy, the green line goes above the blue volatility line and then crosses it back - this means a decrease in the volatility, hence, you may start following the position you have opened by Synergy.
The strategy does not imply using a Take Profit. However, if you have your well-developed ways of defining good levels for locking in profit, I advise adding them to the strategy.
Money management when trading on Forex, futures, and stock markets
As long as trading signals are to be executed fast, the trader must be ready for each of them. That is why, for Synergy, opening positions with a certain lot will suit best: it may be a fixed lot or a lot the size of which is corrected after each change of the deposit size.
Anyway, MS Excel is still with us as well as the software for automatic calculation of the position size, so after a trading signal appears, you can quickly calculate the nearest level for placing a pending order - thus risking a tough percentage of your current deposit. However, to my mind, for this strategy, a lot changing after each change of the deposit size suits best.
All in all, no matter how appealing it is at first glance, Synergy is not that easy. Most likely, to use it successfully, one must be able to wait for strong movements without pullbacks, on which the strategy works well. In a narrow flat, the strategy may harm your deposit considerably, as well as in a slow trend with frequent pullbacks and small impulses. So, first of all, please, test your strategy on a long historical period. And never forget that visible opening and closing prices of Heiken Ashi candlesticks and the prices of the normal candlesticks do not coincide at all! This is to be kept in mind when testing and using Synergy.