Traders Dynamic Index Indicator: Description and Trading

6 minutes for reading
Warning: Invalid argument supplied for foreach() in /web/blogs/sites/blog.roboforex.com/wp-content/plugins/wp_glossary/includes/class-wpg-linkify.php on line 353
Warning: Invalid argument supplied for foreach() in /web/blogs/sites/blog.roboforex.com/wp-content/plugins/wp_glossary/includes/class-wpg-linkify.php on line 353
In this review, we will discuss the use of the Traders Dynamic Index (TDI). It helps define the current market state and find attractive entry points.
You can visit the RoboForex Market Analysis webpage for the latest forex forecasts.
Description of the Traders Dynamic Index
The Traders Dynamic Index (TDI) indicator was designed by Dean Malone for assessing the market state and finding trade signals. The TDI is a complex indicator as long as it is based on three other popular indicators: the RSI, Moving Average, and Bollinger Bands.
The RSI helps to find out whether the current trade is "overheated". The RSI lines are smoothed out by the Moving Averages. The Bollinger Bands help to assess the oscillation amplitude of the price and the direction of the trend. Thanks to being complex, the TDI may be used as a separate trading system.
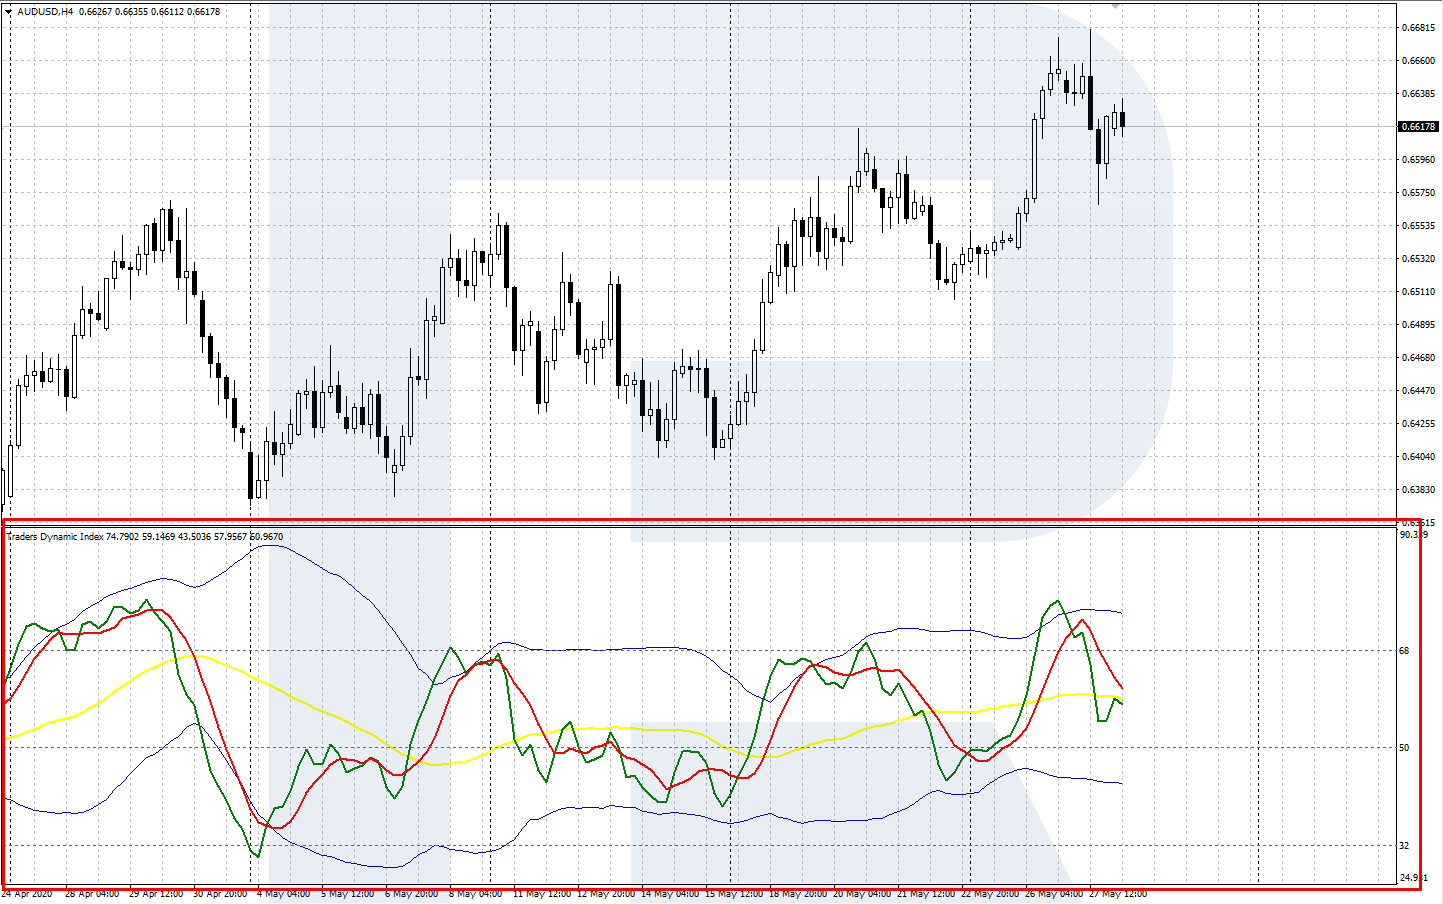
The TDI is drawn in a window below the price chart and consists of five lines: two RSI lines and three Bollinger Bands. The green RSI line is called fast, the red one is signal - it is calculated based on a longer averaging period. The RSI lines show the strength and volatility of the market. When they cross, they give short-term TDI signals.
Two of the Bollinger Bands are blue, they constitute a trading channel; the yellow line is called the middle, or main, line. The central axis of the indicator is level 50; levels 32 and 68 are also marked. The area above 68 is the overbought zone and the area below 32 is the oversold zone, as in the classical RSI.
Levels 68 and 32 help to define market reversals. If the yellow line crosses level 32 downwards, a local low forms in the market. A subsequent breakaway of level 32 upwards signals a reversal or the beginning of an ascending correction. If the yellow line rises above 68, a local high forms in the market. A breakaway of this level downwards signals a reversal or the beginning of a descending correction.


Installing and setting up the indicator
To install the TDI to the popular MetaTrader 4, copy the file with the indicator to the Indicators folder: open the Main Menu, proceed to Files/Open data catalog/MQL 4/Indicators, copy the file and restart the terminal.
The TDI will appear in the folder with the user indicators, and you will be able to add it to the chart via Insert/Indicators/User/Traders Dynamic Index. Alternatively, left-click the TDI in the Navigate window and drag it to the chart of your instrument.
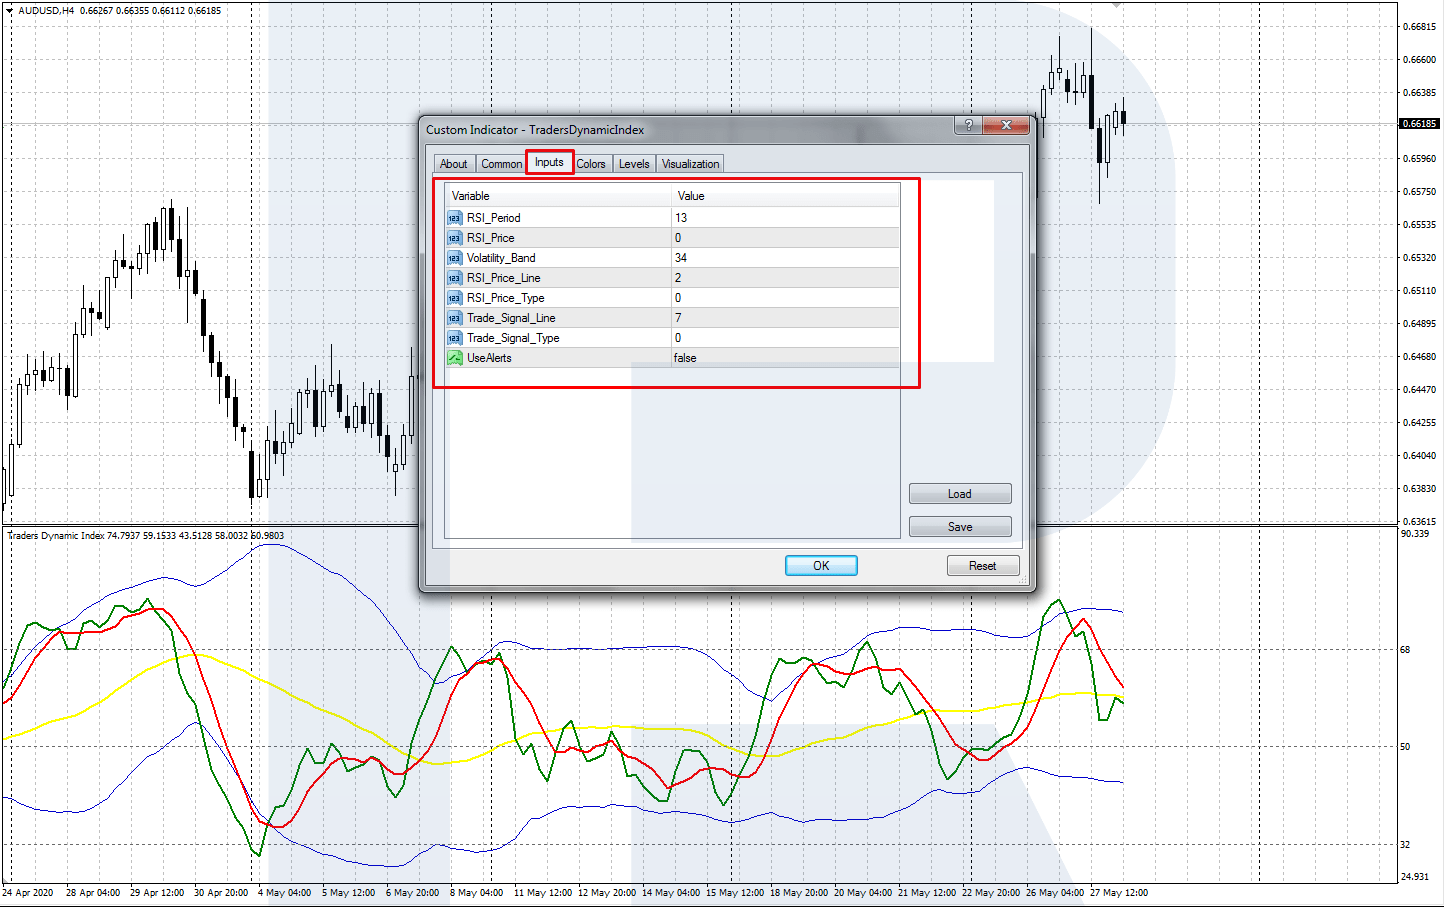
In the set-up window, you may change the following parameters:
- RSI_Period (13 by default) is used for calculating the lines
- RSI_Price (0, Close by default),. where the digits mean:
0 - Close
1 - Open
2 - High (of the candlestick)
3 - Low (of the candlestick)
4 - Median Price (H+L/2, the median price of the high and low)
5 – Typical Price (H+L+C/3, the median price of the high, low, and close)
6 – Weighted Close (H+L+C+C/4)
- Volatility_Band (34) is the period of the Bollinger Bands indicator
- RSI_Price_Line (2) is the period of the green line
- RSI_Price_Type (0) is the averaging method of the green line, where the digits mean:
0 - Simple
1 - Exponential
2 - Smoothed
3 - Linear Weighted
- Trade_Signal_Line (7) is the period of the signal red line
- Trade_Signal_Type (0) is the averaging method of the red line, set up as RSI_Price_Type
- UseAlerts (false): you may switch on a bleeper at the crossing of the red and yellow lines
The TDI works well with the default settings. You may, however, change them at any time and test on history, choosing those that suit you.
Trading signals of the TDI
Apart from market analysis, the TDI generates the following trading signals.
The crossing of the green and red lines
The crossing of the green and red lines gives signals for short-term trading. The cross rather often, so we need to use stronger signals, which are crossings in the overbought/oversold areas.
If the fast green line crosses the signal red line from below, it is a signal to buy; if vice versa, it crosses the red line from above, this is a signal to sell. Entering the market, place the Stop Loss behind the nearest local high/low. Try to take the profit at the channel borders (the blue lines) or an inversed crossing of the green and red lines.
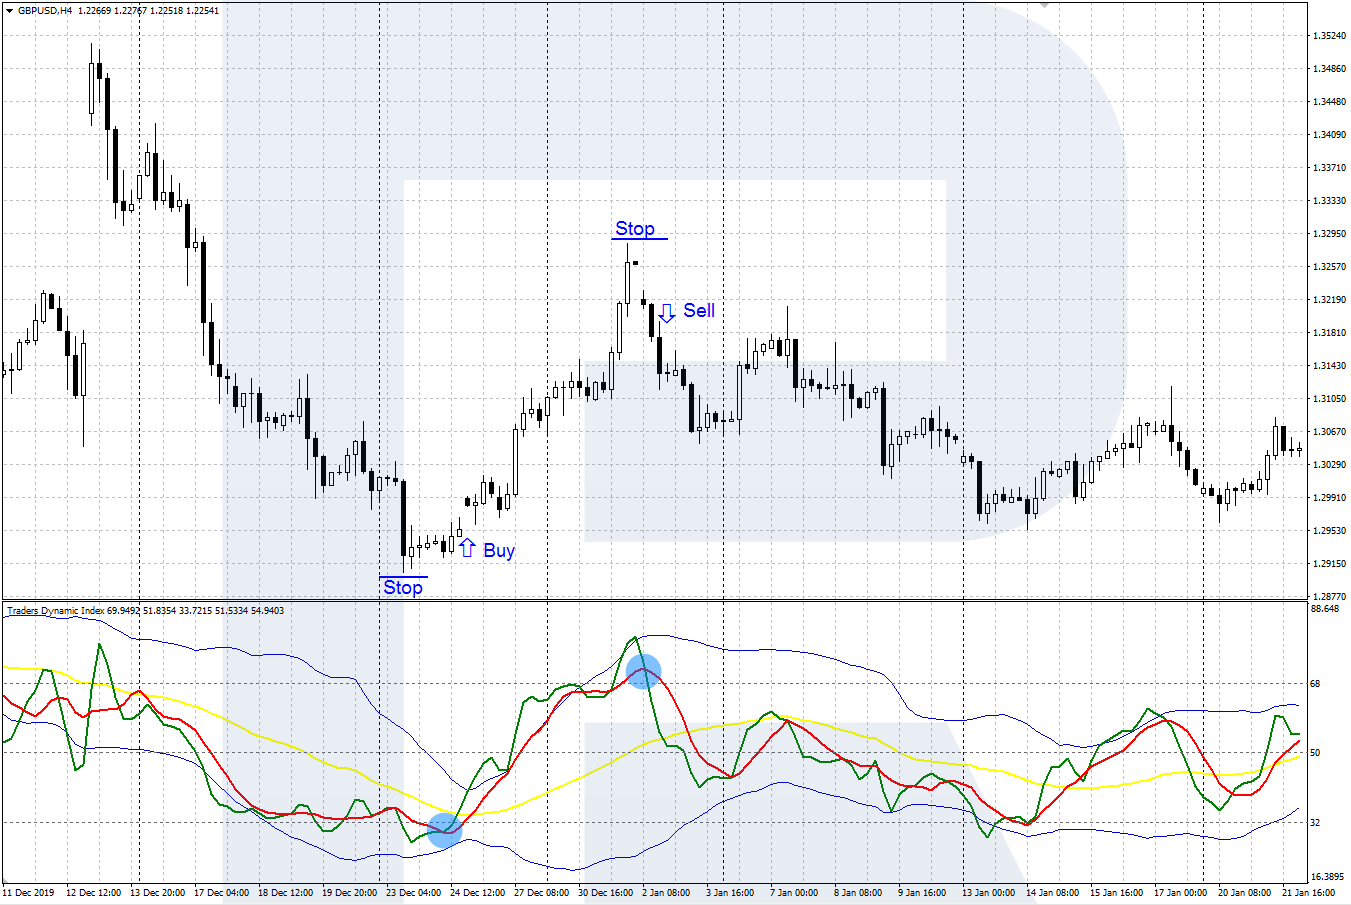
The crossing of the red and yellow lines
The crossing of the red and yellow lines gives a more trustworthy long-term signal.
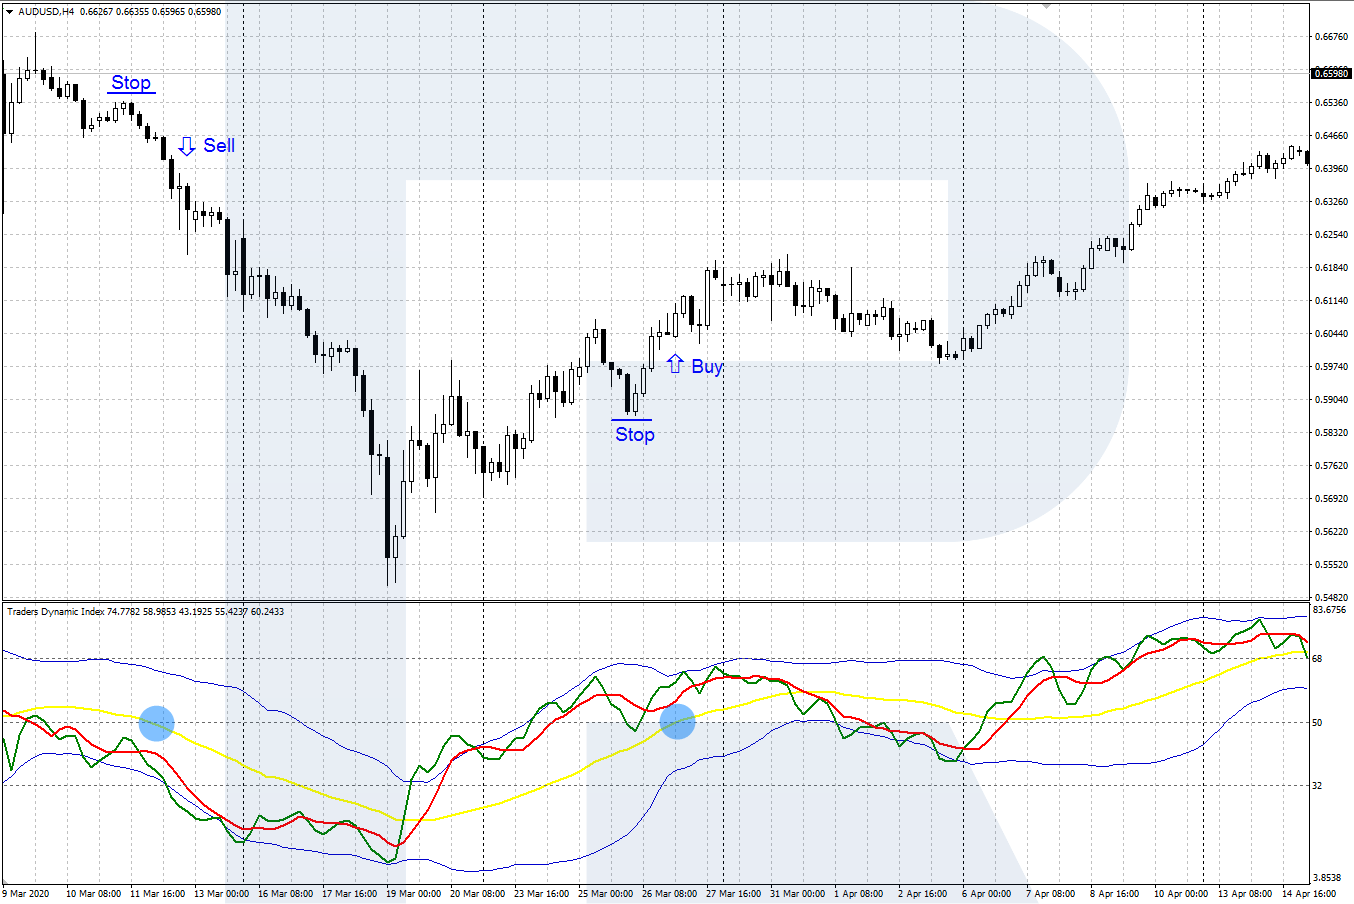
When the signal red line crosses the yellow one from below, it means the bulls are ready to attack and signals to buy. And vice versa: if the red line crosses the yellow one from above, it means the market is bearish and signals to sell. The SL is placed behind the local high/low; take the profit at the important support/resistance levels.
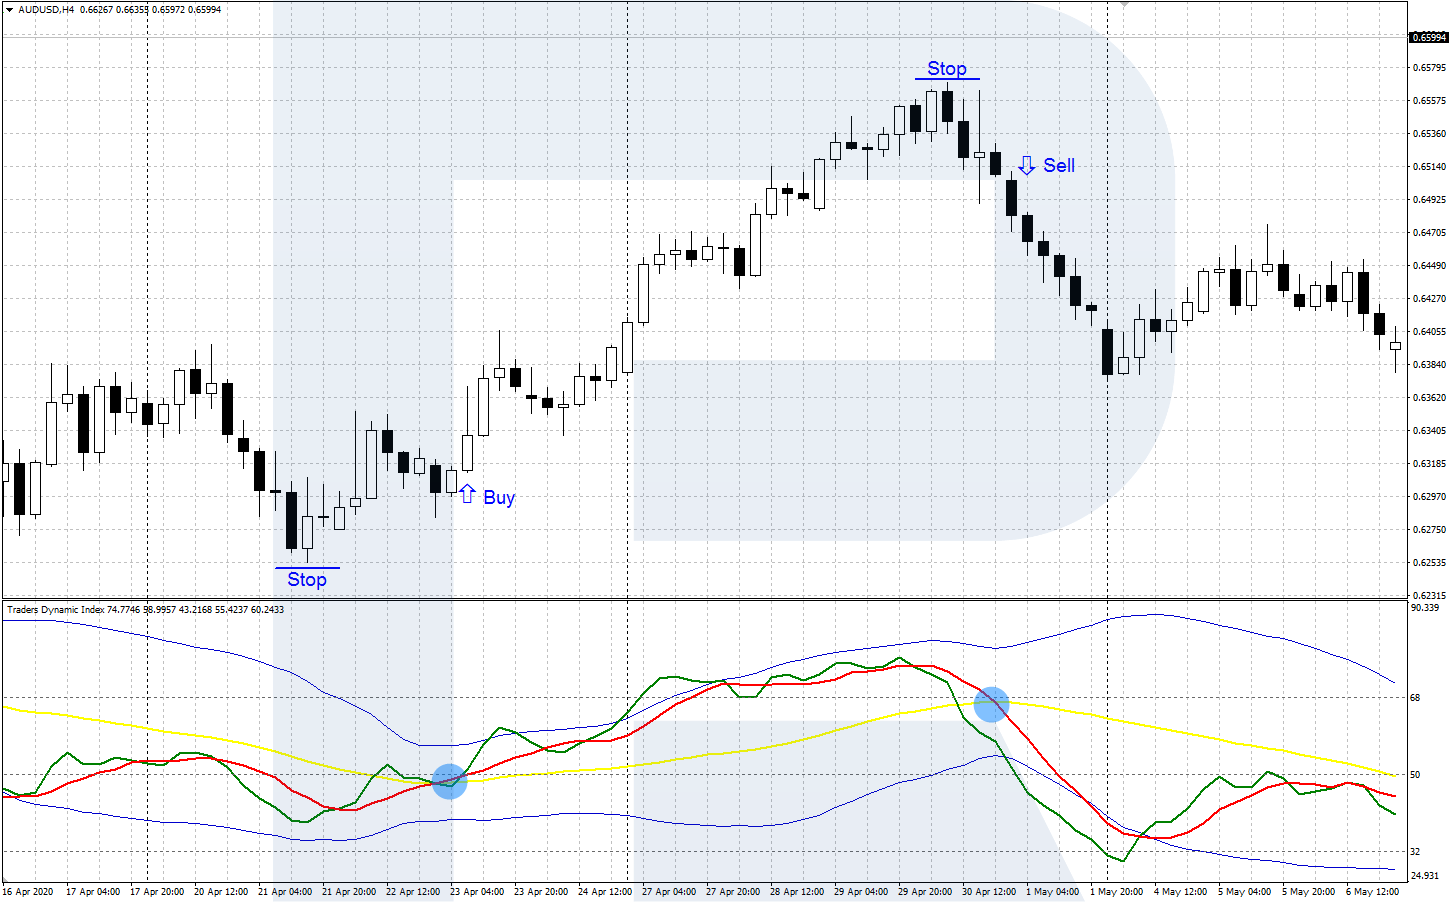
The crossing of levels 32, 50, 68 by the yellow line
Another trading signal emerges when the yellow indicator line crosses levels 32, 50, or 68. This is a rarer long-term trading signal, especially if it appears on longer timeframes.
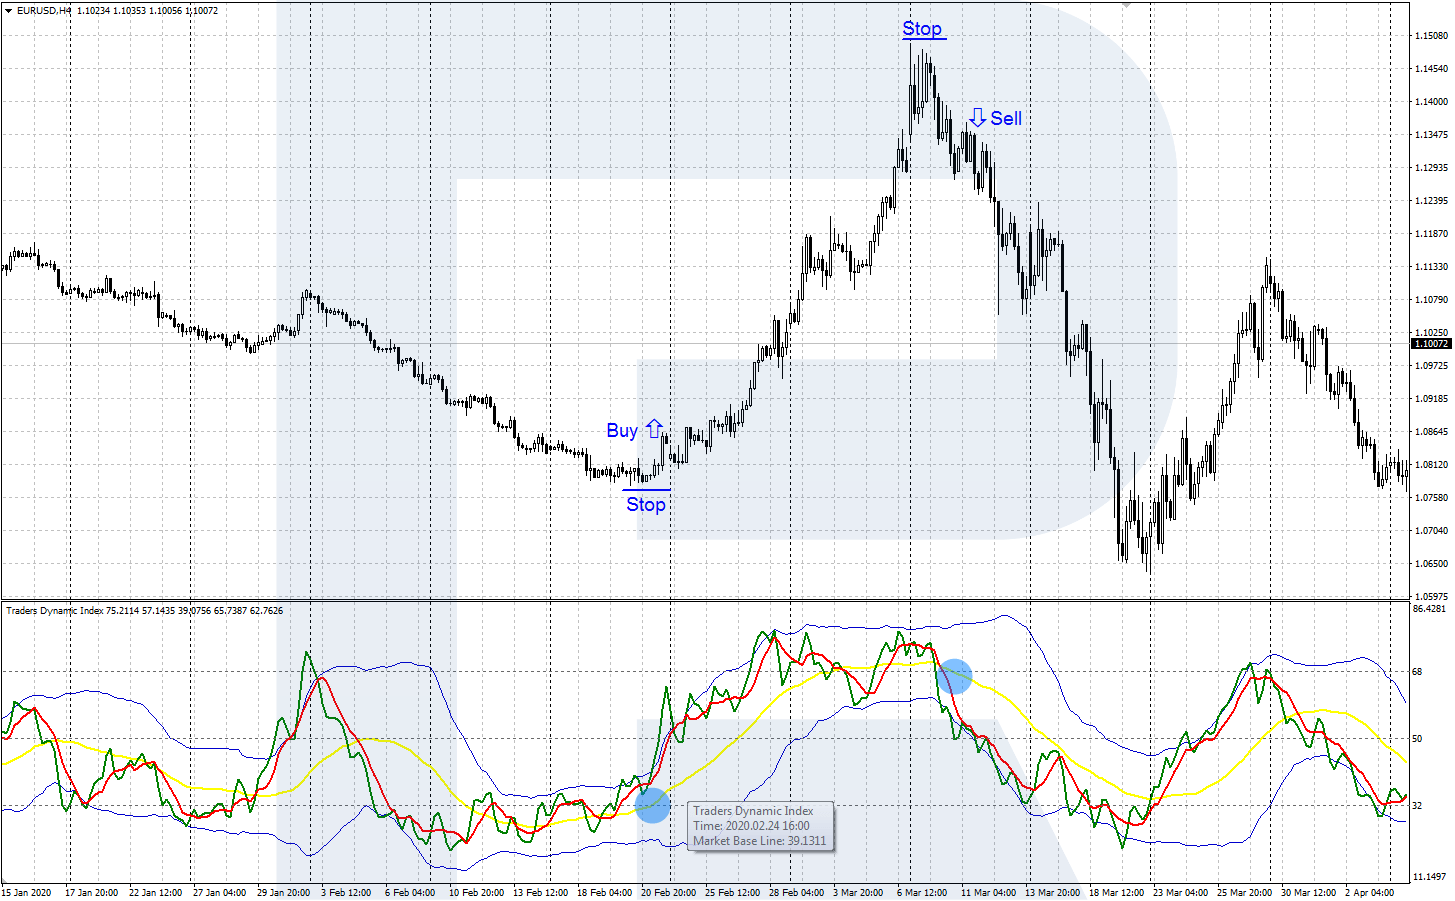
The central axis of the TDI is level 50. If the yellow line crosses it from below, this is a signal to buy; if it crosses the level from above, this is a signal to sell. To make the signal realization more probable, use it alongside the breakaways of the support/resistance levels or lines, the formation of new price patterns, etc.
An escape from the overbought/oversold areas is the strongest long-term signal. If the yellow line e[its the overbought area and crosses level 68 from above, it is a signal to sell. When the yellow line exits the oversold area, a signal to buy forms, confirmed by the crossing of level 32 from below. Put the SL behind the local extremes and take the profit when the inverted long-term signals appear.
Bottom line
The TDI indicator uses a complex approach to the market, using several classical indicators at once: the RSI, Moving Average, and Bollinger Bands. Regardless of the TDI being an independent trading system, to make the signals more reliable, I recommend using it alongside classical tech analysis, price patterns, and Price Action patterns.