Momentum
Momentum is an indicator of the speed and direction of price change over a specific time frame.

3 minutes for reading
Definition of Momentum
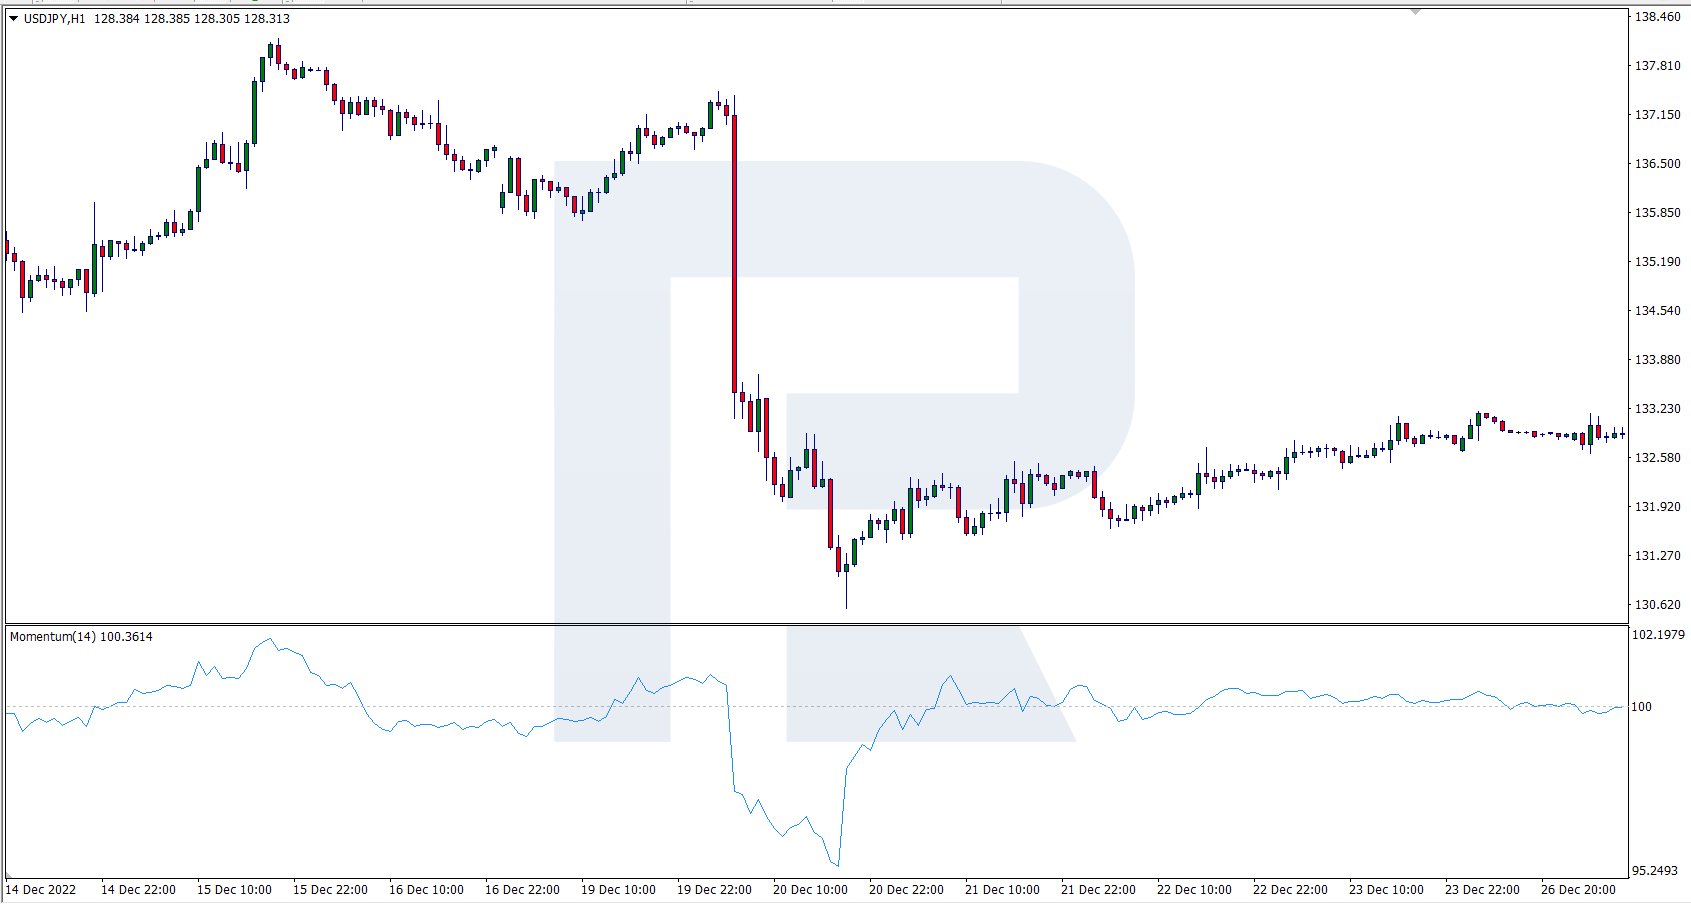
Momentum is an oscillator indicator that compares the closing price of the current interval with the closing price of a set time period. In simple terms: it shows the speed and direction of price movements. It is placed below the price chart and is a single solid line.
Based on analysis of previous bars, Momentum can show likely trend reversal points. When it reaches maximum values, the indicator signals the possible continuation of a positive trend. When reaching its minimum value, it indicates that quotations are likely to continue moving downwards in the near future.
How to calculate Momentum
The original formula for calculating the indicator:
Momentum = Close (i) - Close (i-n)
In the formula:
- Close (i) - The closing price of the last candlestick
- Close (i-n) is the closing price n periods ago
- n is the period of the Momentum indicator
The changed formula for calculating the indicator:
Momentum = Close / Close (i-n) * 100
How to install and configure the Momentum indicator
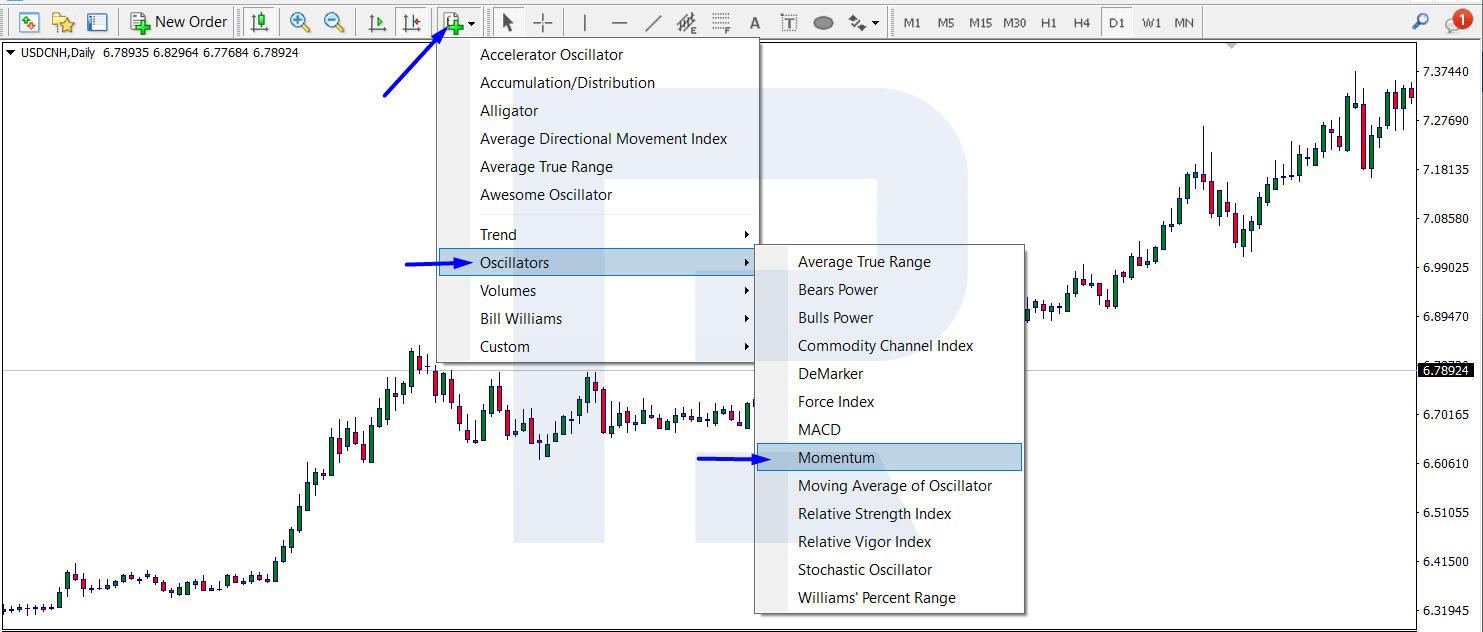
The Momentum indicator can be found in the Indicators tab. When installed, it opens in a separate window below the chart. The following parameters can be changed in the indicator settings:
- Period – the default setting is 14
- Apply to – the suggested options can be applied to the calculation; the default setting is to apply to Close (closing price)
- Style – colour adjustment of the indicator line
- Fix a minimum and maximum – set the boundaries within which the indicator will move
- The level is often set at 100%. A movement of the indicator above the 100% level is a sign of an uptrend, while a movement below the level is a sign of a downtrend


How to interpret Momentum indicator signals
- A buy signal. The indicator crosses the level of 100% from bottom to top, which indicates a probable continuation of the upward trend. Stop Loss is set for the nearest price minimum, and Take Profit is in ratio with Stop Loss 1:3 or after the indicator updates the local maximum
- Sell signal. The indicator crosses the 100% level downwards, indicating a likely continuation of the downtrend. Stop Loss is set for the nearest price maximum, and Take Profit is in the ratio with Stop Loss 1:3 or after the indicator updates the local minimum
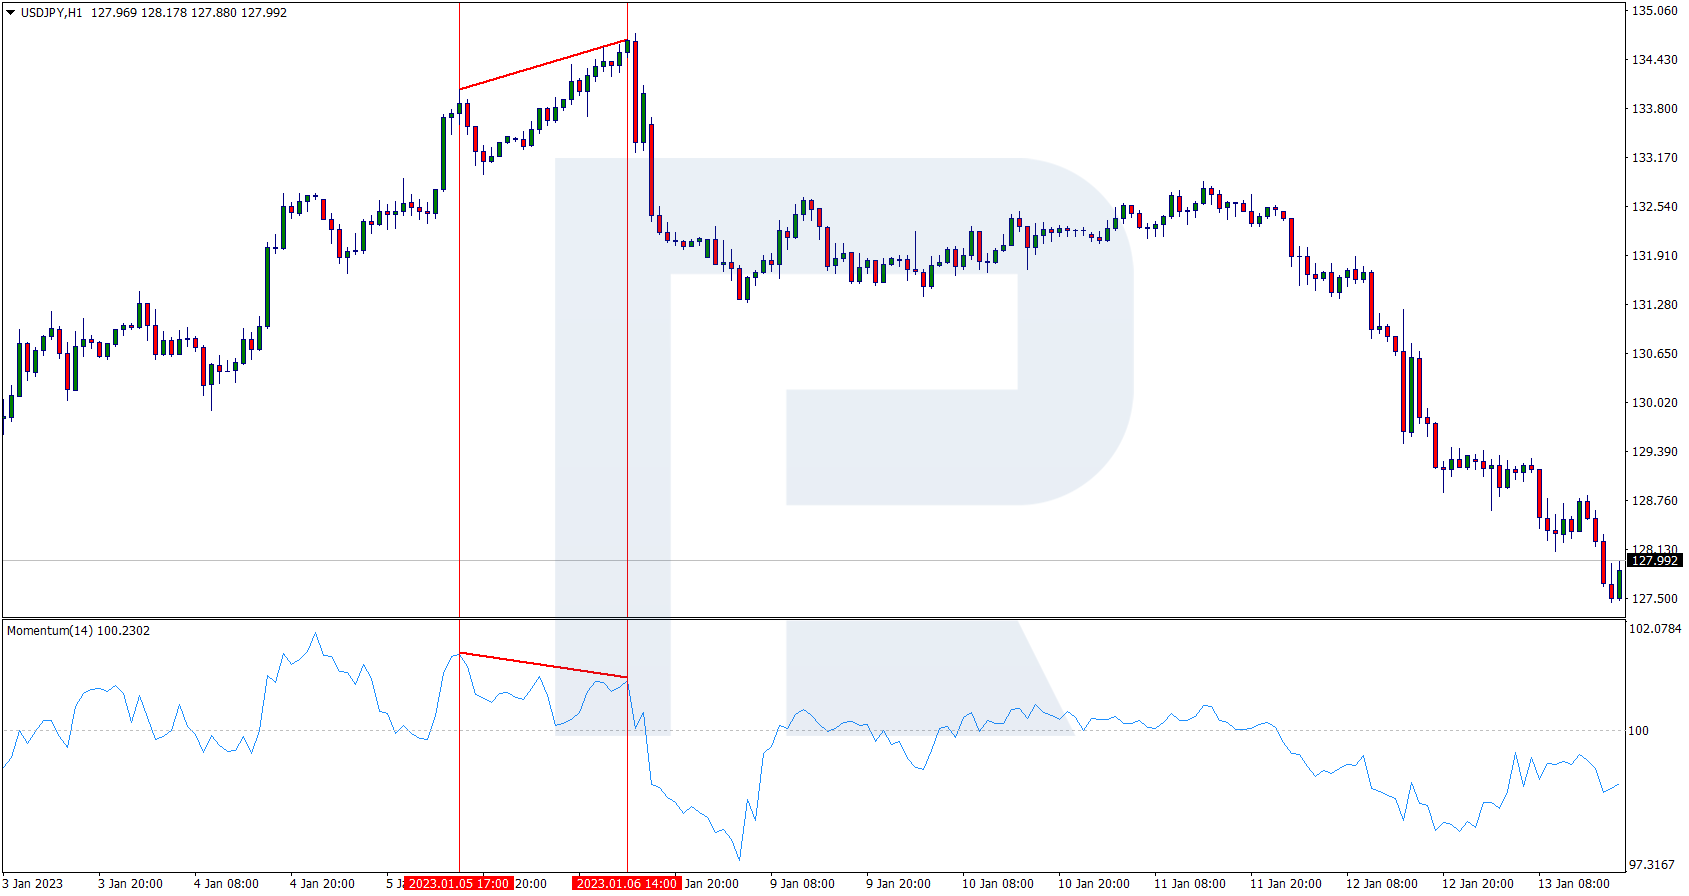
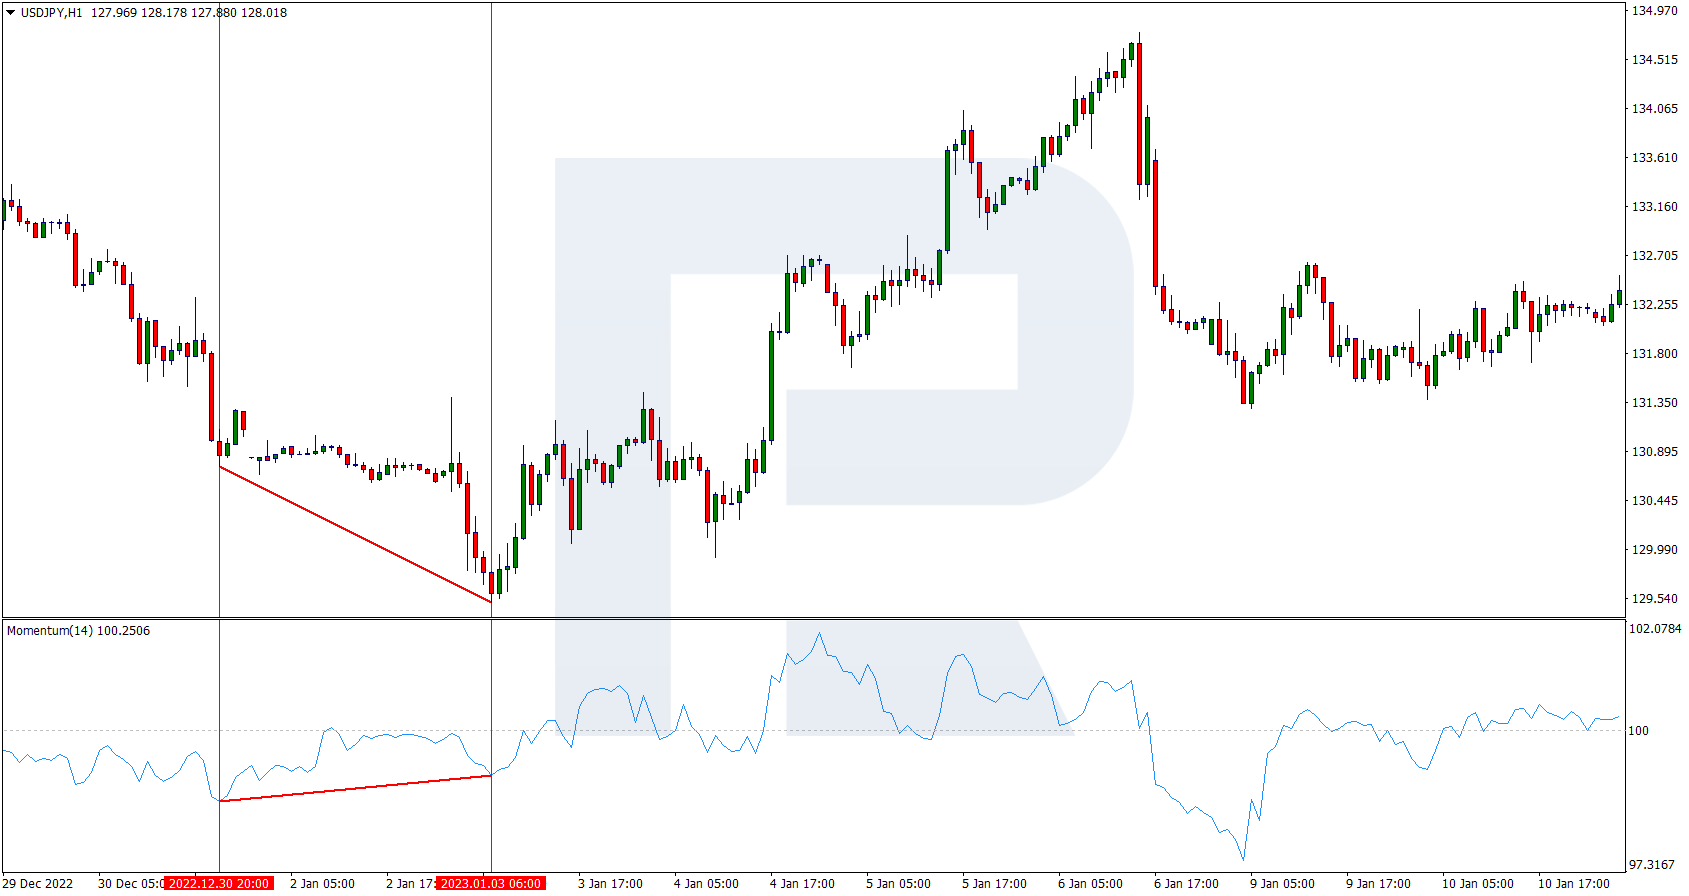
- Divergence is the separation of price action from the indicator. The chart shows a new maximum or minimum value, but the indicator has not reached the previous maximum or minimum. A position is opened after the formation of the divergence in the opposite direction to the previous price movement


Pros and cons of the Momentum indicator
Pros:
- Versatility
- A simple formula is used for the calculation
- Open-source code
Cons:
- False signals when volatility increases
- Rare divergence signals