What is a Gap? Main Types and Gaps Trading

7 minutes for reading
What is a Gap?
In order to get a full idea of a Gap, let us have a look at the stock market as it features the full range of the peculiarities of this phenomenon. Our example will be the stock index DAX, describing the state of the German economy. It is comprised of the indices of 29 biggest German companies; in a terminal, it is market as DE 30.
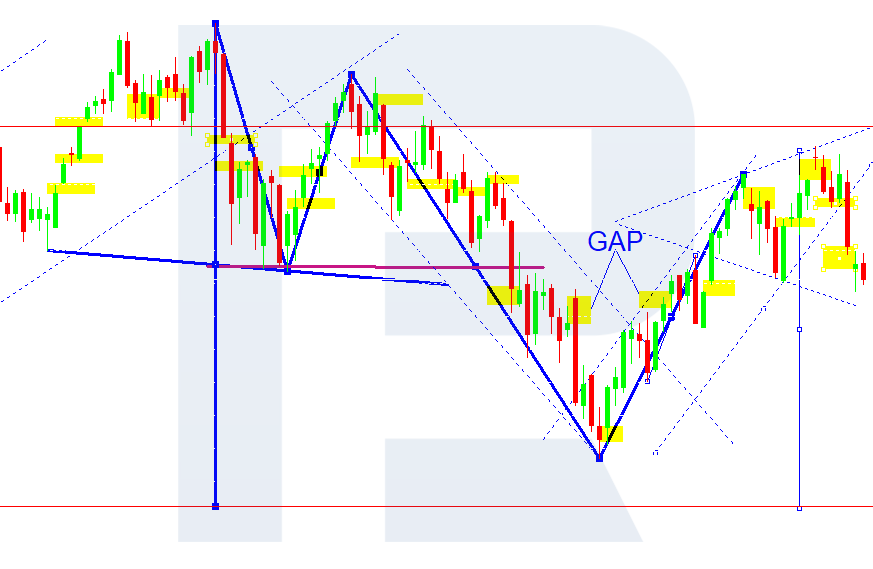
The Gap is shown in the chart above as yellow rectangles. This is a practical gap in the flow of quotations reflecting a serious difference between the opening and closing prices in trading sessions. A quick look at the chart captures a large number of such phenomena. This means that if we classify them we may find a lot of opportunities to use them in trading. But first, let us talk about the reasons which a Gap emerges for.
Reasons for the Gap emergence
As a rule, all markets close Friday evening and open Monday morning. During this time, major events may occur in the world: natural and industrial disasters, terrorist acts, as well as elections and speeches of political leaders. All this may make investors reprice the assets abruptly. Thus, pending orders accumulate; upon market opening, they trigger at the opening price without due coverage because of the lack of demand/supply. A weekly Gap, which we can see in the chart, emerges. Of course, such Gaps are featured on daily as well as hourly timeframes, too. Gaps inside a daily session also exist; however, it has no connection to the news, and we shall discuss this phenomenon in subsequent posts about gaps and strategies. And now let us try to classify weekly Gaps.
Types of the Gap
Depending on the direction, there are the following types of the Gap:
- Downward Gap appears when the opening price of a candlestick is much lower than the closing price of the previous candlestick.
- Upward Gap appears when the opening price of a candlestick is much higher than the closing price of the previous candlestick.
Summing up the above said, we single out the following four types of the Gap:
- Simple Gap is characterized by a low market interest to the traded instrument after the Gap. The price is moving inside a narrow consolidation range, volumes are small.
- Gap Tear is followed by steep growth of the volume of trades and leads to the trend continuation in the direction of the Gap for some time.
- Gap Peel features both an increase in trade volumes and the continuation of the trend. Normally appears in the middle of the market trend and practically extends the wave two times.
- Gap Exhaustion is characterized by a market reversal right after the Gap and the development of a contrary trend and changes the direction of development with a very large trade volume.
How to trade Gaps?
There is a classic, conventional way of trading Gaps. Seven out of ten Gaps are traded on closing. The remaining three are traded on the continuation of the trend. How should a trader tell one type from the other? This is what indicators are used for.
Firstly, as has been said before, volumes can give a hint, but not an exhaustive one. Secondly, even a simple Moving Average (MA), following the trend, may be of much help.

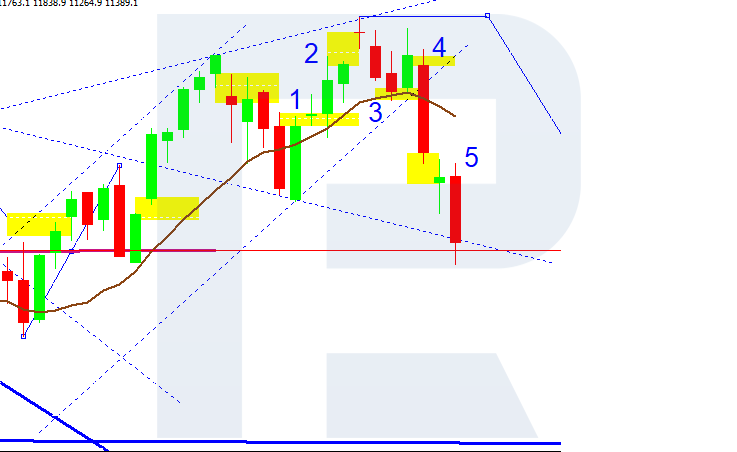
Now, we shall discuss, HOW and, more importantly, WHAT we shall be able to trade. Let us have a look at the 5 last Gaps on the market.
Let us proceed to example 1.
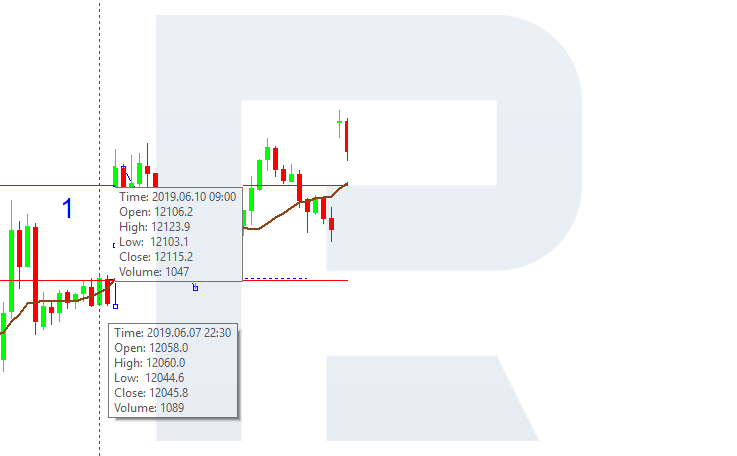
Choose M30. Friday, June 7th, closing price 12045.8. Monday, June 10th. Opening price 12106.2.
Gap upwards.
12106.2 - 12045.8 = 60.4 Gap
A Gap bigger than 25 on this instrument is always of interest.
The volume of the last candlestick on Friday is 1089.
The volume of the first candlestick on Monday is 1047.
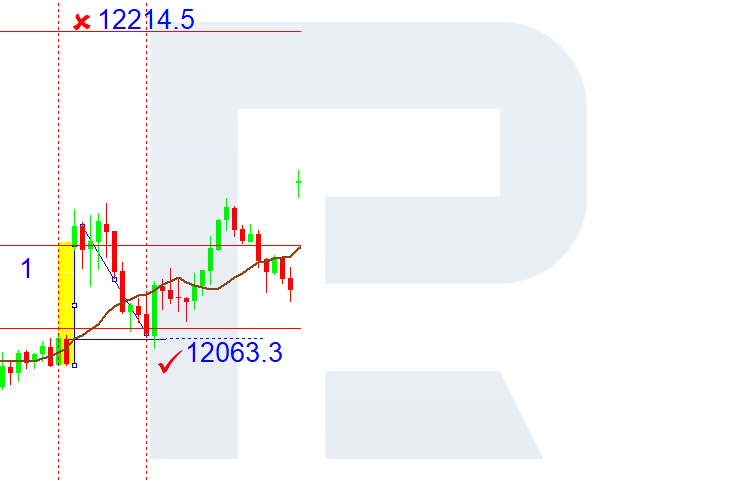
CONCLUSION. The Gap is simple. The interest in the instrument has subsided. Hence, the market will be closing the Gap. From the moment of opening, a SELL follows on the next candlestick at the price of 12123.9. We hold the order with a Take Profit.
12123.9-60.4=12063.2
Stop Loss 12123.9+(60.4×1.5)=12214.5
1.5 - correcting coefficient.
It is rather easy to deal with the Gap No 2 the same way.
The Gap is 178.2; upwards, exhaustion. The uptrend is over. We may work for closing the Gap. Now we look for an M30 for a sell.
Gap No 3, upwards, simple, 24.3. Not interesting, better skipped.
Gap No 4, 58.1, downwards, tear. Must look for an M30 to buy.
Gap No 5, 167.5, downwards, peel. Must look for an M30 to sell.
Summary
All said above about the stock market on the whole and the DE 30, in particular, is applicable to the exchange market as well. Trading Gaps is one of the riskiest ways of trading and a very aggressive one. A trader should get a practice of using this method on a demo account. And only upon reaching positive results, they may use it on real accounts.
I wish everyone successful trading.


