How to Trade with Head and Shoulders Pattern

7 minutes for reading
The Head and Shoulders pattern is a classical pattern of technical analysis. Let s have a look at its main elements as well as the characteristics of trading with the use of it.
How to define a Head and Shoulders pattern?
First and foremost, it is worth remembering that this pattern forms in the end of an uptrend and signals a possible reversal. I say possible because Forex is unpredictable, as any financial market is, and it would be at least unwise to insist that the forming pattern is necessarily Head and Shoulders and that the market will soon make a reversal. On the market you can never be sure that you interpret the things right. However, the forming graphic pattern will let you make a supposition about the upcoming movement and, in the presence of certain conditions, enter the trade in the chosen direction.
Note that the longer the timeframe which the pattern has formed on, the more important the pattern is. In order to understand how the Head and shoulders pattern forms, let us look at the screenshot:

After an uptrend on the EUR/USD chart, the pattern in question formed on H4. To make it clearer, I have circled the pattern consisting of the right and left “shoulders” and the “head”, the latter being the highest peak of all three. It is worth noticing that the right shoulder is lower than the left one, thus the importance of the whole pattern enhances. The shoulders are not always symmetrical and may have their minimums on different levels. There exist formations with almost horizontal “necks” ad well as with inclined ones.
Along the minimums of the shoulders you can trace the neck, which is, in fact, the support level. A breakthrough of this very line is regarded as a signal for selling.
Apart from this, the important parameters of the pattern, according to the classical technical analysis, are as follows:
- trade volumes that increase after a breakthrough of the neck;
- the target level;
- using of the support line (the neck) as the resistance.
We shall discuss all the parameters in more detail later.
When to enter the trade and where to place a Stop Loss?
One can enter the trade through this pattern several ways:
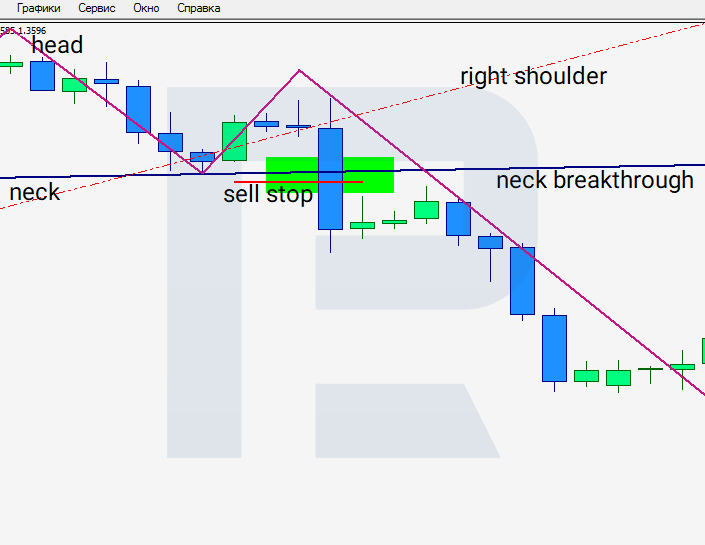
1. Put a pending order Sell Stop under the neck or enter from the market, if you are at the computer, following the upcoming breakthrough.
The drawback here is that you can enter the market on a false breakthrough, in which case the price will make a spike and go up, canceling the Head and shoulders pattern. Such hasty entrance of the market entails a big risk but allows to enter the market at a best price.
2. Enter the market at the test of the neck from below, in other words, at the moment when he support turns into the resistance.
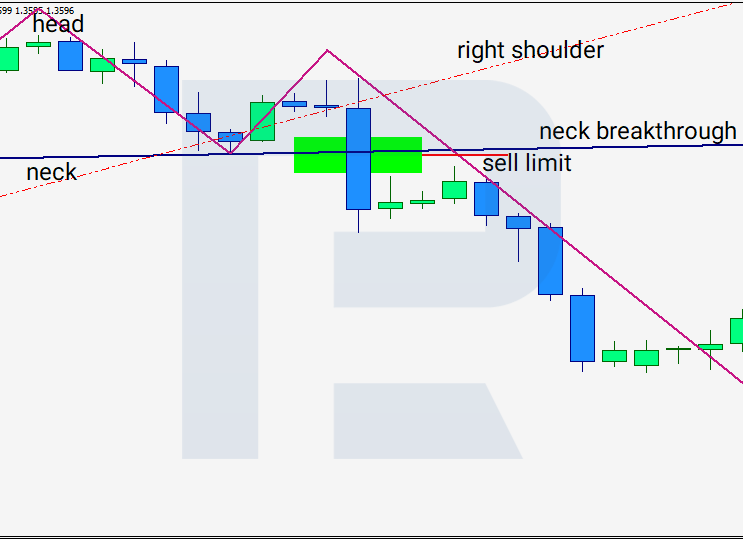
After the breakthrough, when the candlestick closes below the neck line, you can place a limit order Sell Limit or keep monitoring the situation and enter the position from the market. The advantage of such entering is your confidence in the breakthrough. The drawback is that the price does not always reach the neck line or does not return for testing at all, while the breakthrough is followed by a strong movement virtually without pullbacks. In our example the price would not reach the limit order.
3. The most conservative entrance is selling upon a breakthrough of the local minimum, emerging after the breakthrough of the neck.
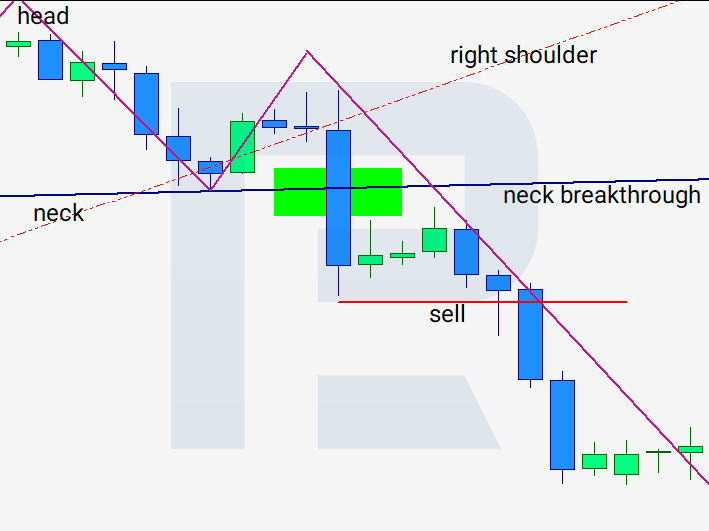
The drawback of this approach is in the fact that you miss a rather large part of the movement and get a high risk in the trade, because the Stop Loss will be at the same place as in two previous cases, while the potential target will be closer to the entrance point.
The biggest mistake of the beginners, trading with the Head and shoulders pattern, is a too hasty entrance. Traders try to enter the market before the breakthrough of the neck. But remember: until the neck is broken through, the pattern is not considered complete, so always start acting after the breakthrough.
In addition, you can use indicators (such as the MACD), which help detect the divergence between the peak of the left shoulder and the head, confirming the expected price reversal.
The Stop Loss is usually placed under the peak of the right shoulder. One option of the third type of entering the market will be placing the Stop Loss above the neck line, i.e. the current resistance level. This will help minimize risks, though it should be in compliance with the current market situation (for example, executed upon measuring the distance that the price has covered after the breakthrough).
Trade volumes
According to the classical technical analysis and interpretation of the Head and shoulders pattern, an important parameter is an increase of the trade volume upon the breakthrough of the neck. This signifies that traders enlarge their positions, which entails further decline of the price, so the entrance along the pattern is confirmed.
When the price moves from the left shoulder to the head, the volumes also shrink; conversely, a slide of the price from the peak of the head to the foundation of the right shoulder leads to an increase of the volumes. However, it is worth remembering that this rule cannot be used on Forex as there is no volume indication as it is there. So, the information may be used on other trading platforms, where the trader has access to this data, such as on futures and stock markets.
How to calculate the target level of Head and Shoulders pattern?
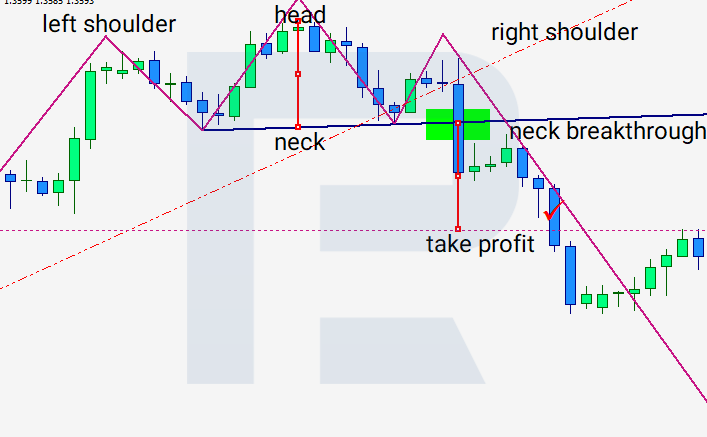
The target on the Head and shoulders pattern, i.e. the point where the Take Profit will be places, is calculated as the distance from the peak of the head to the neck line, traced from the breakthrough point. In our example this distance is 136 points.
Note that it is a design value, that is why additionally other factors hampering the price movement should be taken into account, such as strong resistance lines in the way. In these cases the position may be closed when the price reaches a significant level, or a part of the position may be closed there, the other part of it being transferred into the black.
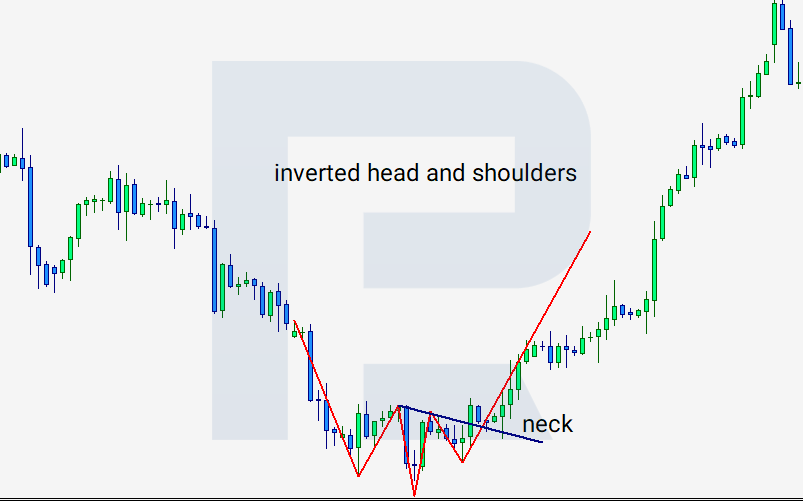
Together with the pattern signaling a reversal on the uptrend, its mirror image – the Inverted Head and shoulders – is considered. It has the same parameters and conditions of market entrance, the only difference being that is forms in the end of a downtrend and signifies growth of the price. On the chart it looks as follows:
Closing thoughts
The last but not least, it should be noted that beginner traders frequently see the Head and Shoulders pattern though it is not there, just because they want to see it. That is why I would like to quote Eric Nyman.
Do not look for trend figures where there are none. Do not invent them. No one doubts the power of your imagination.


