False Breakouts on Financial Markets: How to Detect and Use?

7 minutes for reading
Hi everyone, today I'm going to talk about false breakouts. In certain cases, it might be unclear to the trader whether there has happened a breakout of the resistance level and, hence, the bullish trend will continue. Such a breakout might be false so that the price will reverse quite soon and go in the opposite direction. In certain cases, such formations may provoke a full-scale reversal of the trend.
As a rule, such things happen at the moment of testing the support/resistance levels. This situation is similar to a reversal. However, it might be a test of a normal trendline, as well as the completion of such patterns of tech analysis as the Triangle or Head and Shoulders, when the price escapes the pattern and the falseness of such a breakout becomes questionable.
This type of breakouts pertains to chart analysis. If we are evaluating the chart without indicators, our evaluation will always be subjective to some extent. It is should be kept in mind that this is an integral part of chart analysis.
What is a false breakout?
In most cases, a false breakout is the "tail" of a Japanese candlestick, which means that the price tried to break the support level away but the sellers were not strong enough to secure themselves under this level. Then the price bounces and moves upwards. This might signify the strength of the buyers and forecast further growth.
Types of false breakouts
Larry Williams was one of the first experts to describe false breakouts. He singled out such a type as Specialists Trap. If the market is bullish, the pattern is formed at the breakout of the resistance level closing much higher than the resistance area. The minimum of the candlestick preceding the one with the breakout acts as a sort of a critical level here.
In the case of falling and breaking this level away, we should expect a market reversal and overall falling. Larry Williams thinks that here we can see the false breakout form when traders enter the market emotionally.
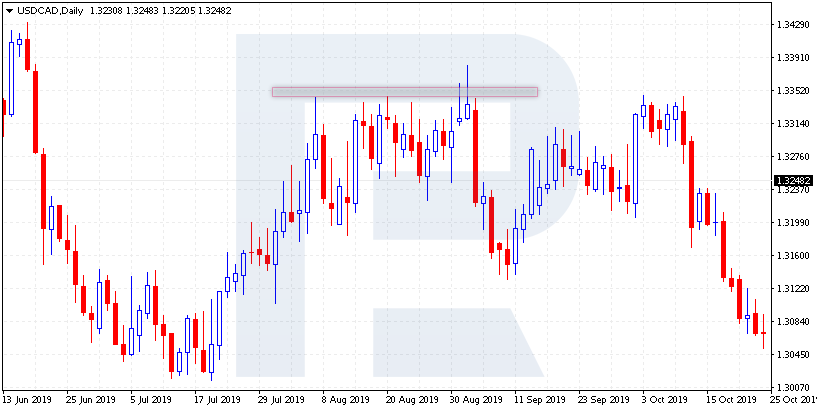
Bullish trap
This pattern is formed in an uptrend. After a bounce off the resistance level, the prices consolidate in a flat as if the market were gathering its strength. The movement may be extended: if we are on daily timeframes, it might take 3 to 5 days. Then this level is broken away; it seems that the bulls have managed to move the market even higher, and the movement is on the verge of continuing.
However, the price pulls back under the resistance level. And if it breaks through the minimum of the day when the resistance level of those 3 days was broken through, we will witness a false breakout or a Bullish Trap.
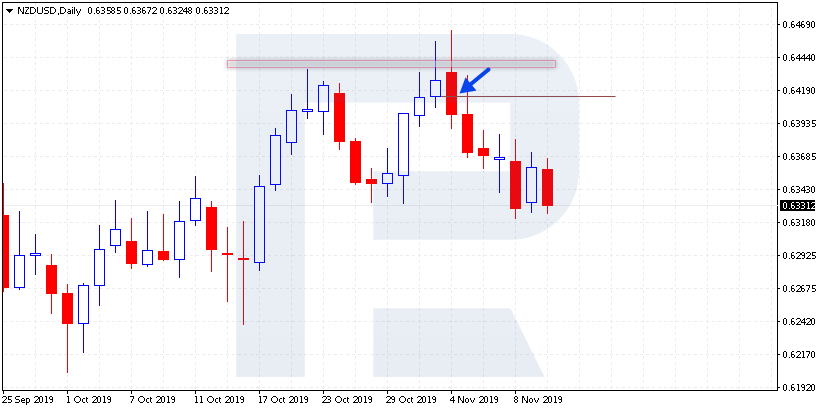
This situation means a market reversal and the beginning of a decline. However, the author does not name any goals to which the market will be declining. In chart analysis, such structures remind very much of a Double Top.
Bearish Trap
The situation is mirror-like. The trap is formed in a downtrend. Here, the prices also consolidate during 3-5 days after a bounce off the support level. Then the bears make another attempt to break through the local minimum to develop the downtrend. The closing prices of the day may break well through the support level so that it will seem that the market is ready to decline.
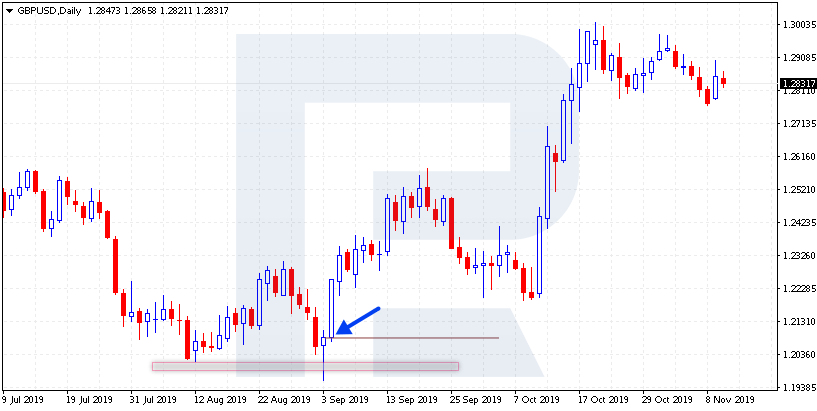
However, a couple of days (normally three) later, the prices return above the support level. This might signal a potential reversal and the weakness of the bears that have got into a trap with their selling. This situation is similar to the Double Bottom reversal pattern.
False breakout of a flat
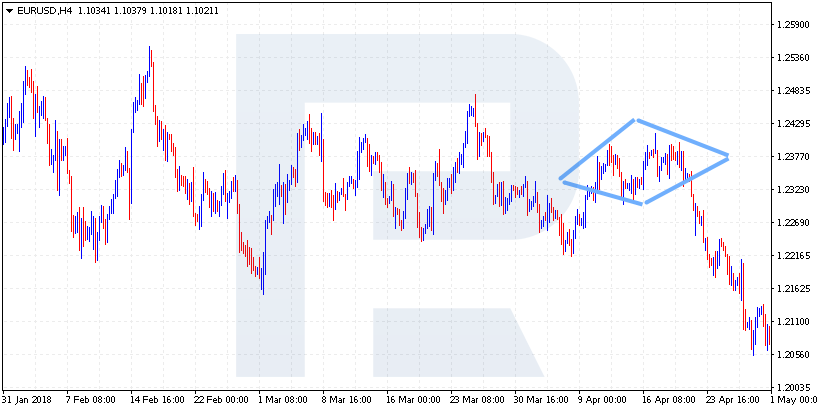
It is formed at the moment when the price is squeezed inside a flat. There are clear support and resistance levels. At the moment when the price escapes the flat, it closes well below the support level or above the resistance level. However, next, it returns into the channel and moves in the opposite direction.
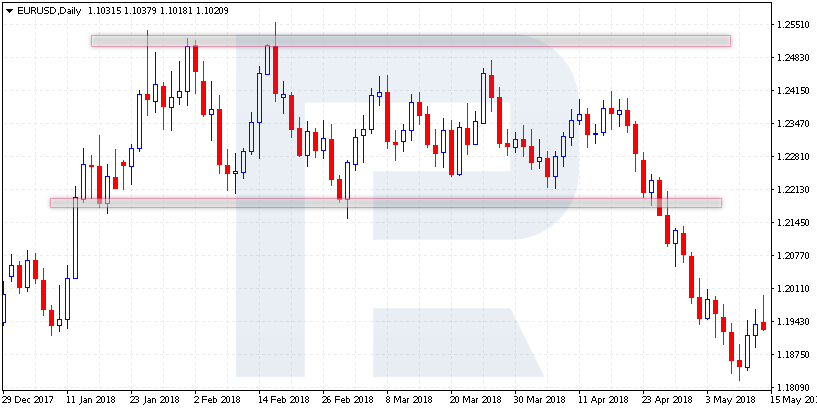
Here, there is a small trick. In most cases, a true breakout of such a channel is preceded by a Diamond pattern on smaller timeframes, indicating the high probability of a breakout and a full-scale escape from the flat. If there is no Diamond a false breakout might happen, and the quotations might return to the range.
How to detect a false breakout?
Tech analysts give different hints on false breakouts of levels or trendlines. For example, a true breakout requires closing above the resistance level. If the close prices return under the level the breakout may be false, so no growth us to be expected here.
Also, there is a rule of 3% applicable to important levels and lines. It says that the prices must rise above the level by more than 3%.
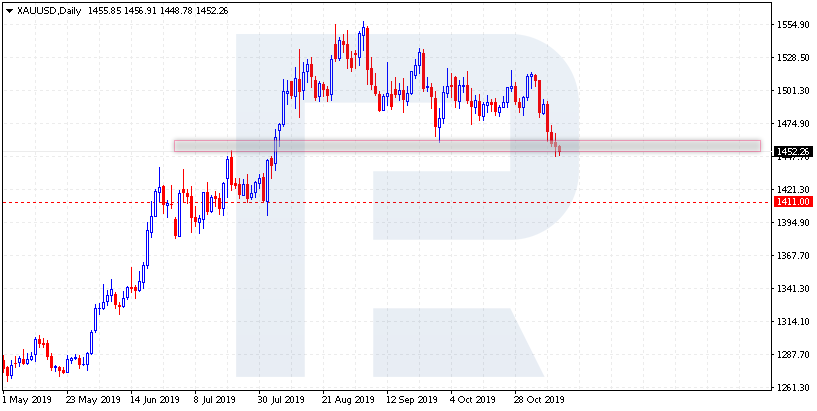
Imagine we are watching good growth of the gold prices. The important support area is at the level of 1455. If this level is broken away we might speak about a potential reversal to a downtrend.
If we apply the rule of 3% here the price must fall below 1411 for the breakout to be true. A decline to 1450 and a return indicates a false breakout, after which the growth is likely to continue.
However, this rule is just an instrument that helps distinguish between true and false breakouts. Other traders add time filters or follow-up tests of the broken levels to avoid false breakouts.
How to use false breakouts?
Larry Williams points at the fact that it is impossible to know beforehand whether the level will be broken out or not. What is more, he insists on using our own methods of analysis to use false breakouts effectively. As we may see, when the market is growing and a reversal Double Top may form, it is likely that the breakout of the resistance level will be followed by a further decline of the price. So, if it looks like the pattern will form, no growth should be expected.
Conversely, if the market is falling and its structure reminds of a Double Bottom, one should not hurry to sell after a breakout. If the prices have managed to return inside the pattern soon after the breakout, a market reversal is likely to happen, so that the pattern will be executed.
Very often traders use the MACD indicator that shows divergences on the chart well. If at the moment of a breakout of an important level there forms a convergence or a divergence on the chart, the breakout is likely to be false and the market should be entered in the opposite direction.
Closing thoughts
For an experienced chart trader who uses reversal patterns and trendlines in their work, an understanding of false breakouts may become an additional confirmation of their ideas. For example, if the market is not moving in the direction of the breakout, it means we should expect a reversal; and if the prices have broken out the ascending trendline and went back quickly, then the uptrend is still strong and further growth should be expected.
Unfortunately, such trading may be difficult for beginners due to the lack of experience. It is much easier to start with the Moving Averages and Ichimoku. And upon accumulating some experience, you can go back to searching for false breakouts.


