Getting Acquainted with CCI Indicator

6 minutes for reading
In this review, we will discuss an interesting technical indicator CCI (Commodity Channel Index). This indicator helps to find an approaching correction or reversal on the price chart.
What is CCI indicator needed for?
The CCI (Commodity Channel Index) indicator was invented in 1980 by a trader Donald Lambert. The author meant his indicator for commodity markets, however, it may successfully be used on other financial markets, such as currency, stock, etc.
The CCI indicator measures the value and the amplitude of price deviations from average values. Large CCI values mean that the price is much higher than average and small values indicate that it has fallen significantly. In essence, CCI may be attributed to the group of classic oscillators.
The indicator helps to understand in what condition the financial instrument currently is: overbought or oversold. CCI measures the distance between the price and a set Moving Average - this is just another way to say that the indicator measures the deviation of the price from its average values.
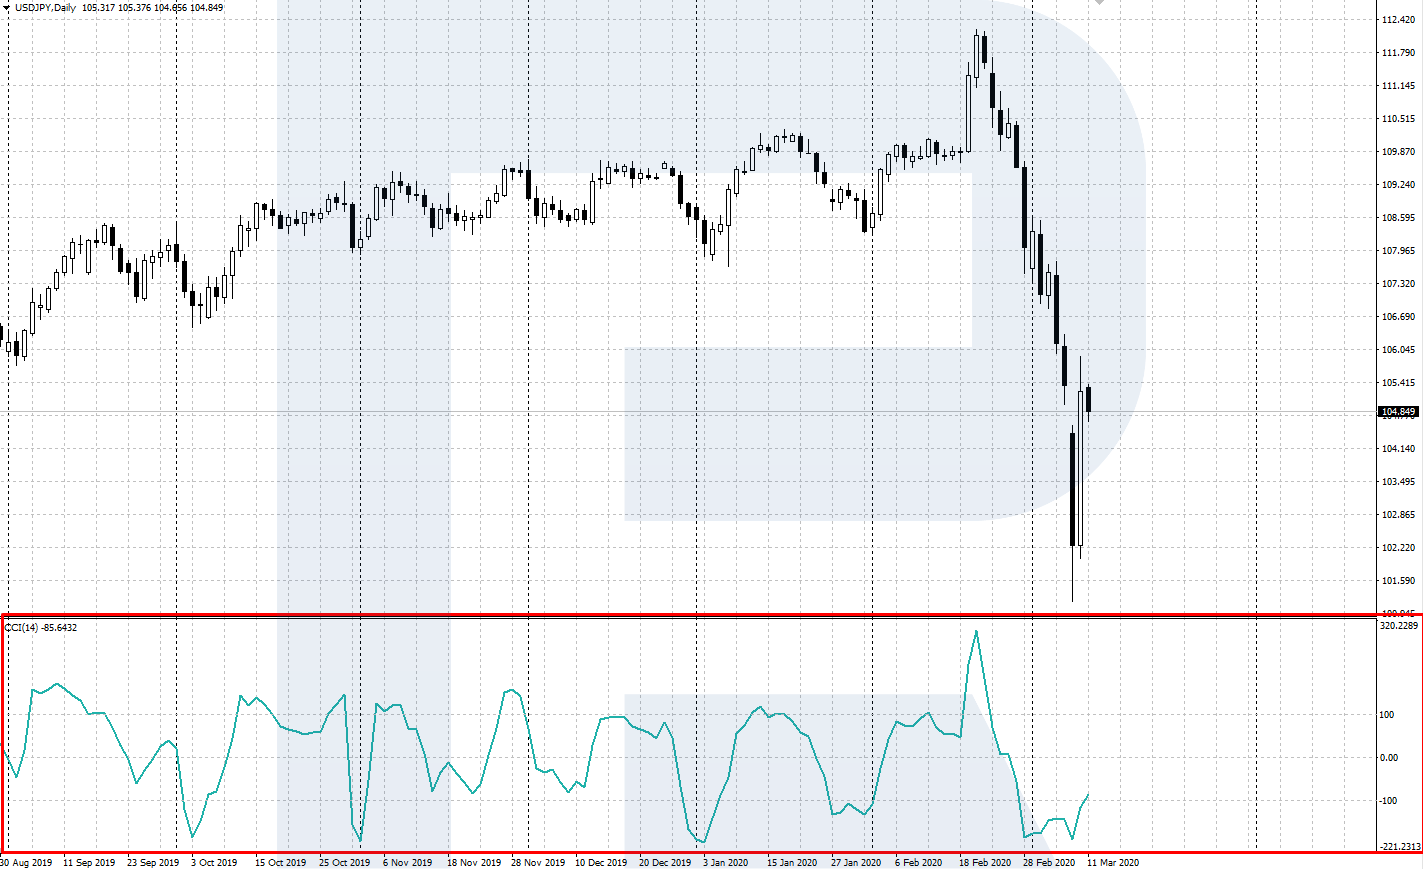
The CCI indicator is situated in a separate window under the price chart and consists of the main line (CCI) and two areas - oversold and overbought. The indicator values vary from -300% to +300%. At the levels of -100% and +100% signal lines are drawn, setting the oversold (from -100% and below) and overbought (from +100% and higher) areas; the central spine of the indicator is 0%.
CCI indicator calculation formula and settings
The CCI indicator is built in most popular trading terminals. It is represented in a separate window under the price chart. In popular platforms MetaTrader 4 and MetaTrader 5, CCI is added to the price chart via the Main Menu: Insert - Indicators - User - CCI.
For CCI calculation, you must first find the so-called "typical price". For this, you add up the high, low, and closing price of each candlestick and divide the sum by 3:
TP = (HIGH + LOW +CLOSE) / 3
Then, you calculate the n-period Simple MA of the TP:
SMA (TP, n) = SUM (TP, n) / n
Then you subtract the SMA (TP, n) from the TPs of all preceding n periods:
D = TP – SMA (TP, n)
Then you calculate the n-period SMA of absolute D values:
SMA (D, n) = SUM (D, n) / n
Then a coefficient of 0.015 is used: Donald Lambert meant it for scaling so that most of the CCI values could lie between -100% and +100%:
M = SMA (D, n) * 0,015
Finally, we divide D by M and get the CCI value:
CCI = D / M = TP – SMA (TP, n) / 0,015 * SMA (D, n)
In the formulae:
- HIGH is the high of the candlestick;
- LOW is the low of the candlestick;
- CLOSE is the closing price of the candlestick;
- SMA is the Simple Moving Average;
- SUM is the sum;
- n is the period used for calculations;
- TP is the typical price.
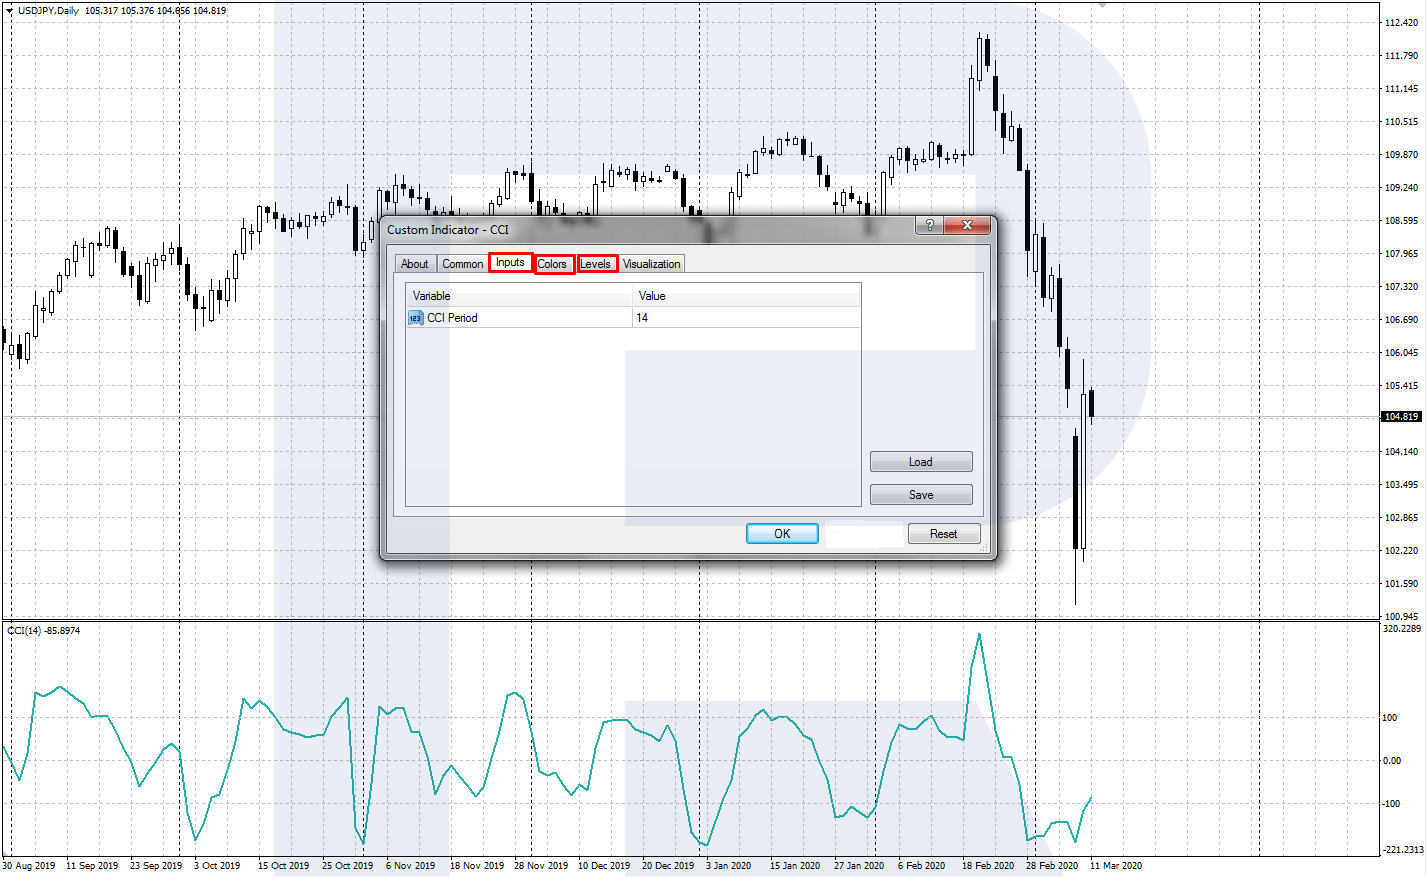
The CCI values are calculated automatically. When installing the indicator, the following parameters must be set:
- The CCI period is the calculation period for the main indicator line. The default setting recommended by the author is 14;
- Colors: the color, type, and width of the main line are customizable;
- Levels: by default, the borders of the overbought and oversold areas are set at the levels, recommended by the author: +100% and -100%, respectively.
CCI is usually used with the default period 14. However, it can always be changed after evaluating the work of the indicator historically so that it suits your trading strategy perfectly.


What trading signals does CCI indicator give?
Let us have a look at three main trading signals generated by CCI.
A reversal in the overbought and oversold areas
This trading signal forms after the CCI reaches the extreme values in the overbought and oversold areas. A signal to sell emerges when the CCI line shows the local high in the overbought area (above +100%) and reverses downwards. We wait for the confirmation of the reversal on the price chart and open a selling position with an SL behind the local high.
For the signal to buy, we wait after the CCI line enters the oversold area (below -100%). When the CCI line demonstrates the lowest value and reverses upwards, the signal emerges. We wait for the confirmation of the reversal on the price chart and open a buying position with an SL below the local low.

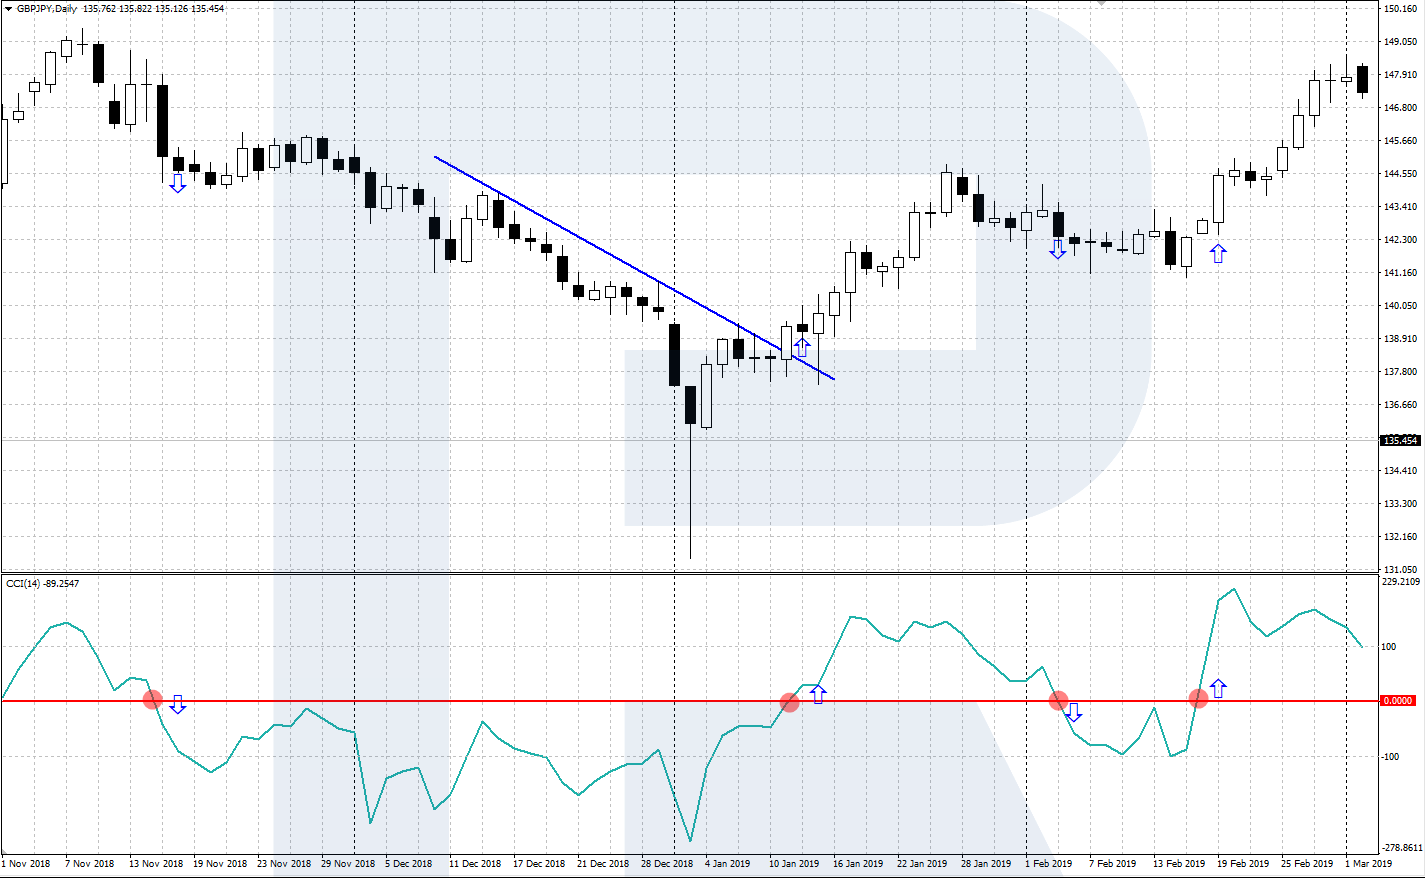
The crossing of the central 0% level
The central spine of the indicator is level 0%. When the CCI line crosses the central level from below, it signals a buy, and a crossing from above signals a sale. By itself, this trading signal is not reliable, so it is better to be used with other signals of the classic tech analysis: breakouts of the support/resistance lines or price patterns.
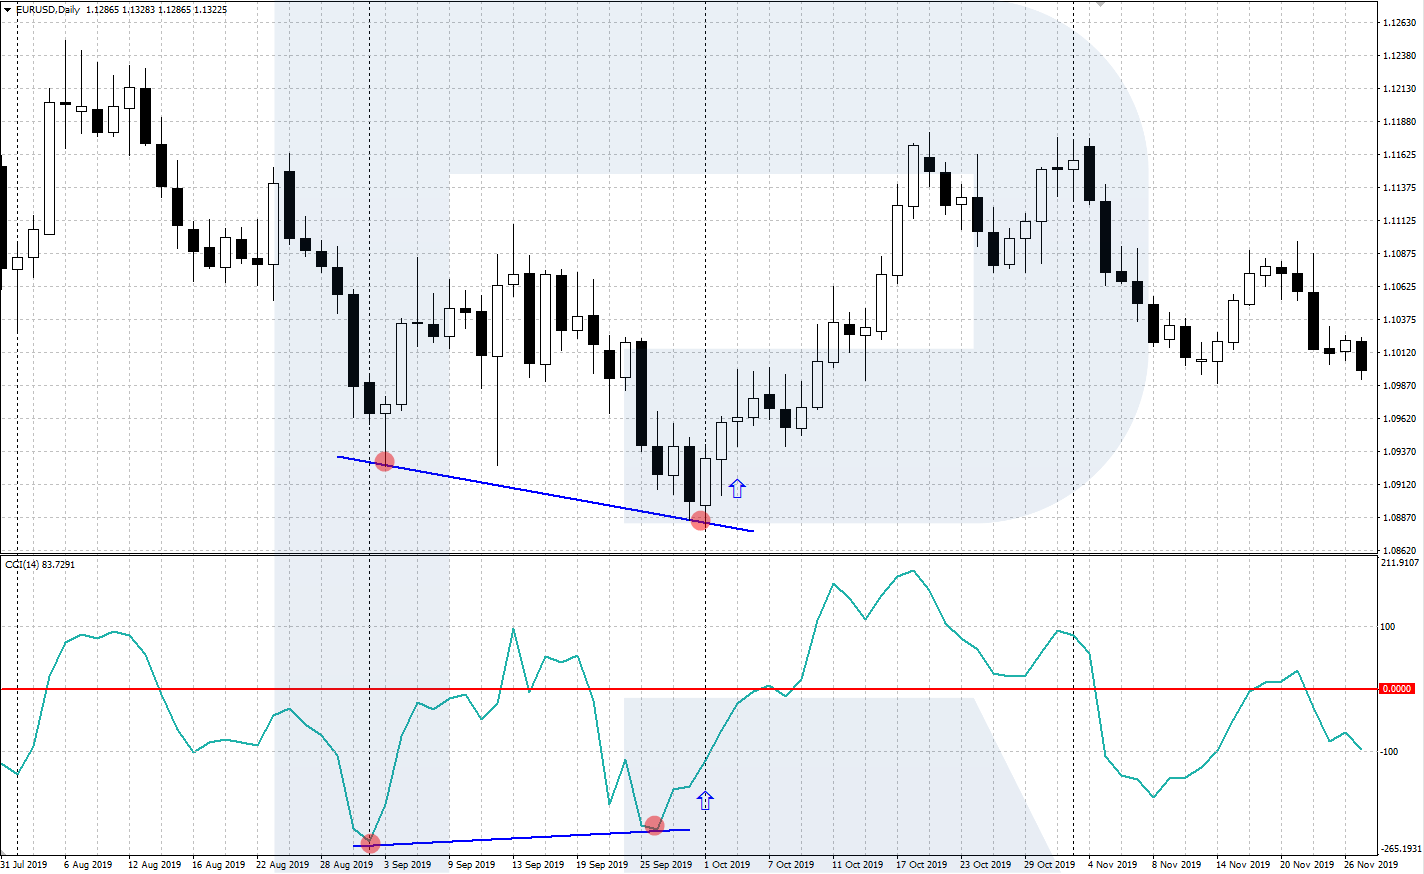
A divergence of CCI and the price chart
A bullish divergence (indicating buys) forms when the price chart shows another low while the CCI line demonstrates a shallower low than the previous one. This means that the bears have gone weak, and a reversal upwards is to follow. After the second low forms and CCI starts going up, buys are recommended.
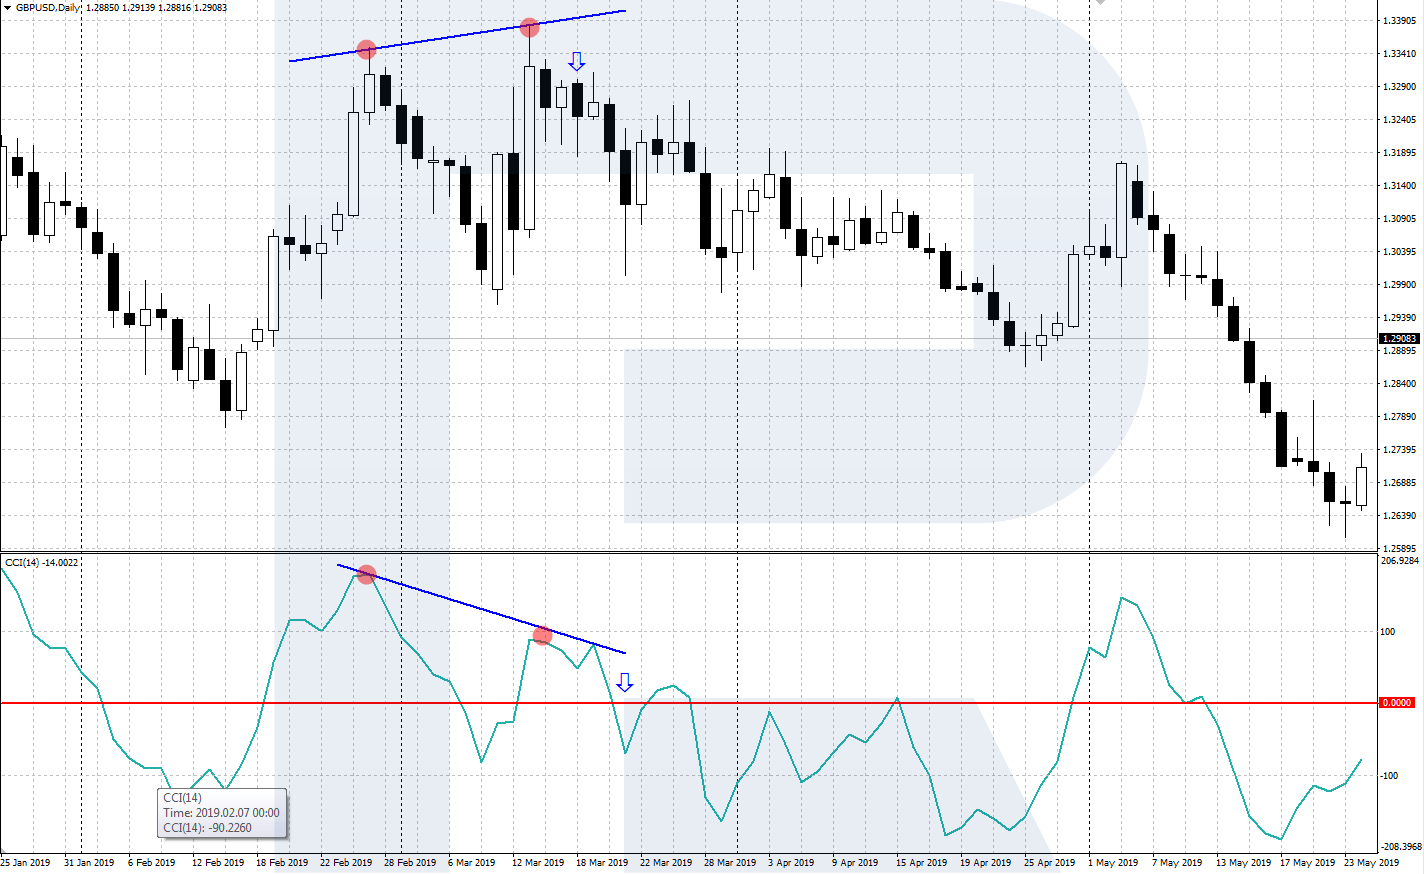
A bearish divergence (indicating sales) appears when the price chart forms a new high while the CCI line forms a lower high than the previous one. This means that the bulls are getting weaker, and a reversal downwards is possible at any moment. After the second low forms and CCI starts moving down, selling is recommended.
Closing thoughts
Regardless of its old age, the CCI indicator is still widely used by traders for market analysis. To my mind, this indicator is useful but not universal. It should be used in addition to tech analysis or with some trend indicator. Then CCI may help to find good entry points and approaching corrections or reversals.


