How to Use the Relative Vigor Index (RVI) in Trading?
6 minutes for reading
In this review, we will discuss the Relative Strength Index (RVI) indicator. It helps define the dynamics of the price change of a financial instrument on a certain period.
What does the RVI show?
The RVI was presented to the trader community in 2002 by a famous developer of technical indicators and automatic trading strategies John Ehlers. The indicator compares the closing and opening prices and helps to define who are dominating the market – the bears or bulls.
The RVI belongs to the group of oscillators. The calculation formula of the indicator is based on the idea that on the bullish market closing prices are higher than opening prices, and vice versa: on the bearish market, closing prices are lower than opening ones. Thus, the vigor of the movement is estimated by the size of the price change on a certain period.
As with other oscillators, when the RVI lines rise above 0 and reach their highs, the market is overbought. Conversely, when both lines decline below 0 and reach their local lows, the market is oversold, and a reversal or correction may follow.
The RVI is represented in a separate window under the price chart and consists of two lines: the RVI line and the signal line. The RVI line is quicker, while the signal line reacts to price changes a bit slower. Crossing of these two lines gives trading signals of the RVI. The indicator values are not normalized, the central axis is 0.
The formula and settings
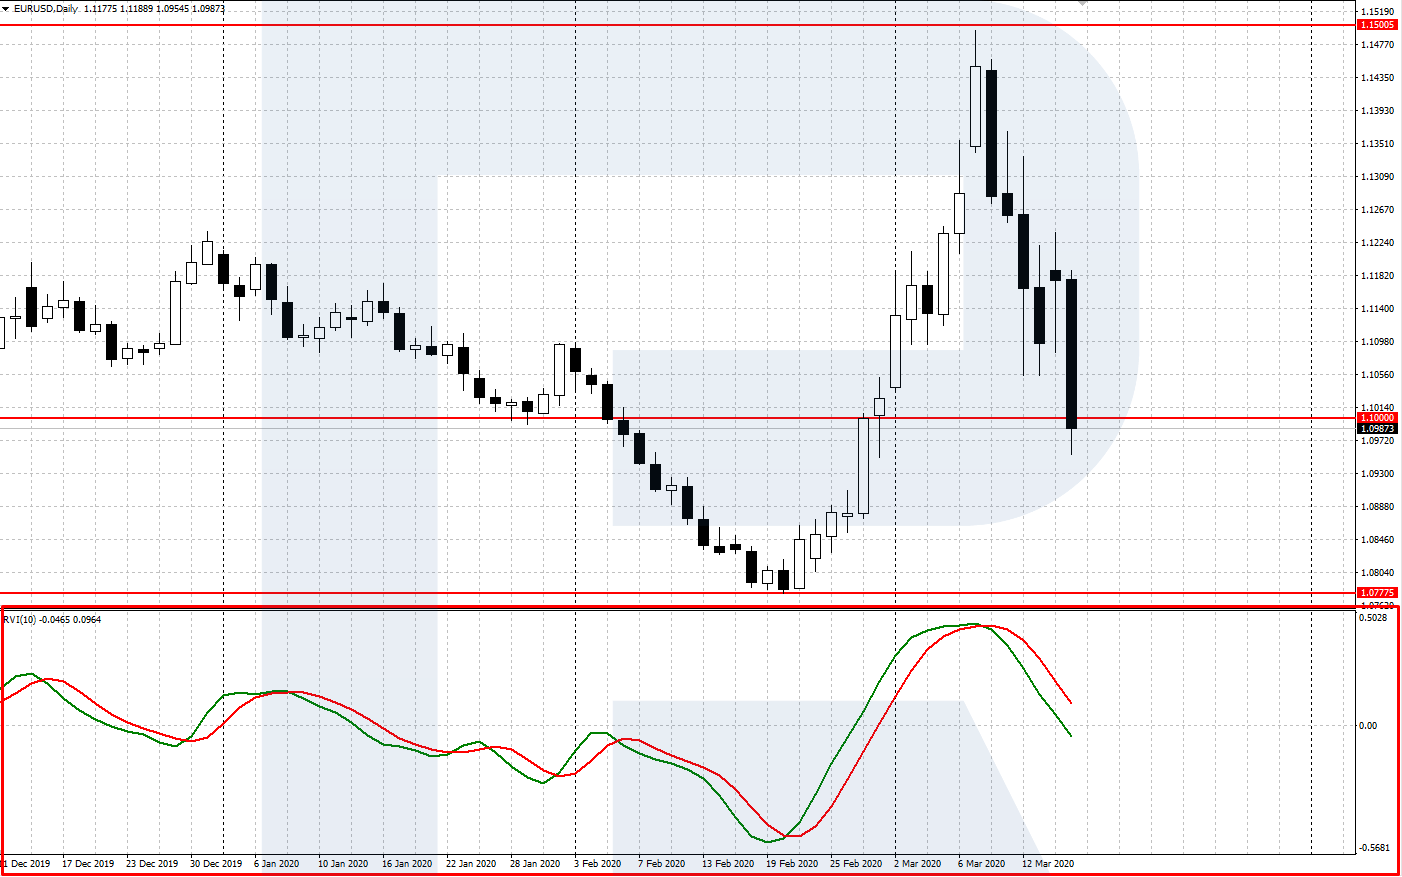
The RVI is included in most of the modern trading terminals. It is represented in a separate window under the price chart. On such popular platforms as MetaTrader 4 and MetaTrader 5, the indicator is added to the chart via the Main Menu: Insert – Indicators – Oscillators – Relative Vigor Index.
The calculation of the RVI is somewhat similar to the calculation of the Stochastic. The main formula looks like:
RVI = (CLOSE - OPEN) / (HIGH - LOW)
Where:
OPEN is the opening price of the period
HIGH is the maximal price of the period
LOW is the minimal price of the period
CLOSE is the closing price of the period
To calculate the RVI line, instead of the difference between Close and Open and High and Low, the sums of 4-period symmetrically weighed Moving Averages are used:
MovAverage = (CLOSE-OPEN) + 2 * (CLOSE-1 - OPEN-1) + 2 * (CLOSE-2 - OPEN-2) + (CLOSE-3 - OPEN-3)
Where:
CLOSE is the current closing price of the period
CLOSE-1, CLOSE-2, CLOSE-3 are closing prices 1, 2, and 3 periods ago
OPEN is the current opening price
OPEN-1, OPEN-2, OPEN-3 are opening prices 1, 2, and 3 periods ago
Then we calculate the 4-period symmetrically weighed Moving Average from the denominator:
RangeAverage = (HIGH-LOW) + 2 x (HIGH-1 - LOW-1) + 2 x (HIGH-2 - LOW-2) + (HIGH-3 - LOW-3)
Where:
HIGH is the maximal price of the last candlestick
HIGH, HIGH-2, HIGH-3 are maximal prices 1, 2, and 3 periods ago
LOW is the minimal price of the last candlestick
LOW-1, LOW-2, LOW-3 are minimal prices 1, 2, and 3 periods ago
In the end, we find the ratio of the sum of the MAs for the last 4 periods:
RVIaverage = SUM (MovAverage(1-4)) / SUM (RangeAverage(1-4))
The second signal line of the RVI is calculated as 4-period symmetrically weighed Moving Average from the RVI line:
RVIsignal = (RVIaverage + 2 * RVIaverage-1 + 2 * RVIaverage-2 + RVIaverage-3)/6
Both lines of the indicator are calculated automatically. When installing the indicator, the following parameters must be set up:
- The RVI period is the period for which the main line is calculated. The default setting recommended by the author is 10.
- Style of the lines: the color, width, and type of the lines are customizable.
The RVI is normally used with the period of 10 set by default. However, you can always evaluate the work of the indicator with another setting historically and choose optimal settings for your strategy.
Trading signals of the RVI
Let us discuss three main trading signals given by the RVI.
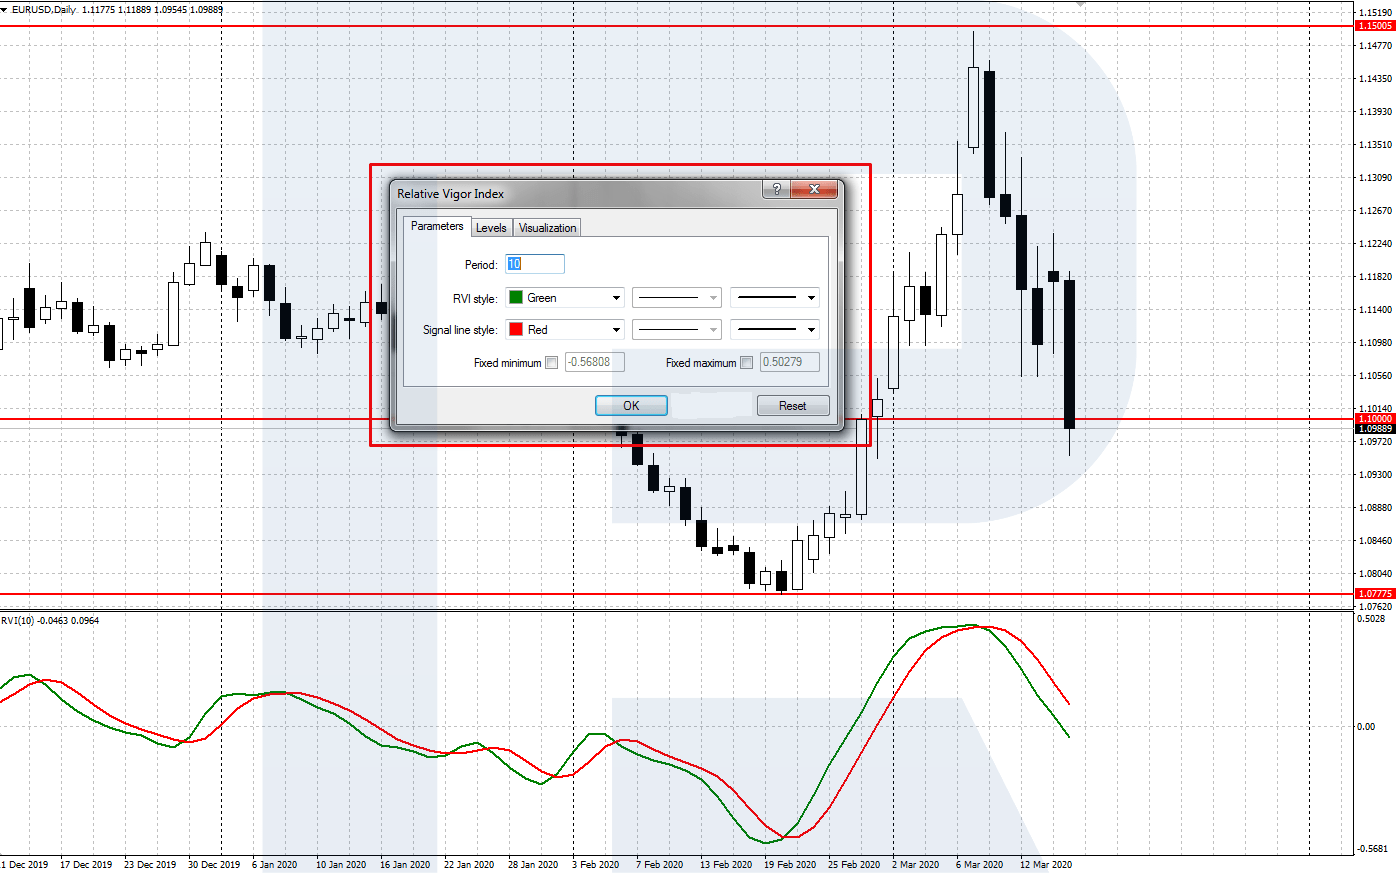
Crossing of the indicator lines
This signal forms after the RVI forms local highs and lows in the overbought (above 0) and oversold (below 0) areas.
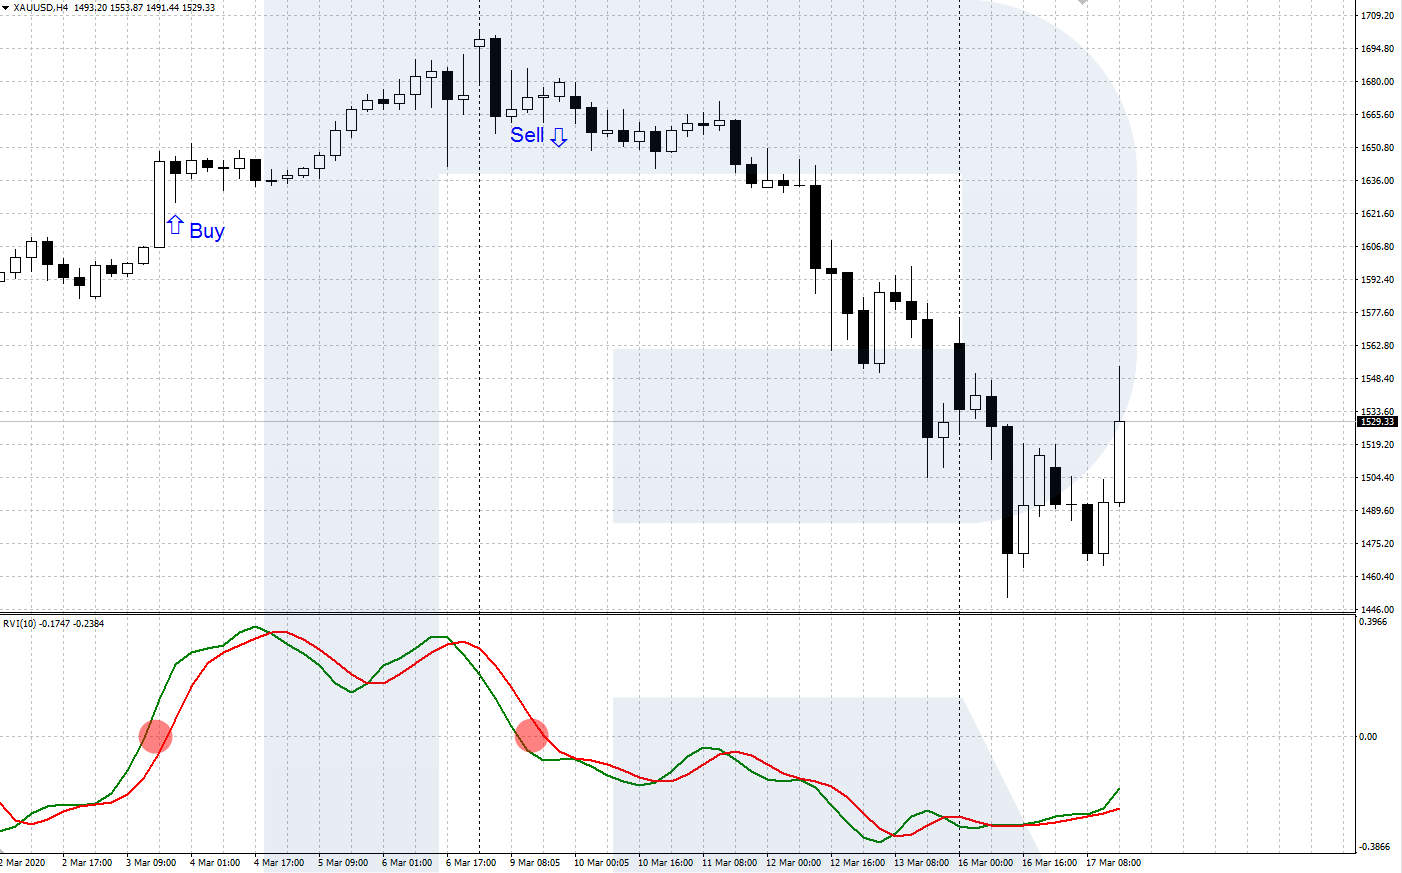
The signal to sell emerges when the quick (green) RVI line crosses the slow (red) signal line from above in the overbought area. After the reversal is confirmed on the price chart, open a selling position with the SL behind the local high.
The signal to buy emerges when the quick (green) RVI line crosses the slow (red) signal line from below in the oversold area, after a local low appears. When the price chart confirms the reversal, open a buying position with the SL behind the last low.
Crossing the central level
The central axis of the indicator is 0. Crossing it by both lines from below signals to buy, while crossing it from above signals to sell. This signal is not very reliable, so it is recommended to use it alongside additional instruments: other indicators, tech analysis signals, or Price Action patterns.
The divergence of the RVI and price chart
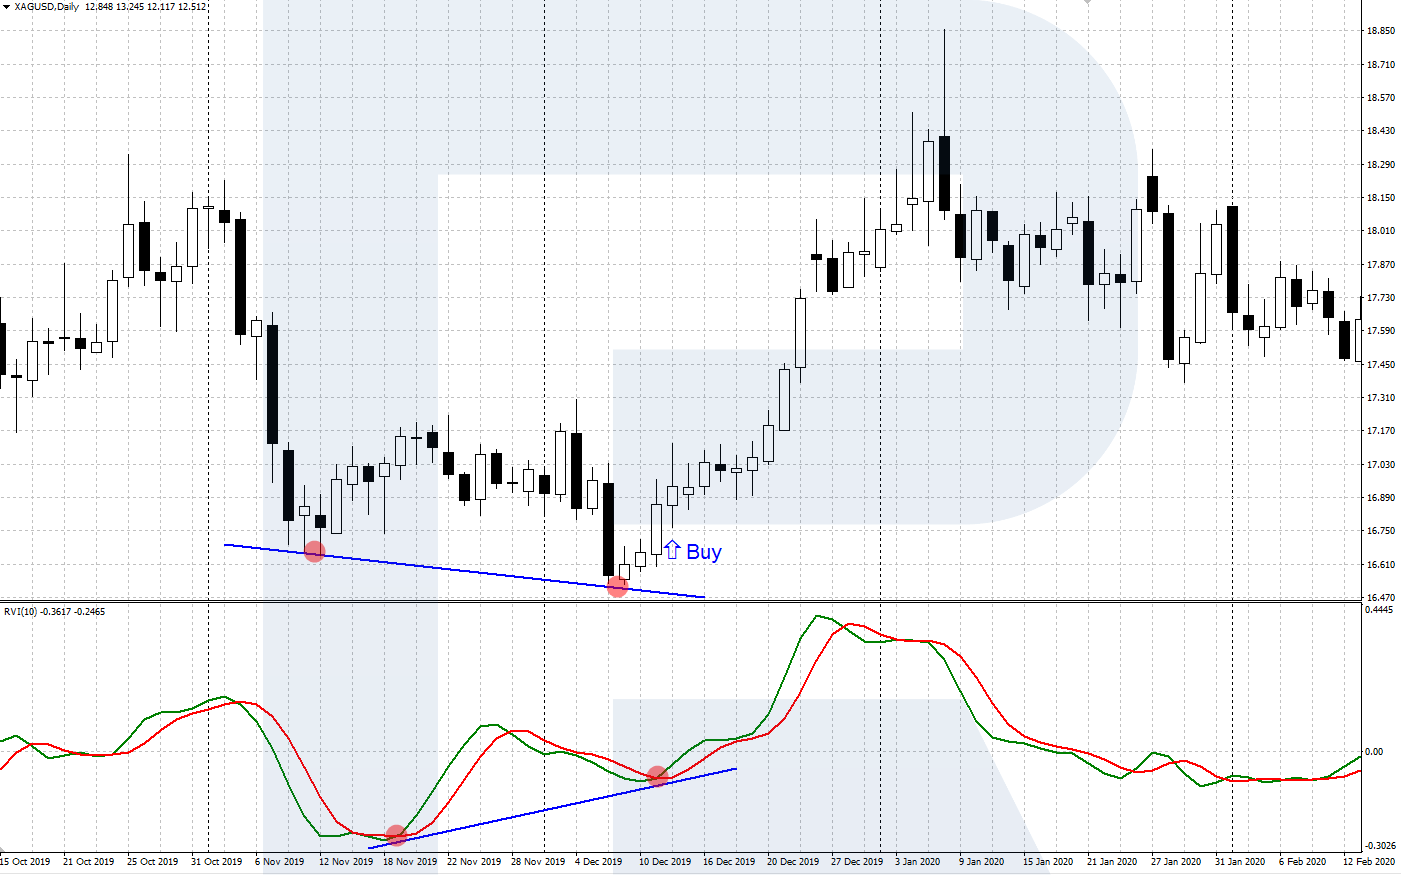
A bullish divergence (signaling to buy) appears when the price chart forms another low under the previous one, while the RVI low, formed by the crossing of the two indicator lines, is higher than the previous one. This means the sellers are weak, so a reversal upwards may follow. After the price chart reverses upwards, you may open a buying position with the SL slightly lower than the last low.
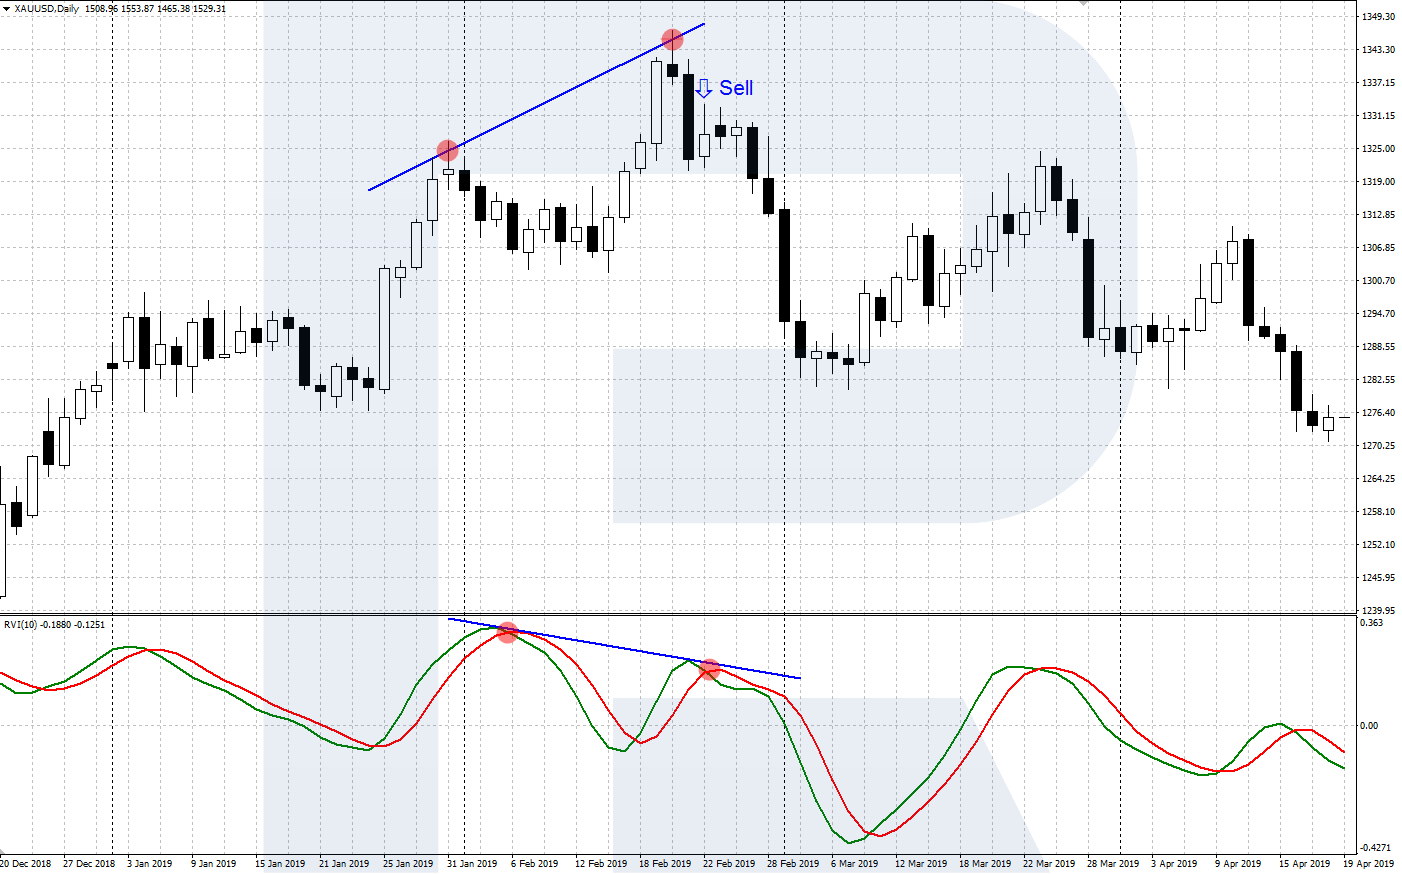
A bearish divergence (signaling to sell) emerges when the price chart shows another high above the previous one, while the RVI high, formed by the crossing of the two indicator lines, is lower than the previous one. This means the buyers are losing their strength, so a reversal downwards may follow. After the price chart starts going down, you may open a selling position with the SL behind the local high.
Summary
The Relative Vigor Indicator helps assess the probability of the continuation of the current trend. The farther the indicator lines move away from 0, the higher is the possibility of a correction or even a reversal. However, the RVI is not a universal trading system. To make its signals more reliable, I recommend using it alongside other indicators, tech analysis, or Price Action patterns.