Trading Strategy with Ichimoku Indicator

6 minutes for reading
The Ichimoku indicator has long been acknowledged as an efficient market instrument for defining the prevailing trend. It frees the trader from the need to detect such important things on the chart as the support and resistance levels as well as the areas that do not suit for trading. The trading strategy we are going to talk about is based on the Ichimoku indicator.
Practice shows that the number of false signals given by Ichimoku and the timeframe used correlate: the longer the timeframe, the fewer false signals emerge. The best timeframes are H4, D1, W1, MN. The strategy suits for Forex, futures, and stock markets – the last two markets give more adequate signals than Forex.
If you do not get acquainted with Ichimoku Kinko Hyo indicator, please see this post.
A signal to buy by the strategy
For the signal to appear, we need the indicator lines to be arranged the following way (top-down):
- Chikou Span;
- Tenkan Sen;
- Kijun Sen;
- Senkou Span A;
- Senkou Span B.
This way, Ichimoku will show a clear bullish trend. The price chart must be above the Tenkan Sen line.
For a good signal to appear, the market must make clearly detected movements upwards and unequivocal corrections without abrupt price drops. The signal consists of a bounce of the price chart off Tenkan Sen or, in a pinch, off Kijun Sen. A bounce off Senkou Span A might appear efficient but the risk of a false signal is high because the deeper the market corrects the less trustworthy signals the indicator gives.
An example of a good signal to buy
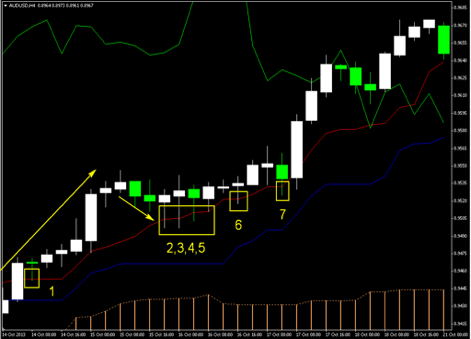
The first signal appeared in a very good place and soon became positive. After a clear impulse movement, a decent correction emerged, during which the second, third, fourth, and fifth signals appeared; four hours later, the sixth signal appeared, and eight hours later – the seventh one, after which the market demonstrated another impulse of growth. Such a series of great opportunities to enter the market by the trend is rare – and none of such entries would lead to a loss provided that the position is followed correctly.
A signal to sell by the strategy
The market is favorable for short positions when the Ichimoku lines are arranged as follows (top-down):
- Senkou Span B;
- Senkou Span A;
- Kijun Sen;
- Tenkan Sen;
- Chikou Span.
Thus the indicator will signal a downtrend. The price chart must be below Tenkan Sen. It must perform clear downwards movements, and the correction during which the trading signal appeared must be smooth, without upward surges. The signal itself is a bounce off Tenkan Sen or (a worse option) Kijun Sen.
An example of a good signal to sell
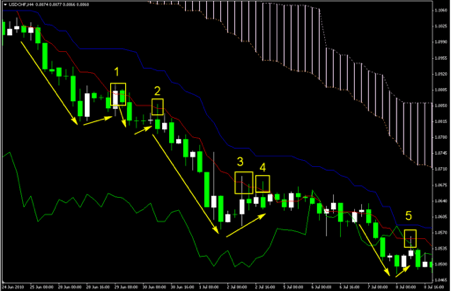
The first signal could appear after a confident price drop; however, the bounce itself might not seem attractive to everyone. The second signal is very good because it happened after a very sloping pullback, and the Pin Bar is not breaking through Tenkan Sen too much, which confirms its strength as a resistance line. Three remaining signals follow the same logic.


Trading levels in the strategy
Always place the Stop Loss behind the point of the signal candlestick or the farthest extreme of the group of the candlesticks that create the bouncing pattern. Enter the market right after the trading signal forms. However, those who prefer extremely short potential SLs may encounter a lot of opportunities for this.
Quite often, the market offers a pullback after a bounce before going in the signal direction. Hence, placing a limit order at a mid-return to the SL level would be logical in the cases of the second, third, fourth, and seventh signals to buy and the first through fourth signals to sell. In other words, in 58% of the cases, we could risk two times less and make two times bigger profit, especially if your risks consists of a certain percentage of the deposit.
Money management for the strategy
As for the money management method for the strategy, use any that seems efficient to you. You may either risk a certain share of the deposit or enter with a certain lot; as for me, I have always preferred the first option because you never know which trade will bring you a profit – thus, each market entry must enjoy the same opportunities. If you also prefer percent risk, try to hold it within 2% because larger risks may depress you, decreasing the efficacy of your trading decisions.
Due to the market being so fond of returns, transferring the position to the breakeven may appear problematic. Sometimes you have to wait for one or even two candlesticks for the market to go in the signal direction so that you can bring your position to parity without risking to close it with a zero result. Hence, you have two options: either be patient and transfer the position to the breakeven only when the price goes in the desired direction confidently or split your position into two parts and place a Take Profit equal to the Stop Loss in one of them. The second option works well alongside a limit order, and I personally tested it many times – all in all, it is good though decreases your potential profit by about 30%. Simultaneously, it allows you to transfer the position to the breakeven automatically and does not require placing the SL to the entry level, which will rescue your potential profit for turning into zero many times.
As for the TP, I am sure that you must use it, especially in the futures or Forex markets. The placement of the TP may be defined by the following: Pivot Points, support and resistance levels, round figure values, weekly, monthly, yearly, all-time highs and lows. Alternatively, you may just make it 3-5 larger (in ticks) than your risk size. If you trade stocks, you may just follow your position, transferring the SL behind the newly emerging extremes, or a bit lower (for buys) or higher (for sales) the Tenkan Sen or even Kijun Sen lines. In this issue, you should rely on the instruments that show themselves better in your trading.
Closing thoughts
This trading strategy based on Ichimoku will suit those who do not like drawing on charts as this part of the trader’s routine is done by the indicator (in its own way). If you trade on H4, you will need to look at the terminal just 3-4 times a day. For those who are extremely busy, try trading on D1.