How to Trade Bryce Gilmore’s Graphic Patterns

8 minutes for reading
Nowadays, there are plenty of various graphic patterns for trading. Some are classical, some are modernized. Every trader tries to supplement graphic patterns with their own secret features to make them more efficient.
For example, previously, investors used to trade the Head and Shoulders pattern at the breakaway of the “neck” only; however, these days, many traders do not wait for the pattern to be complete but trade while it is still forming. Thus, they can enter the market with a much shorter Stop Loss.
Bryce Gilmore is one of the traders who added their rules to and found interesting mechanisms in the work of classic trading patterns. Many patterns from his books coincide with the views of other graphic traders.
On the one hand, there is nothing complicated to his novelties; on the other hand, one has to spend a lot of time to come to such conclusions on their own. However, with all the books and articles, a beginner only needs to read and reread them thoroughly and apply the knowledge to the current market.
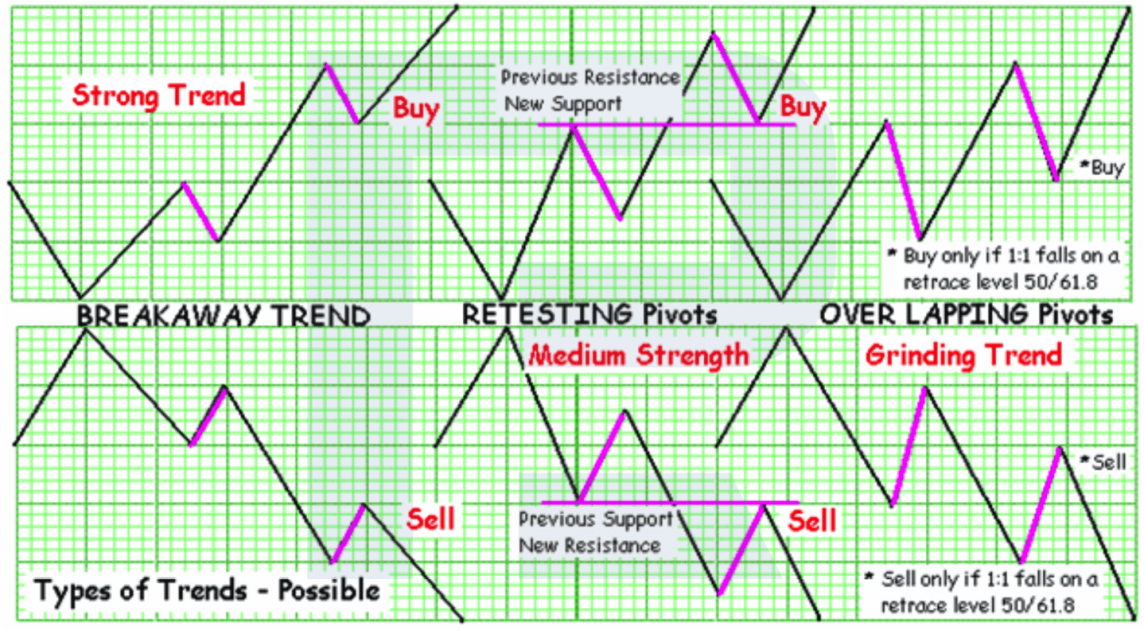
All Bryce Gilmore’s patterns can be conditionally divided into two groups (like all other graphic patterns): those of trend continuation and those of trend reversal. In this article, we will discuss the main price structures only. The author has plenty of patterns in store but you do not need to know all of them to trade successfully: you can choose a couple and learn how to use them properly in compliance with your capital management rules.


Trend reversal patterns
The Head and Shoulders pattern
Bryce Gilmore insists on calling this pattern like this, and we cannot deny that it is very similar to the classical pattern.
However, here, there is a large difference between the classical and original approaches. In normal tech analysis, few traders speak about selling from exactly the right “shoulder” of the pattern. As for Gilmore, he notes that if the “shoulders” are more or less equal, we can open a selling or buying position depending on where the pattern is aimed.
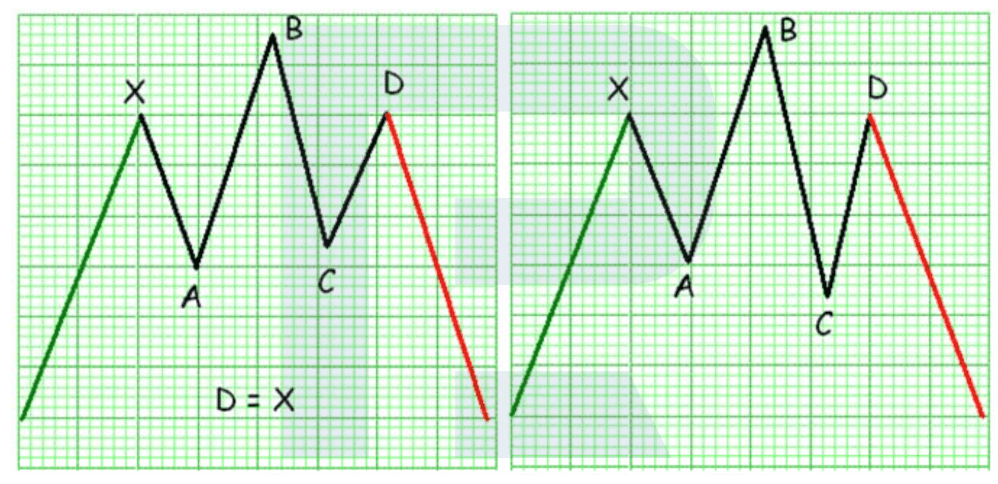
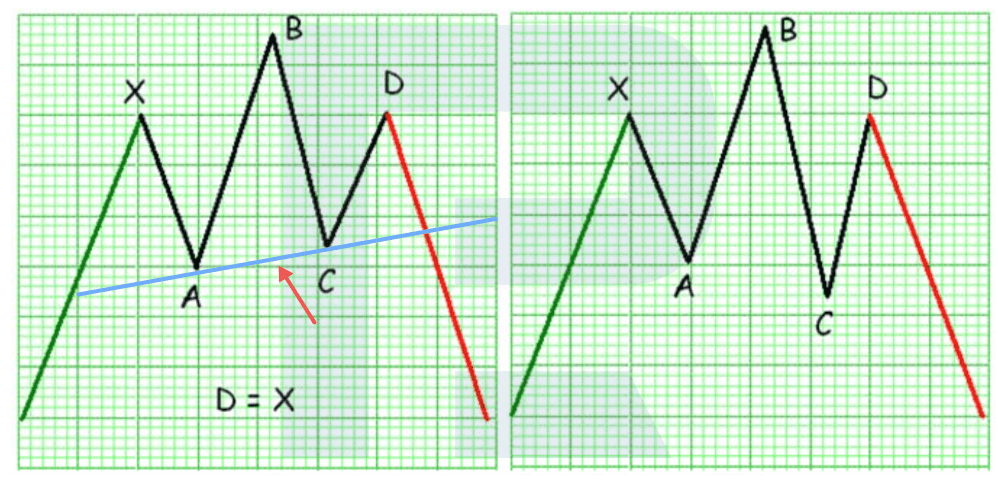
Moreover, he neglects the slope of the “neck” completely: even if the line is heading down, we can still open a selling position provided that the “shoulders” are equal.
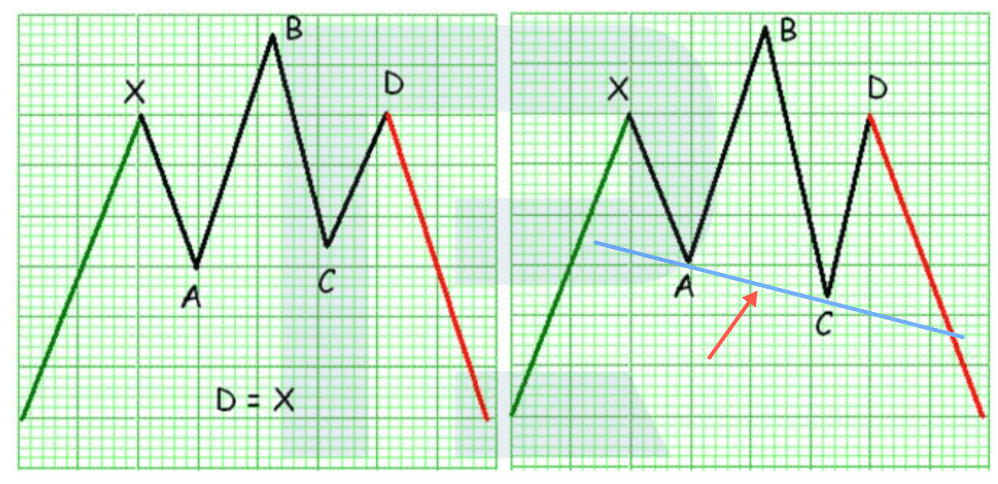
I will remind you that in classical tech analysis, the “neck” must be aimed in the direction of the previous trend. If otherwise, the pattern is not a Head and Shoulders but a Wolfe’s Wave. Some time ago, my colleagues and I singled out this feature and were quite surprised to find a similar idea in the book of another author.
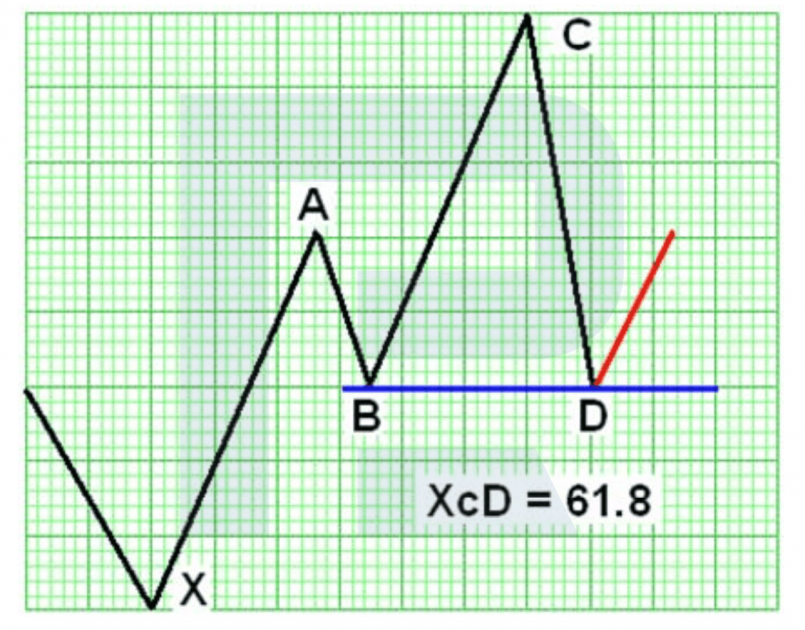
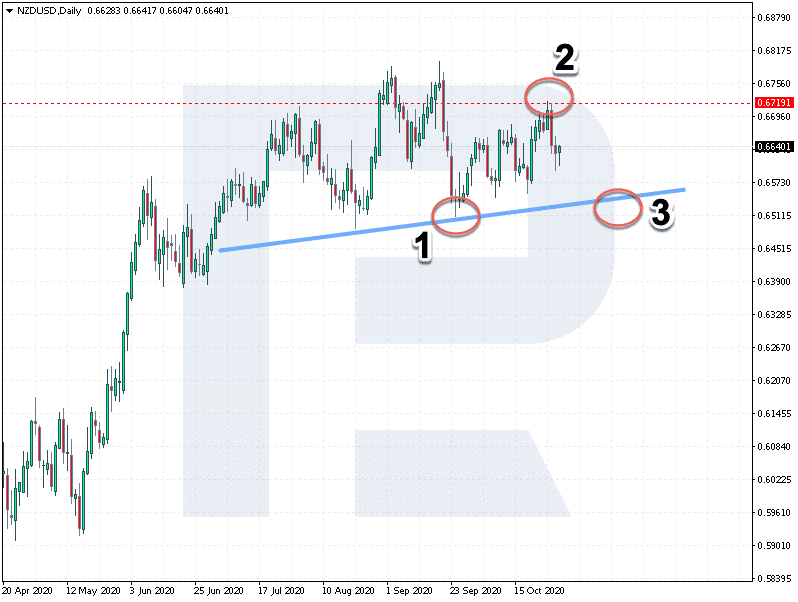
Also, few traders dare to buy when the price pushes off the “neck” and goes toward the right “shoulder” - however, Bryce Gilmore offers this trading option. The only thing he adds is the Fibo levels: a correction to 61.8% must end near the “neck” of the reversal pattern.
Indeed, why should we ignore this movement, especially that the Stop Loss will be minimal? We can take an upward movement sized like the left “shoulder” and sell at the moment when the “right” shoulder reaches the same size.
As we see, by just watching the price when a pattern is forming, we can see some new and interesting trading options. I keep saying that you bring your trading to a new level, supplementing the strategies you use.
Here, with the Head and Shoulders, we get not only one entry point but three: one at the moment when the right “shoulder” is forming, the second one – at the right “shoulder”, and the last one – at the breakaway of the “neck”, which is a classical approach.
👉 The "Head and Shoulders" chart pattern is one of the main trading patterns in Forex. Make sure to check out How to trade Head and Shoulders pattern.


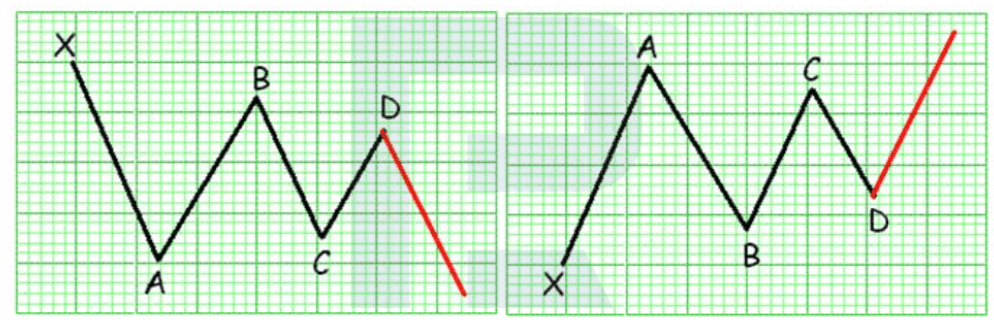
Double Bottom and Double Top
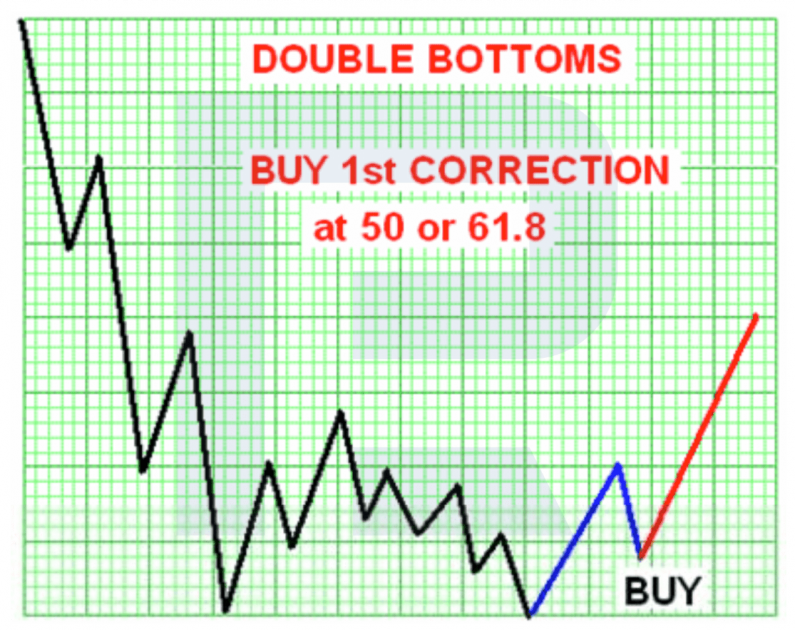
In the classical variant, traders buy at the breakaway of the resistance level only (in the case of a Double Bottom) or the support level (in the case of a Double Top).
However, here as well, traders supplement the patterns by their observations and suggested market entry options. There are also unique names for this pattern, such as a Dragon. There is also the same classical pattern supplemented by Fibo levels, where authors recommend to buy near the base or at the breakaway of the descending trendline.
Bryce Gilmore gives us an idea that we should not hurry to buy at the test of the support line because the market may go deeper down and only then reverse. The author suggests waiting for a bounce off the support line and enter the market only when a correction, testing 61.8% Fibo, begins. Thus the trader does not risk entering too early but opens a position at an ascending impulse, thus decreasing the risk to enter against the trend.
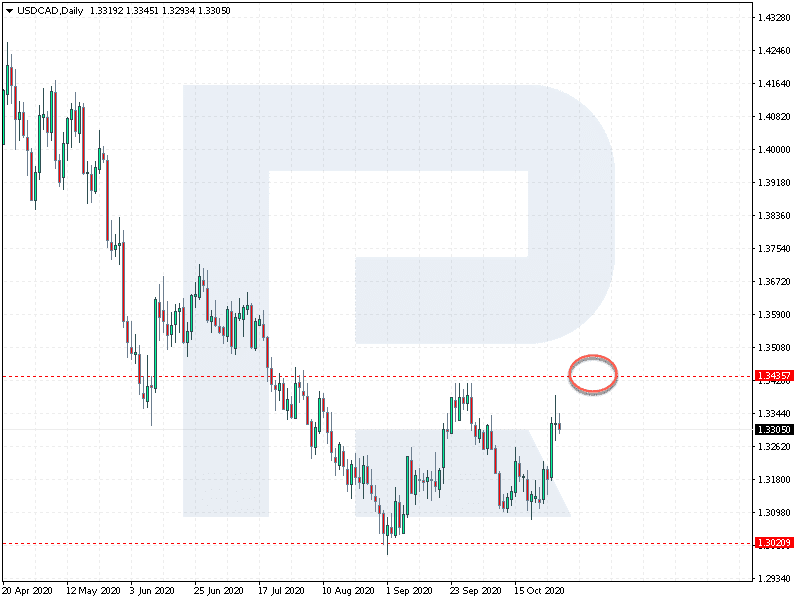
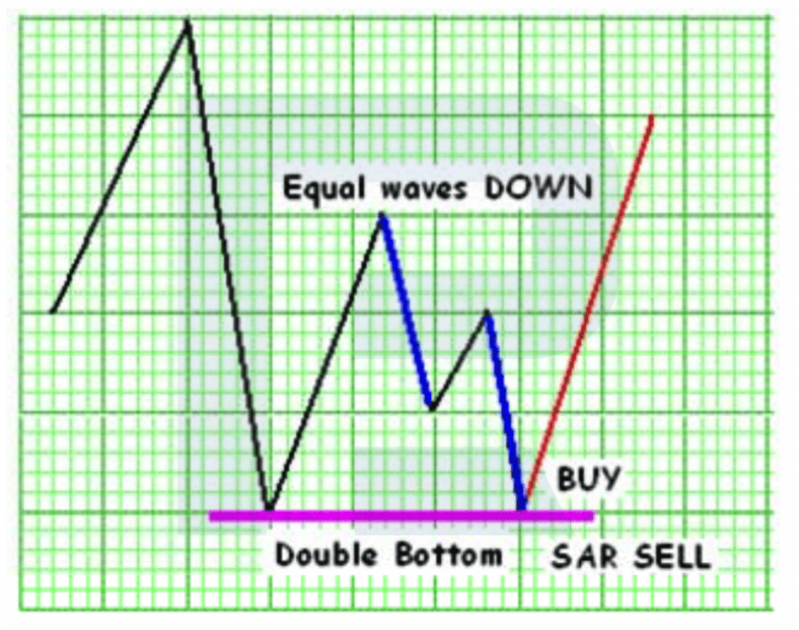
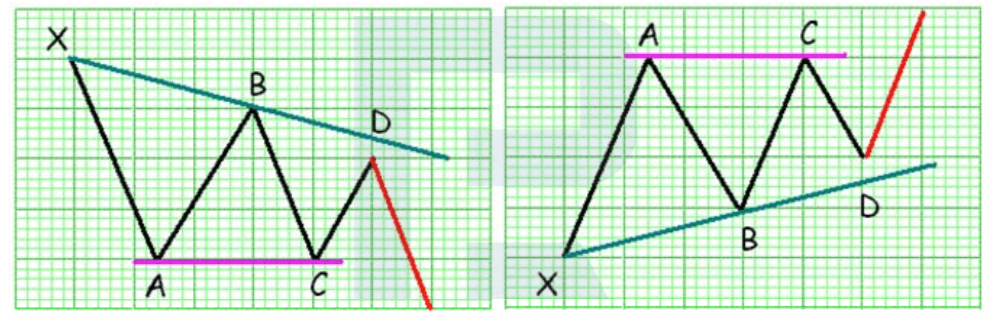
Another entry option is a more complicated price pattern. If we are talking about a Double Top, a test of the resistance level must be comprised of two equal ascending movements. If these movements coincide, you can try selling. Such a price pattern itself hints at a probable decline regardless of the presence or absence of a reversal pattern on the chart. Such a pattern only strengthens the signal and allows us to calculate the target level.
👉 See detailed information on trading the Double Top and Double Bottom patterns in this post.


Trend continuation patterns
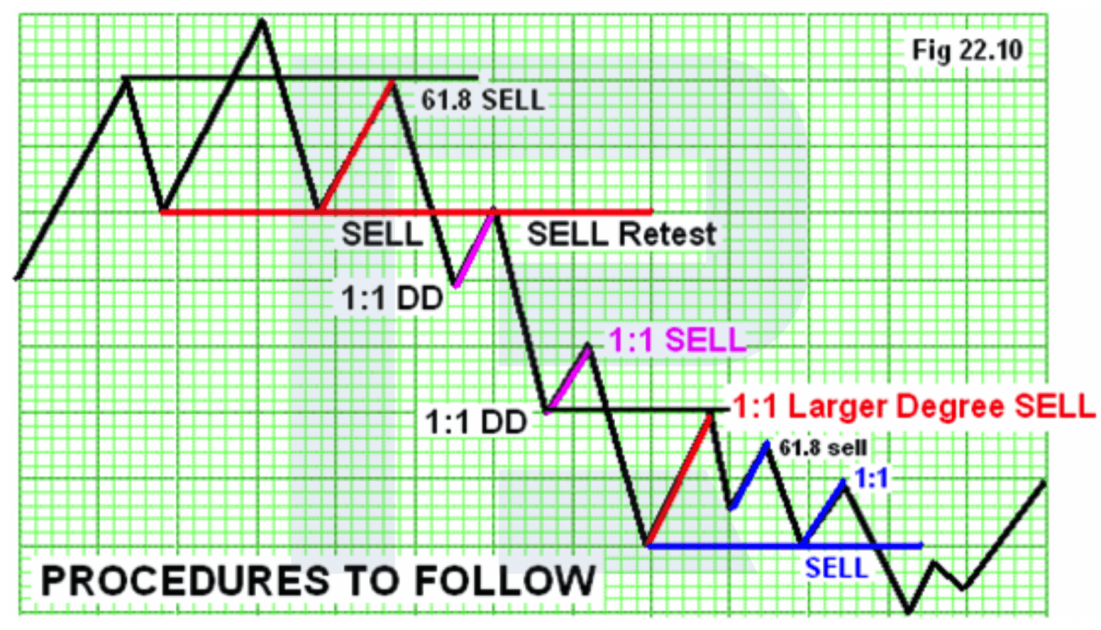
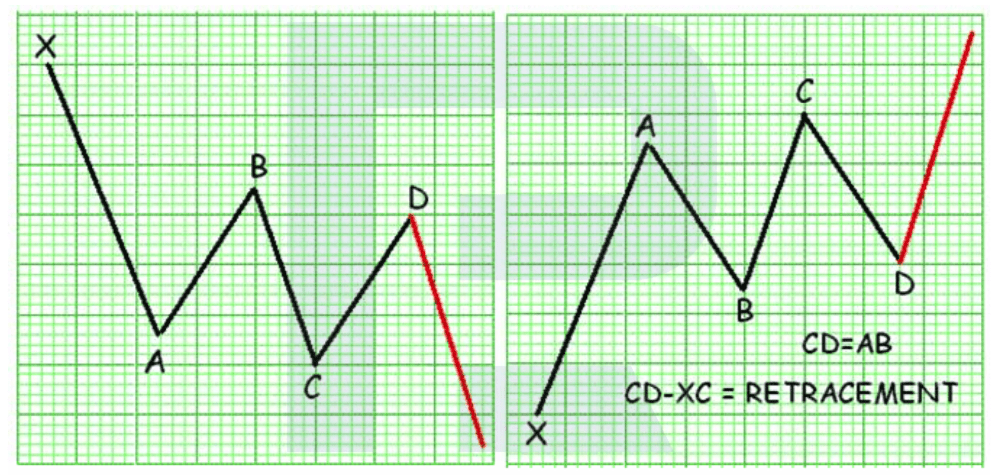
The 1:1 pattern
Note that Bryce Gilmore bases many of his patterns on certain symmetry: he looks for identical movements, both time- and price-wise.
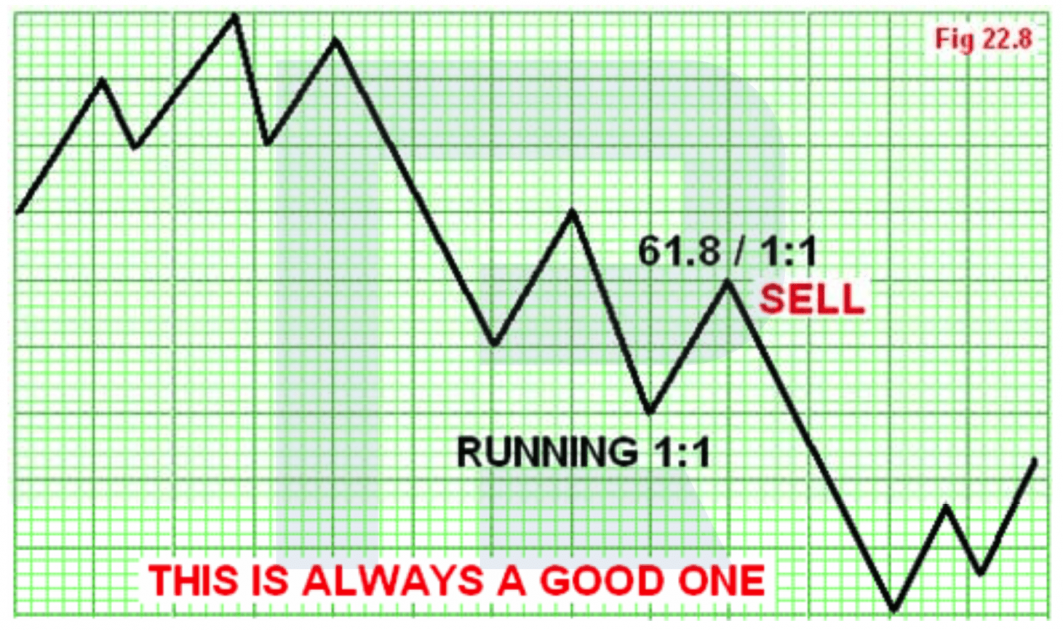
The current pattern is such a symmetrical structure. Normally, we take two equal corrections, and if they coincide in terms of time and price, the trader may expect a strong movement by the general trend. Conversely, if the channel is broken away, or the second correction does not coincide with the first one in price, or looks too extended, try to abstain from opening such positions. O place a goal, take the length of the previous movement, and mark the same distance from the end of the second correction.
Gilmore uses the same structure for the Head and Shoulders pattern: he interprets the 1:1 pattern as a part of the general structure of the reversal pattern. As in the example, the first correction is the “shoulder” of the pattern; then there are two smaller corrections that are shorter in terms of time but symmetrical to each other. Here, we can see not only a small model but the realization of the whole pattern.
The Triangle pattern
Working by the Symmetrical Triangle pattern, the author suggests opening positions from the border of the pattern, not waiting for the price to escape the pattern. Here, the trader opens a position at the moment of the fifth test of the border with a Stop Loss just above or below the border depending on the presence of the previous movement.
If the Triangle is Ascending or Descending, the price (according to the author) may reach the border of the pattern because it is a very strong signal along with the current trend. That is why a trader needs to open a position near the border of the pattern with a Stop Loss outside.
As a result, the trader enters the market with minimal risk and open a second position at the breakaway of the opposite border of the Triangle. Classical tech analysis also contains such an approach but it is rarely used and recommended by its followers.
👉 Want to know more? Check out how to use Triangle patterns in tech analysis.
The Rectangle pattern
Such a pattern is very similar to 1:1; however, while 1:1 is, according to Gilmore, is just a big pattern, the Rectangle normally demonstrates a minor correction, after which the price goes on in the same direction.
In Forex, this pattern is normally somewhat inclined and called Rectangle In Motion. Looking at some examples, we can note that normally, this pattern forms in the middle of the current trend only.
Closing thoughts
Tech analysis offers many patterns; every author tries to find some unique features of them and different entry options with minimal risks.
I am sure that every trader notes curious moments of trading but we need lots of time to form some clear rules by them. Conversely, using the experienced accumulated by such authors as Bryce Gilmore, you can bring your trading to a new level, adding new patterns to your arsenal and new entry points to the existing patterns of your strategy.


