Best Long-Term Strategies: Mastering Jarroo

6 minutes for reading
Indicator-less strategies are growing more popular every day because every indicator is based on prices and, hence, lags. Most often, if you add several indicators to the chart, you need to make sure that their signals do not contradict.
A strategy called Jarroo offers simple trading by levels. This rids you of tracking lots of indicators daily. This article is devoted to the working principles of this unusual strategy.
Description of Jarroo
The trading method is based on Price Action. What the trader has to do is to look for clear levels on day charts of currency levels by certain rules.
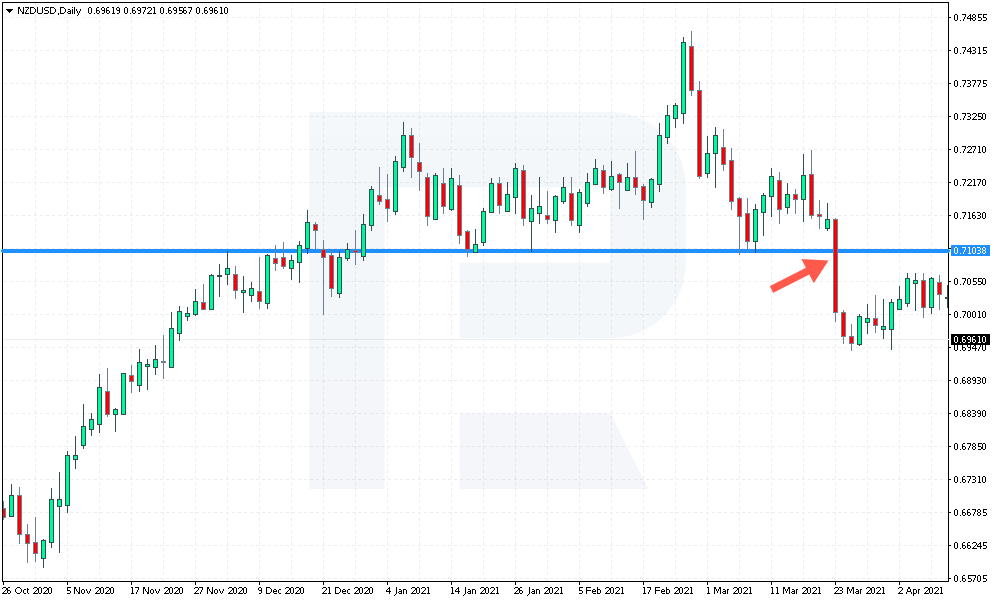
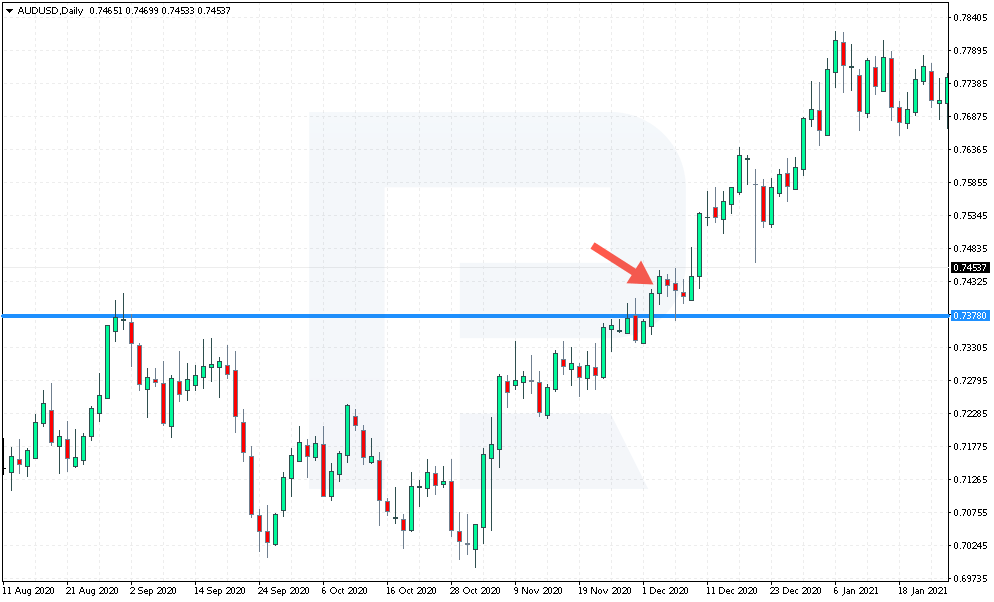
Any support or resistance level will in the end be broken away by bulls or bears. There is an idea that when a strong level gets broken, the price keeps moving towards the break away. By Jarroo, we are interested in the price retesting this level.
Working on a large timeframe, you will not miss signals; moreover, you can use pending orders and check the charts no more often than once a day. Also, you can use any currency pair available. This is another advantage of Jarroo because every trader can follow their preferences.
Terms of the strategy
Before you get started, make sure you understand the terms used in Jarroo.
- Swing is a local accumulation of highs and lows in price movements. On the chart, such levels can look like some reversals seen just by eye. Highs and lows of the price on the chart can also be swings.
- HRC (Highest Close of Resistance) is a resistance level that is drawn through bodies rather than shadows of candlesticks. Prices cannot go higher than this level.
- LCS (Lowest Close of Support) is a support deeper of which prices never fall. It is also drawn through candlestick bodies, shadows excluded.
- PBT&CA (Price Breaks Through & Closes Above) is a situation when the price breaks through the resistance level, and bulls manage to secure above this level.
- PBT&CB (Price Breaks Through & Closes Below) is a situation when the price breaks through the support level, and bears manage to secure under this level.
- DCC (Daily Close Confirmation) is a signal confirming a breakaway of a level. As a rule, it forms inside the candlestick in which the broken level is retested.
The names might look a bit weird and could be simplified perhaps; however, you will remember them as soon as you master the strategy.
How levels are drawn by Jarroo?
Traders draw levels differently: some take care of candlestick bodies only, some draw through shadows only. Working by Jarroo, there is a peculiar way of searching for levels:
As noted above, levels in Jarroo are drawn through candlestick bodies only; whatever the shadows, they are not accounted for. Swings are to be found by the trader. Check the position of candlesticks: it is preferable that there were several candlesticks present at the secondary test of the level. This is a subjective factor, but with experience, you will find the levels easier. If you have any doubts about the levels, they are not swings anyway because those are to be visible.
How to open trades by Jarroo?
To open positions by the strategy, there are two simple conditions to be fulfilled:
- A breakaway of the support or resistance level with a subsequent PBT&CA or PBT&CB.
- Confirmation of the breakaway. Wait for a DCC to form: after the breakaway, the level is retested on the next candlestick. For the breakaway of the level to be true, the price must not return behind it.
As soon as these to conditions are met, place a Buy Limit pending order from the broken resistance level or a Sell Limit if you sell after a breakaway of a support level.
Place a Stop Loss behind the high or low of the candlestick at which the level was broken away. If the candlestick is too close to the level, place the Stop Loss behind the previous one. If the candlestick during the breakaway is too large, you may place the SL a bit away from the level.
For Take Profits, you may use the nearest levels on the price chart. Alternatively, make a Take Profit 2 or 3 times larger that the Stop Loss. Never neglect your money management rules: risk no more than 1-2% of your capital in each trade.
An example of a buying trade
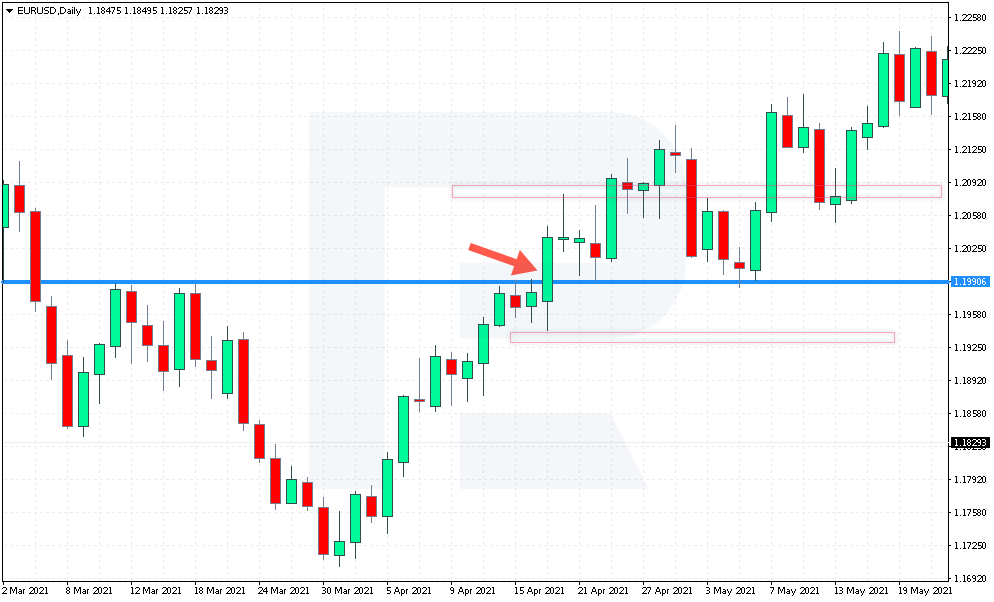
Look at a buying trade by Jarroo on a EUR/USD chart.
You see, there was a pronounced resistance level at 1.1990. After several tests of this level from below, it is broken away upwards.
On the next candlestick, the price does not drop under the level, so we can speak about a true breakaway.
Place a Buy Limit order at 1.1990, an SL at 1.1930, and a TP at 1.2090. After another test of the level, the price bounces upwards and keeps on growing to the goal.
An example of a selling trade
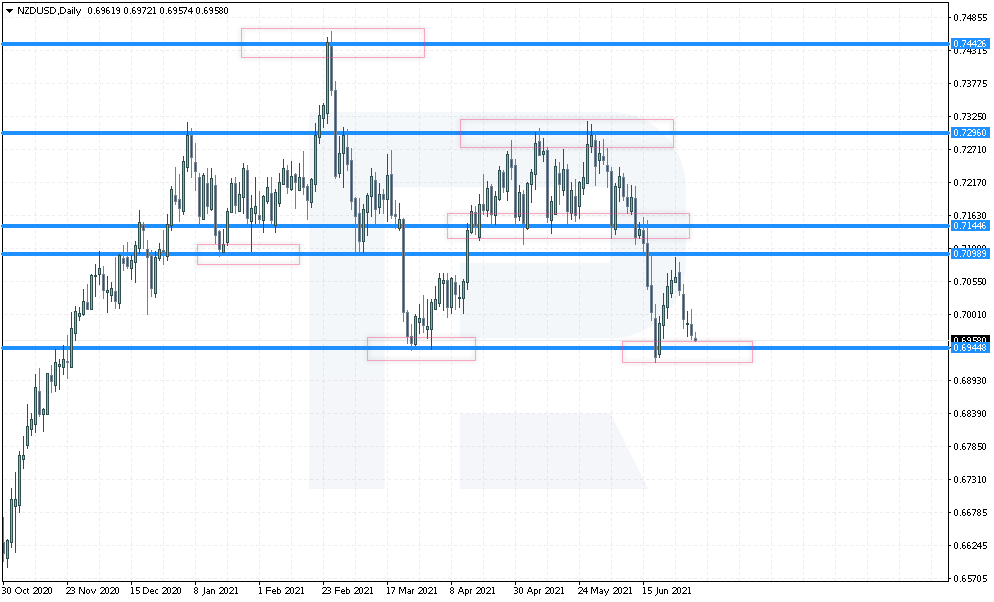
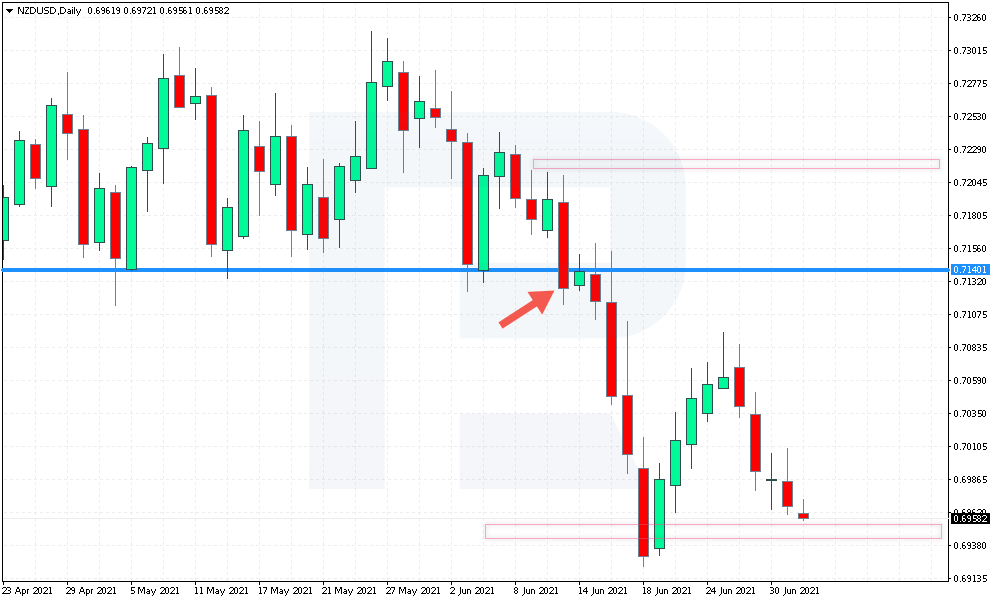
Now to an example of a selling trade in NZD/USD.
We can see a clear support level at 0.7140. At some point, the level got broken away downwards.
At the next candlestick, this level got tested but the price failed to rise higher, which made this breakaway true.
Place a pending Sell Limit order at 0.7140, an SL at 0.7215, and a TP at 0.6945: this is where lies the next support area. We see the price drop to the goal after another test of the level.
Bottom line
Many traders notice that Jarroo is a simplified version of Price Action. Here, you do not need to remember lots of patterns: just learning to find quality levels on day charts of currency pairs is enough.
Thanks to the large timeframe, you are not glued to the screen for a whole trading day; after a breakaway, you work with pending orders, which is also quite comfortable. A minor drawback is relatively large SLs that are to be hidden behind the highs or lows of candlesticks.
All in all, Jarroo gives ready-made rules of work for traders; you only need to stick to them and never forget possible risks.


