How to Trade Linear Regression Indicator

6 minutes for reading
The Linear Regression Indicator was designed and presented by Gilbert Raff. It happened quite recently, in the 1990s. So, this instrument can be called a rather new one as long as the majority of indicators have been created in the 1970s.
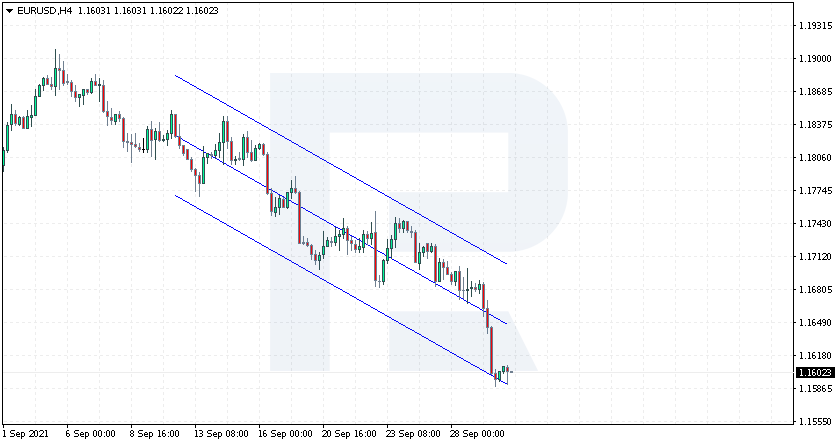
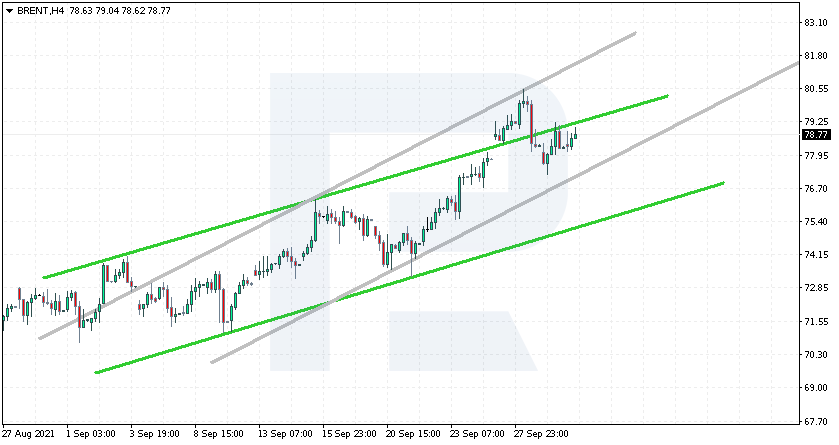
The Linear Regression Indicator, or LRI, consists of three lines. These lines show the high, medium, and low of the current price movement, forming a price channel. The upper and lower borders of the channel demonstrate the extremes to which the price has deviated from the middle line.
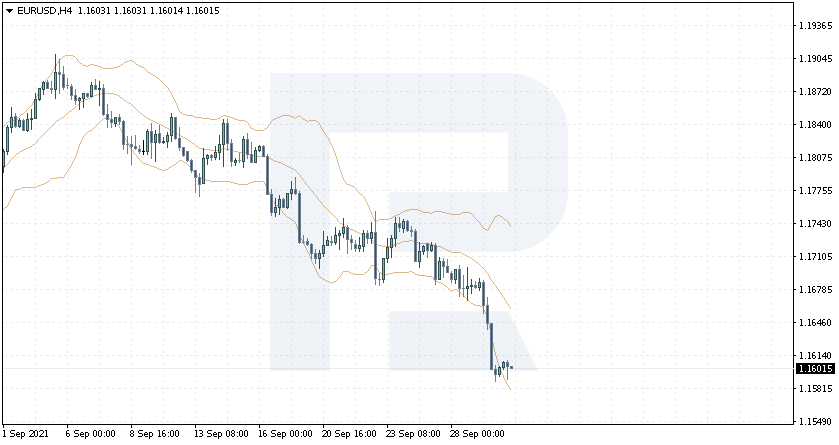
You can see that the indicator somewhat resembles the Bollinger Bands, which consists of a floating channel on the chart that is from time to time broken through by the price up or downwards, after which the price returns to the medium level.
Regardless of the fancy name, the LRI is quite simple to use.
What is the essence of the LRI?
As I have already mentioned, the Linear Regression Indicator consists of three lines.
First, the middle line is drawn based on the price levels; it is also known as the trend regression line.
The indicator adds two lines to the first one at equal distances from it. Traders say those are quality support and resistance levels, between which the price will be going for some time.
The upper border of the channel is the highest deviation level of the closing price from the central line; it is drawn through the highs on the chart. The lower border of the channel is the lower deviation of the price from the middle line; it is drawn through the lows of the chart. These lines are equally distanced from the central line, showing the largest and smallest price deviation from the regression line.


What is the difference from the normal price channel?
At first glance, it might seem that the Linear Regression Indicator is a banal price channel that you can draw by any trend lines on the chart.
However, the main difference is that with lines, the trader can draw any channel, while the LRI will use only the data from the chart. Hence, we cannot manipulate it as we please because it is bound to the price behavior.
Hence, the Linear Regression Indicator decreases the influence of the human factor, enhancing the trader’s decisions.
The second serious difference is that the LRI channel changes dynamically – as soon as the chart changes.
Beginners might be scared off by constant changes; however, you just need to remember that you are dealing with an indicator, and it reacts to changing conditions. On the one hand, it is an advantage, compared to the usual price channel, because in the latter case, the trader has to decide themselves whether to draw a new channel.
How to use the LRI?
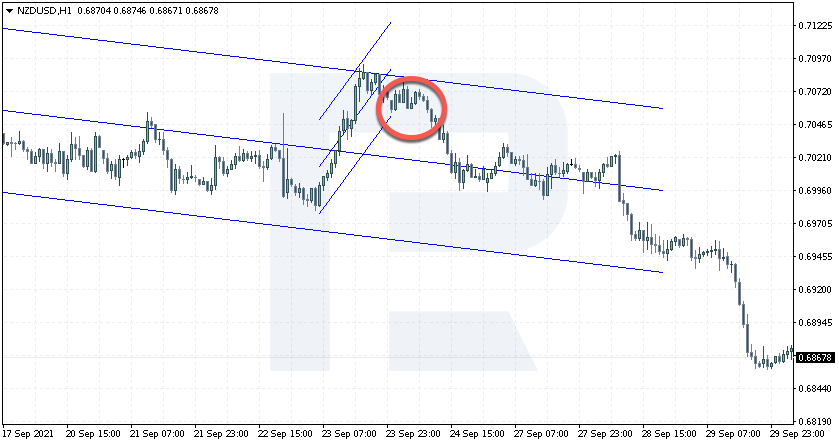
To use the indicator correctly, find the beginning of the trend and drag the indicator to the next critical point; after that, a normal Linear Regression Indicator ill be displayed on the chart.
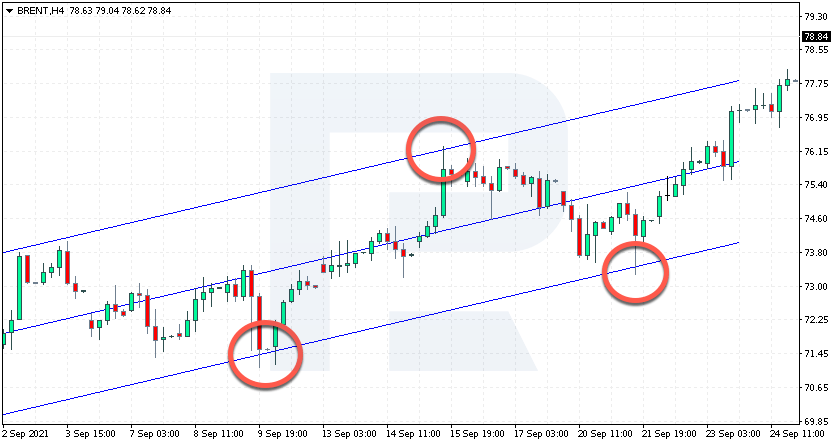
The easiest way to use the indicator is to trade off the borders of the channel.
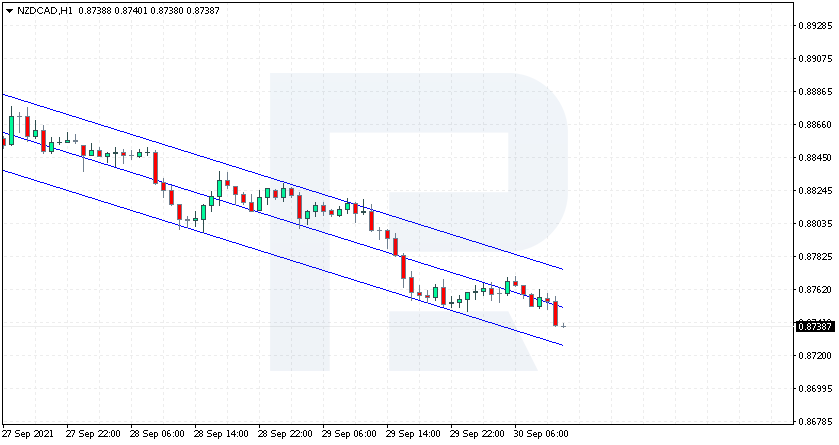
As soon as the price reaches an extreme, a bounce off it is likely to follow. Such an event is regarded as a random test, followed by a return to the middle line. Hence, at the moment when the price tests the upper order of the channel, open a selling position. On the contrary, when the price falls and tests the lower border of the channel, go buy.
The longer the signal remains inside a channel, the better signals it gives at the moments of tests of the channel borders.
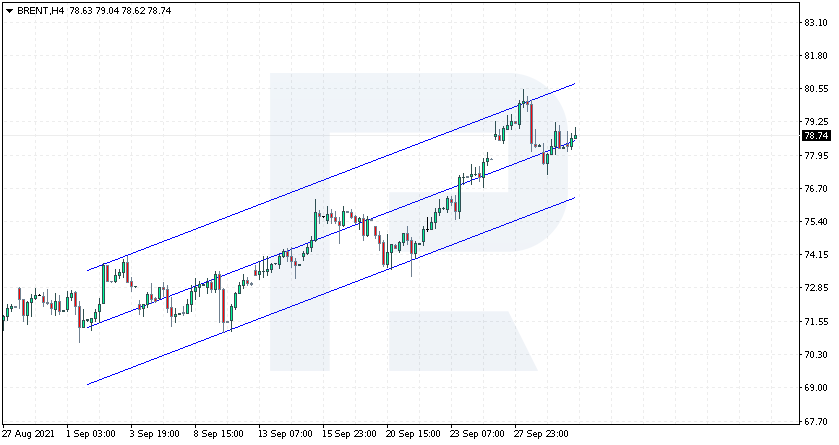
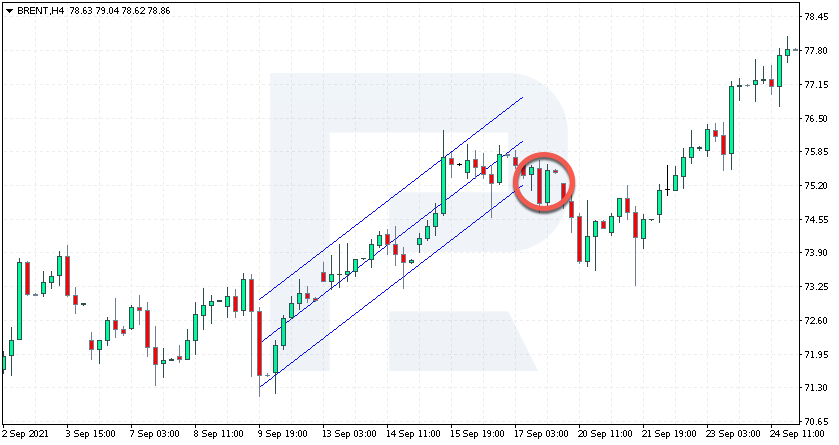
A breakaway of the channel borders is also significant as it means a possible reversal of the current trend.
For example, if the price breaks through the lower border of an ascending channel, the bullish trend is about to come to an end, and a flat or a bearish trend is going to form. Conversely, if the price breaks through the upper border of an ascending channel, this is a strong signal supporting the continuation of the trend for at least the width of the channel.


A trading strategy by the linear regression
Among the most widespread trading tactics that include the indicator are combining several channels on various timeframes and adding an oscillator to support the signals. Using various timeframes is rather simple.
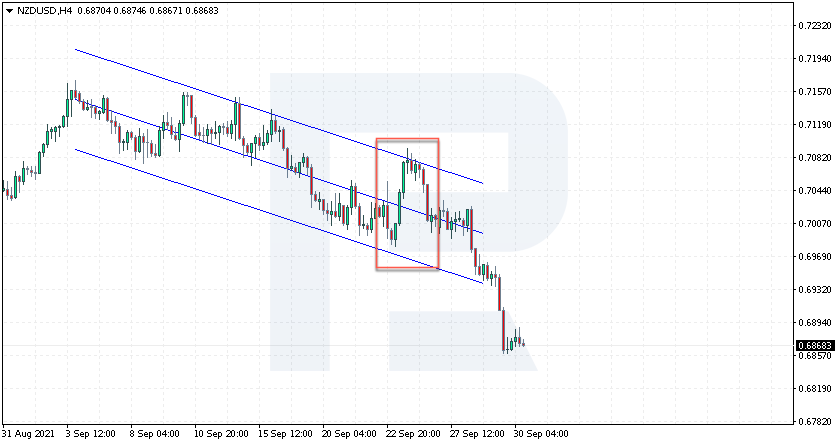
First of all, draw a regression channel on a large timeframe to check the current trend. Wait for a signal on a smaller timeframe. Such simple but widespread tactics allow trading wide market movements efficiently with minimal risks.
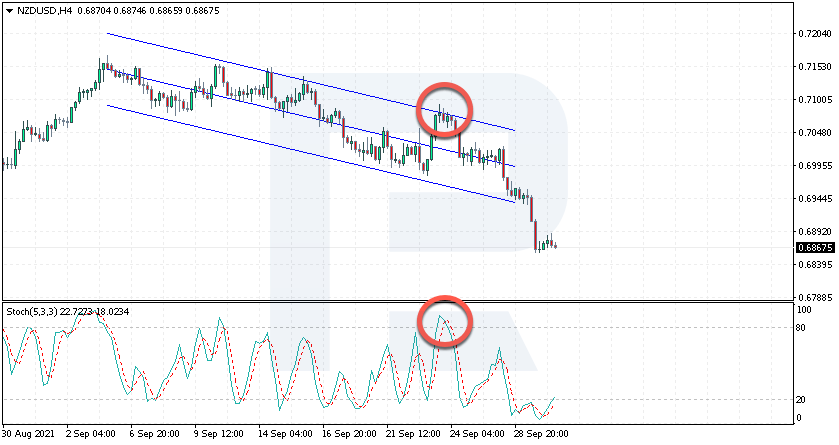
The second option suggests using an oscillator in addition to the LRI to get test signals confirmed. The Stochastic Oscillator perfectly suits this goal.
When the price reaches the upper border of the linear regression channel, check the Stochastic: if the latter is above 80, and its signal lines cross, open a selling position.
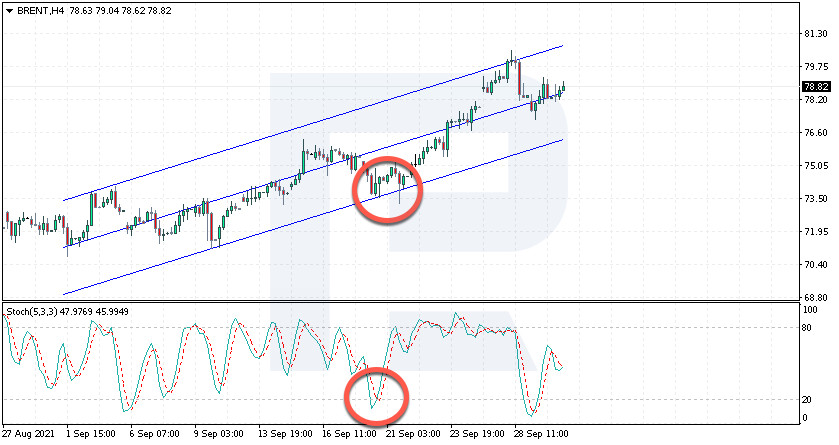
At the moment of a test of the lower channel border, it is important to get a confirmation from the Stochastic Oscillator, so wait for the Stochastic to drop below 20 and the signal lines to cross. Then open a buying position.
Place a Stop Loss beyond the linear regression channel borders and a Take Profit – a couple of points above or below the channel borders.
Advice on trading by linear regression
Traders have singled out some rules for trading by the LRI:
- Always control the regression channel, checking for breakaways; mind that it must not leave the channel borders. Such a breakaway signals a possible trend reversal.
- Try to trade in the direction of the channel inclination – this will let you trade the trend, which is the perfect way to trade efficiently.
- Only open positions when the signal is confirmed by one or more extra indicator. As noted above, a crossing of the Stochastic signal lines is enough to consider opening a position.
Closing thoughts
The Linear Regression Indicator draws a price channel based on a clear mathematical formula; hence, the influence of the human factor is minimal. Its signals are trustworthy, yet an extra oscillator for confirmation will be of help.
A serious drawback of the LRI is constant changes in times of wide price movements. However, this is a problem of most technical instruments because they just follow the price, not predicting its future.


