How to Trade Dragon Pattern: Manual

11 minutes for reading
In technical analysis, there are patterns that can help you catch a market reversal on time. Among strong patterns, people name Double Top and Double Bottom, a.k.a. W-top and M-top.
Fairly enough, the market does not normally reverse by a single strong movement in the opposite direction. Most often, it forms a reversal pattern to get started.
Apart from using classical reversal patterns, some traders modernize identification and trading rules of existing structures. One example is the Dragon pattern.
The Dragon pattern looks very much like a Double Bottom but features some unique rules that identity it as a separate pattern, not a classical price structure. As the author puts it, the Dragon can be traded on various timeframes, while a low risk-to-profit ratio makes it even more attractive for traders.
The article is devoted to distinguishing the Dragon from a classic Double Bottom, the rules of trading, levels of taking the profit and leaving the market if necessary.
Structure of a bullish Dragon
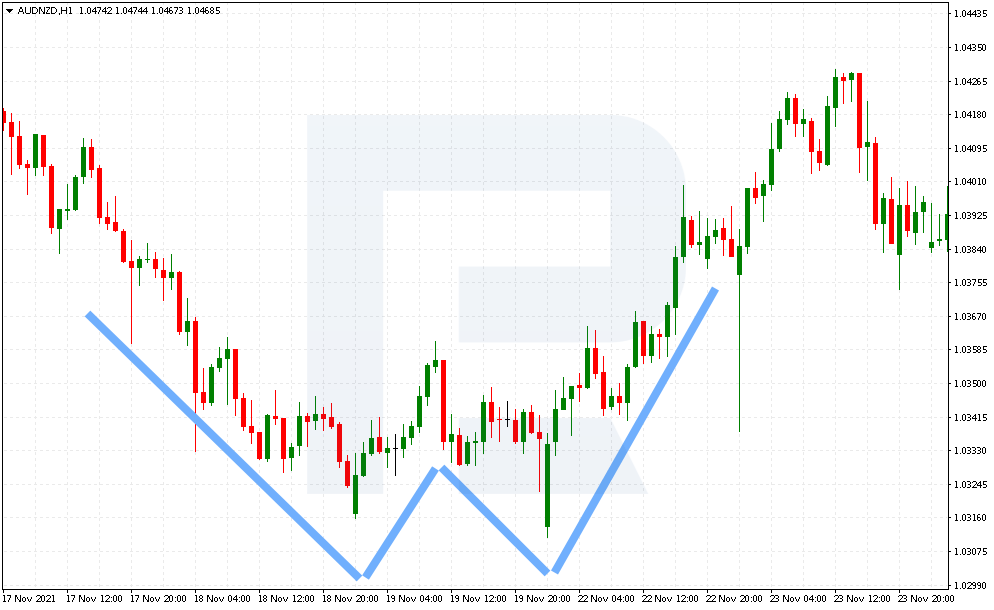
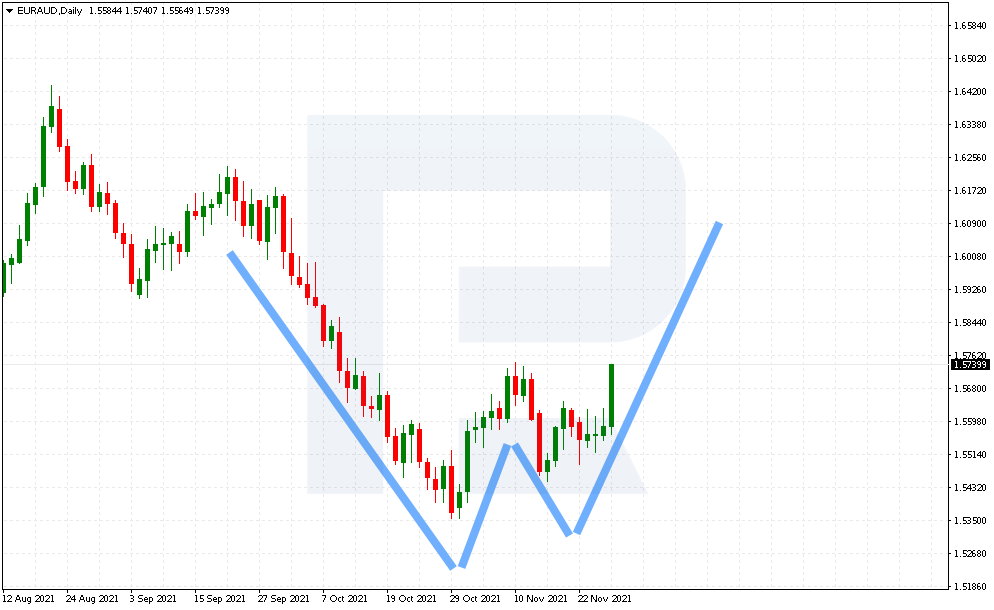
Let me inform you from the start that there is a pattern that forms at the bottom of the market, giving a signal to buy, and a pattern at the top of the market that suggests selling. As mentioned above, the pattern looks like a W-shaped bottom. Look at its structure in more detail:
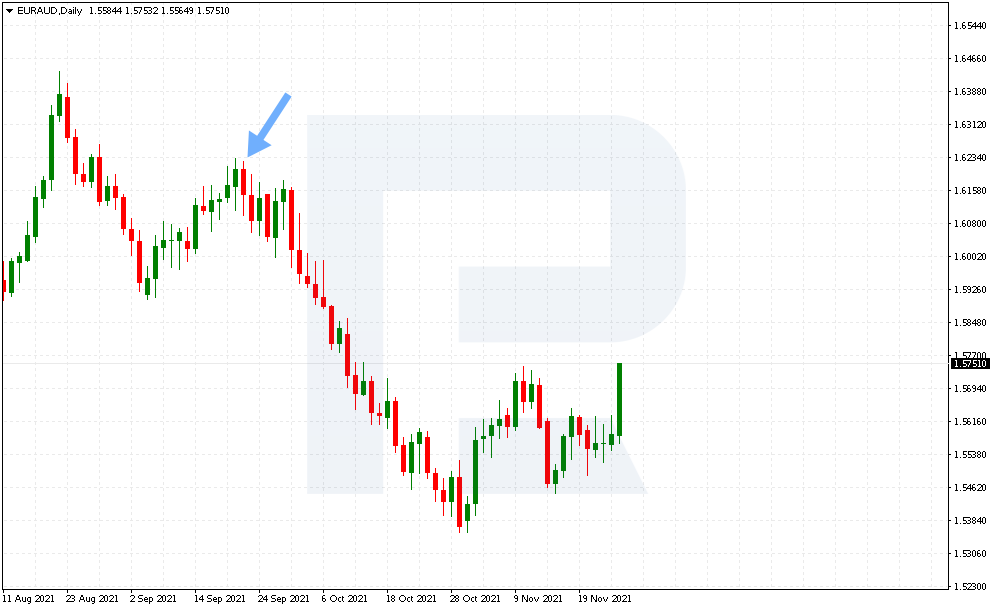
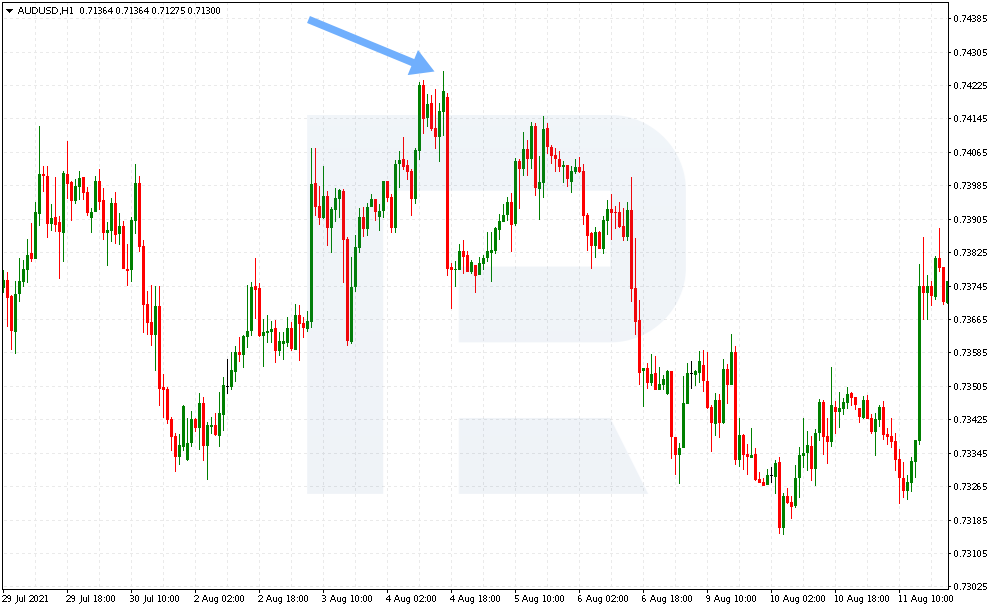
For the bearish market, the Dragon starts forming in a point called the Head. This is the first movement from the local high to the low of the pattern.
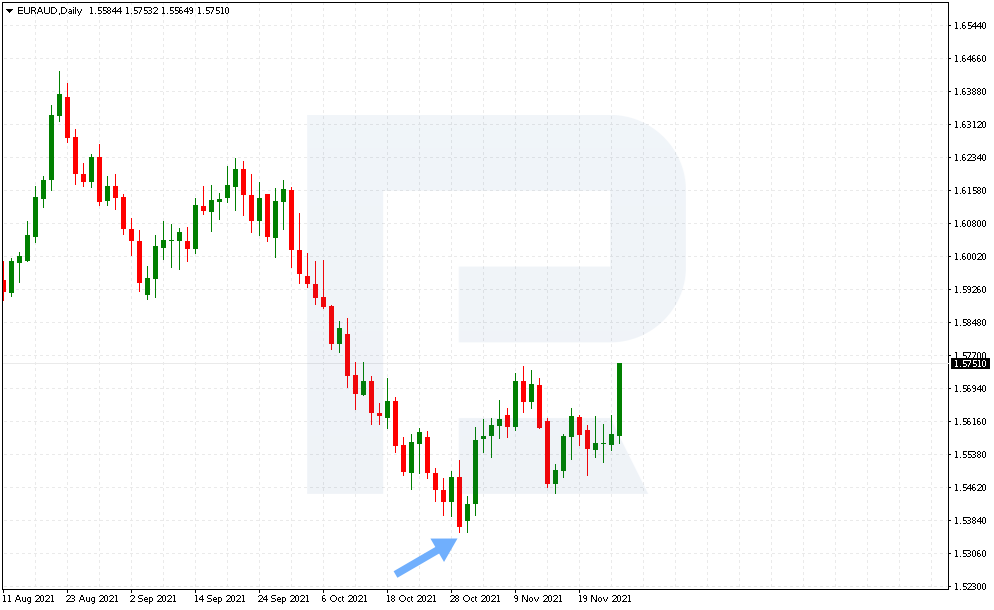
As soon as the price reaches the low and pushes off it upwards, the point turns into the Left Paw of the pattern.
The the price bounces upwards but fails to break through 38.2-50% Fibo drawn from the Head to the Left Paw.
This peak is called the Back of the Dragon. The price must not rise above this correctional level. If there are some irregularities in the pattern you have found, skip it. In the classical pattern, the trader does not need to assess where this peak is situated. This might be the key difference between the Dragon and Double Bottom.
The next decline can be a bit lower or higher than the Left Paw, between 5 and 10%. This is the Right Paw. And this is another difference from the Double Bottom, where both lows must be at the same level.
As soon as the price starts growing from the second paw of the pattern, we can call the Dragon complete. The author says there can be candlestick reversal combinations or divergences on technical indicators that can give additional signals to open a position.
The opinion of traders regarding the Right Paw differ: some say that the pattern works better when it is below the Left one, while others say that position slightly above the Left Paw is more efficient.
The price movement from the Right Paw upwards is called the Tail. There the trader must find the points of taking the profit by the pattern.
Structure of the bearish Dragon pattern
Now to the bearish version of the Dragon. This one looks very much like a Double Top. Let us take a closer look at it the structure:
In a bearish market, the Dragon also starts to form at the Head point. This is the first movement from the local low to the top of the pattern, from where the decline will begin later.
As soon as the price reaches the high and pushes downwards, the Left Paw forms.
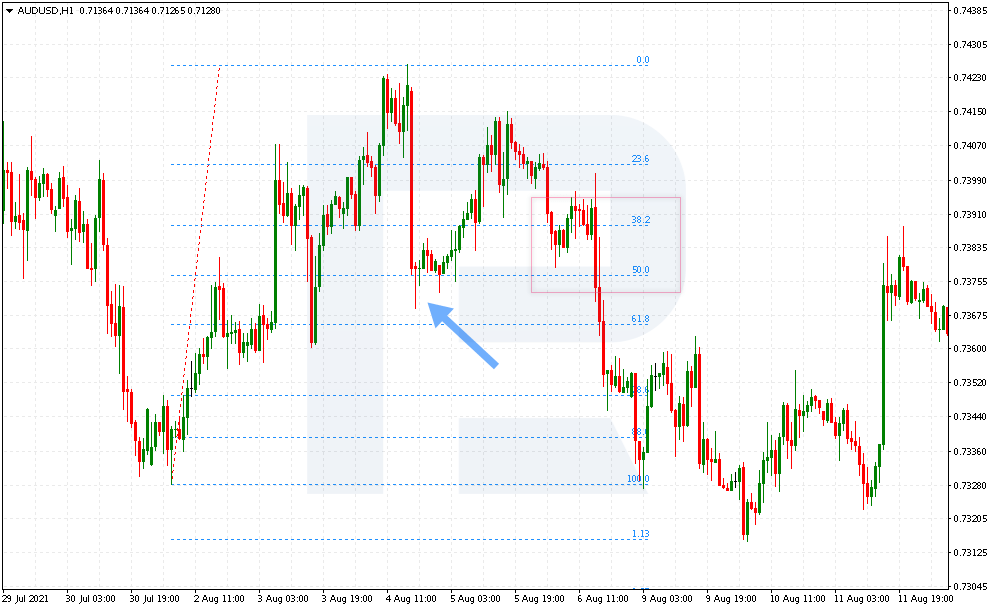
The the price continues to fall, yet within the Fibo correction of 38.2-50%. This is where the Back of the Dragon should form.
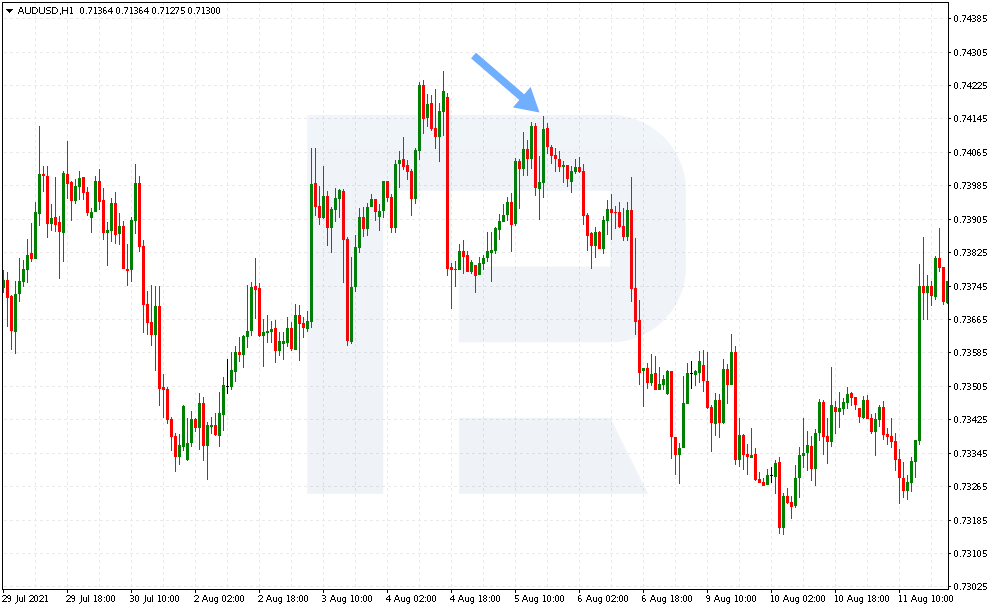
The next upward movement from the Back can be higher or lower than the Left Paw by 5-10%. The Right Paw should form here. Start looking for aggressive entry points but wait for some confirmations if you are used to more conservative trading.
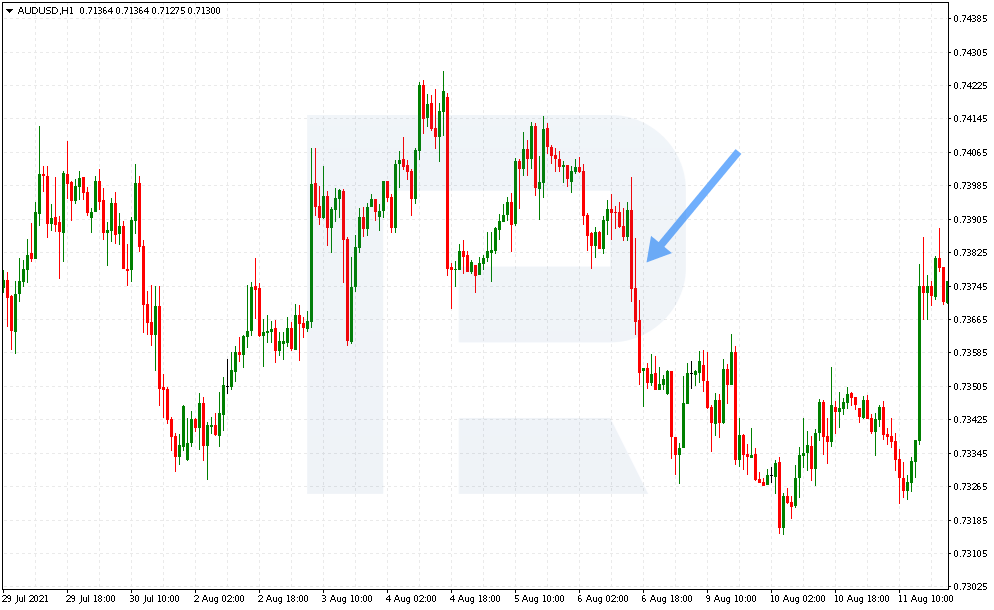
Then a downward movement is to follow, the so-called Tail of the Dragon. There we find the points for taking the profit from selling by the pattern.
Where to open a position by the Dragon pattern?
In their first works, the author suggested looking for opening signals on the Right Paw but later only breakaways of trend lines were regarded as strong entry signals.
However, a huge advantage of opening a position when the second paw is forming is its tiny risk compared to potential profit. So, aggressive traders can use this chance to open positions with a minimal Stop Loss.
Draw the trendline from the Head through the Back of the Dragon. As soon as the price closes above such a line, and there is, for example, a divergence on the MACD, this will be the second signal to open your position by the pattern.
The third opening signal is a breakaway of the Back of the pattern that lies between 38.2-50% of correction from the Head to the Left Paw. Here the trader expects a breakaway of the horizontal level. The signal is quite similar to the classic Double Top and Double Bottom pattern.
On a bearish piece of the chart, there are three stages of entering the market by the Dragon:
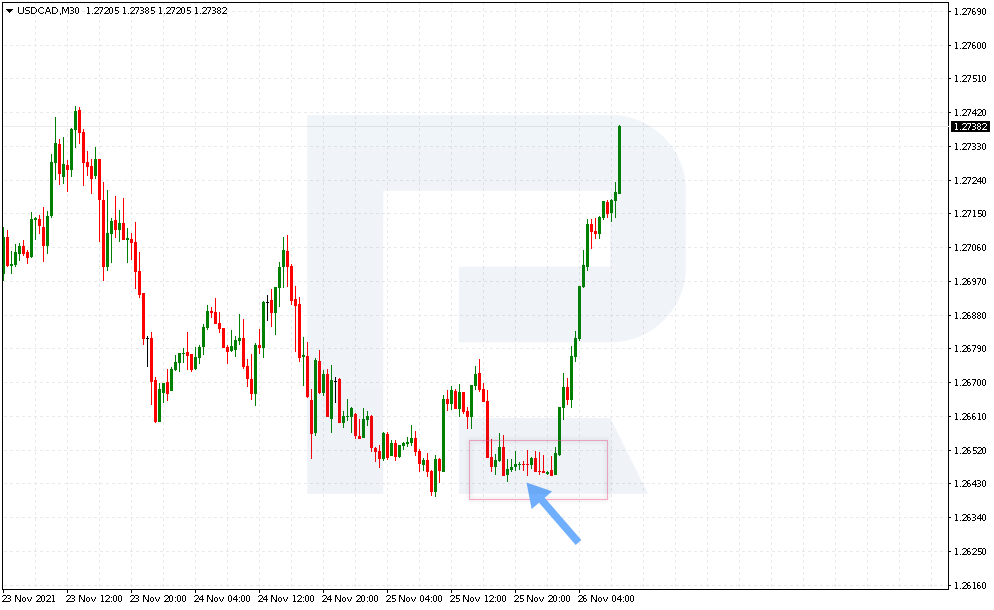
- Open the position when the Right Paw is forming. Such a position will be aggressive, because the pattern is not quite complete, and the reversal is not confirmed yet. However, a low risk-to-profit ratio looks appealing.
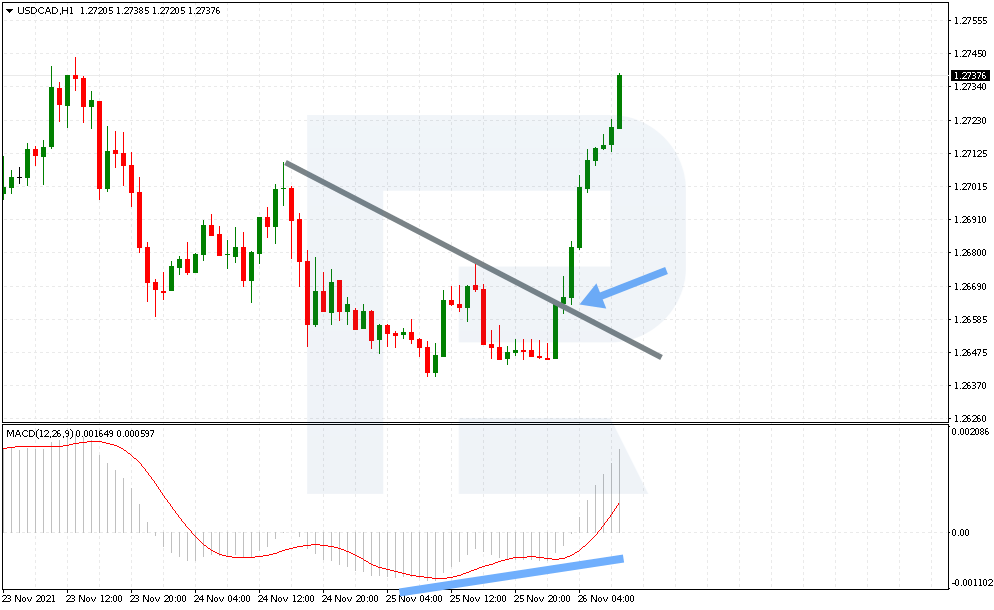
- Open the second position at the breakaway of the descending trendline that you draw through the extreme points of the Head and Back of the Dragon. This is a more conservative trade. The pattern is almost complete, and there is a confirmation in the form of a breakaway of the descending trendline.
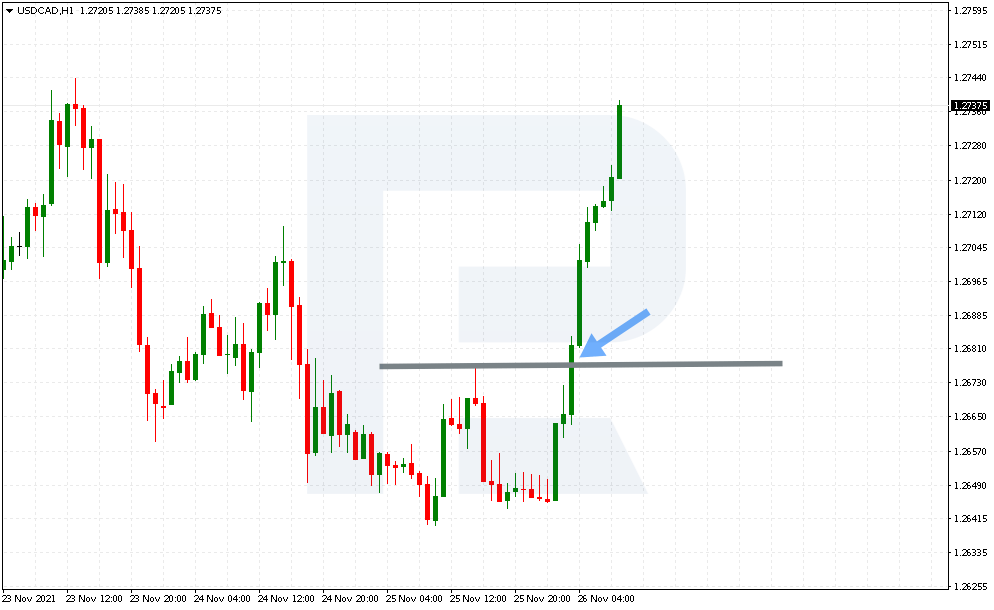
- Open the third position at the breakaway of the Back of the Dragon. This is a very careful trade and has a much higher risk to profit ratio.


How to set goals by the Dragon?
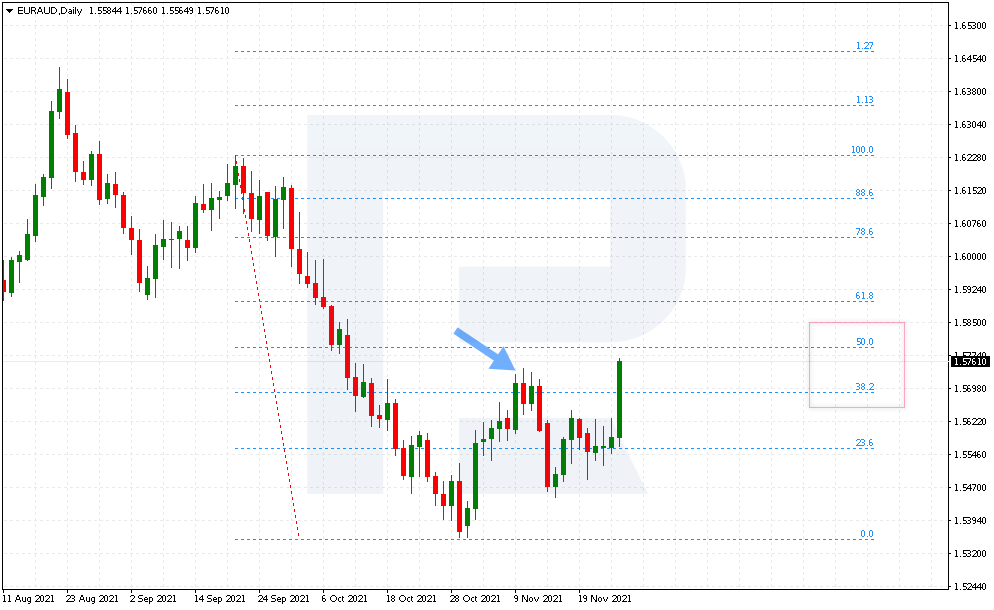
In the classical W-shaped and M-shape, we take the height of the pattern to set the goal. The Dragon uses Fibonacci levels to set goals for taking the profit. You can place the Take Profit on one of the three levels of correction:
1.The first goal is placed between 61.8% and 78.6% of correction from the Head to the Left Paw.
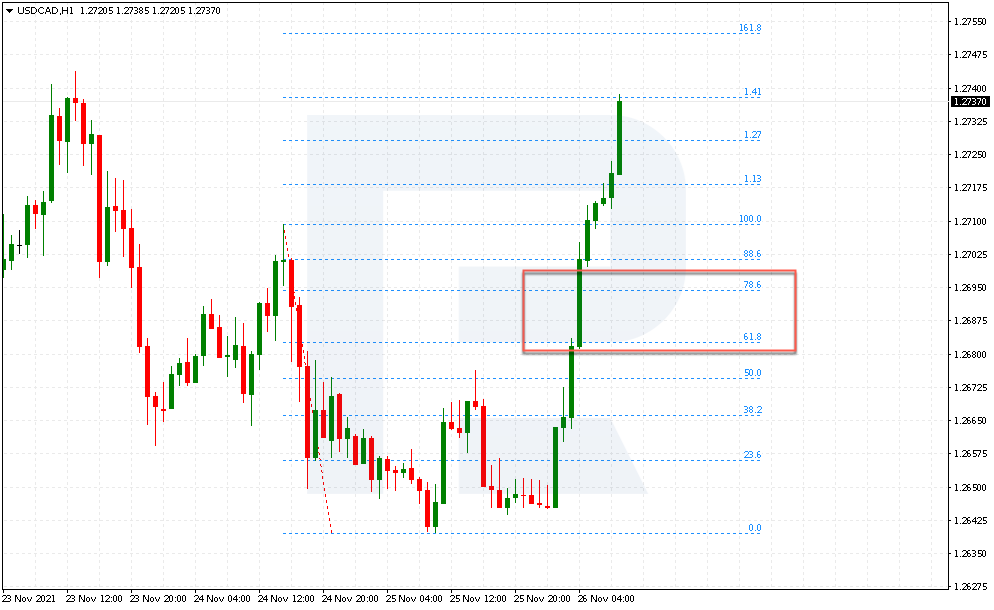
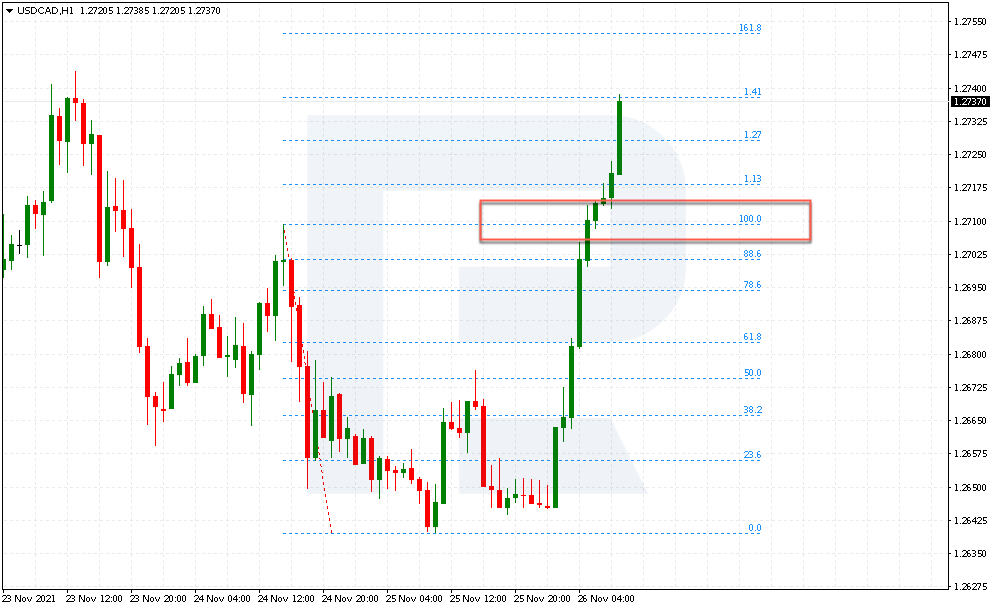
2. The second goal is at 100% of correction. As a rule, this point coincides with the Head level.
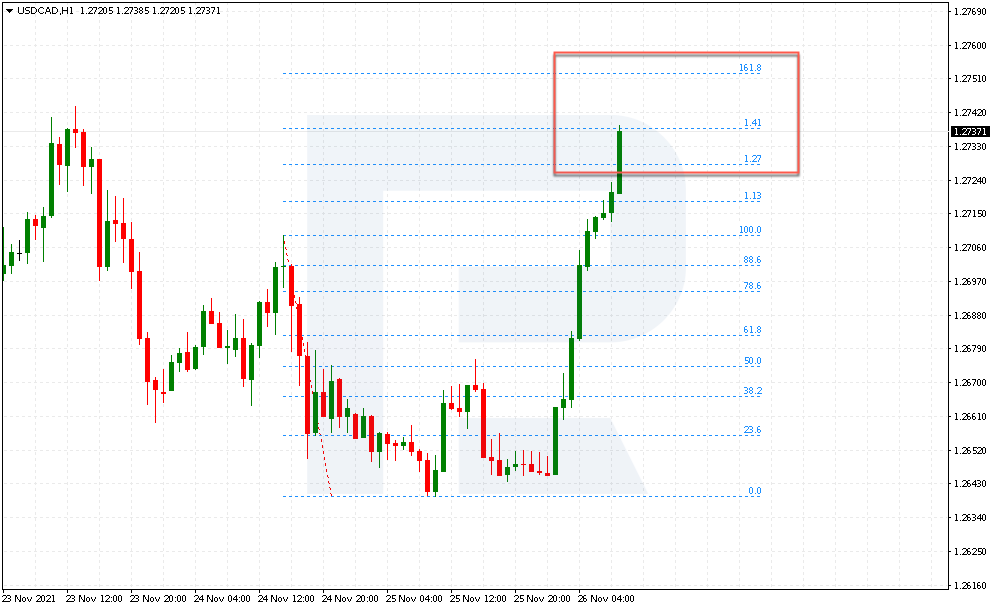
3. The third goal, the most optimistic one, is between 1.27% and 1.618% from the Head to the Left Paw.
Where to place a Stop Loss?
The Stop Loss for this pattern is placed below the low of one of the Paws. If the Left Paw is below the Right, the place the SL below this level. If the Right Paw is lower than the Left one, use the second Paw as the headline and place the SL below it.
Simply speaking, place the SL below the low of the bullish pattern or above the high of the bearish pattern.
Example of opening a position by the Dragon
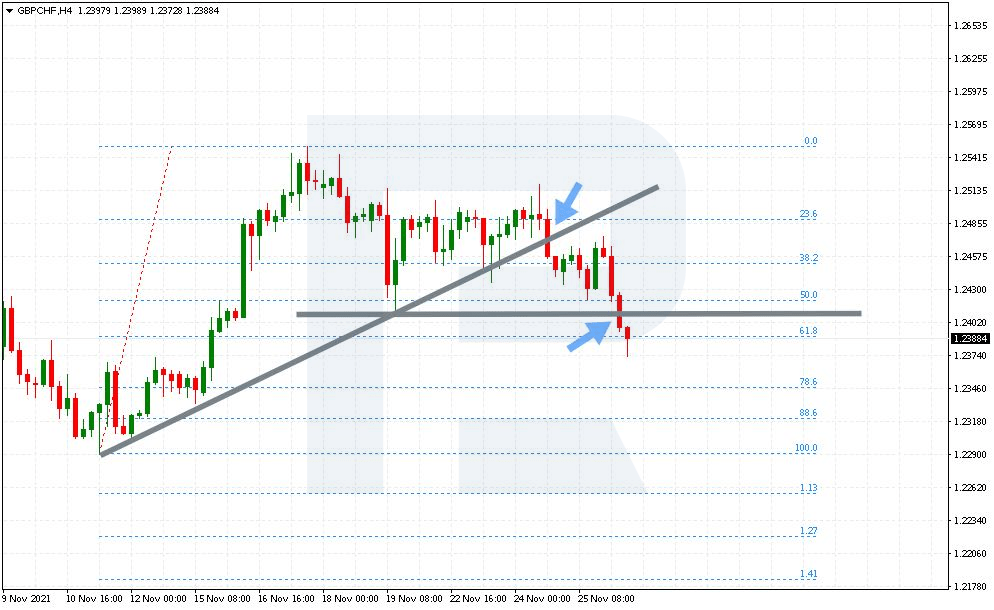
Let us see how the pattern works on the example of GBP/CHF. As we see, there is a bearish Dragon pattern forming, we already have the Left Paw and Back. We can looks for a signal to sell right now because the Right Paw of the pattern is falling, and this is an aggressive place for the first trade. Place a Stop Loss above 1.2555, i.e. above the high of the Left Paw.
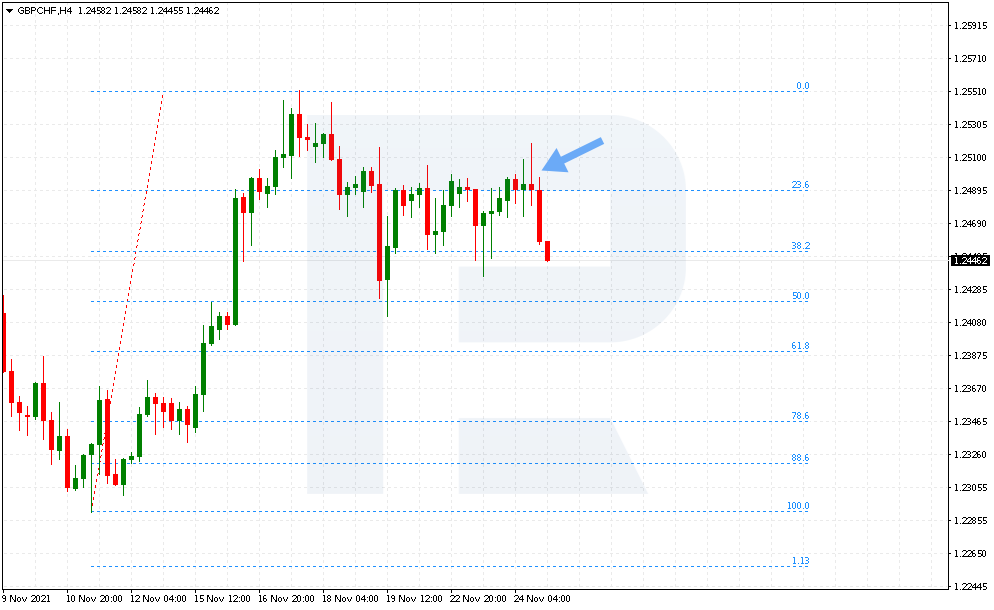
Then we can suppose that a breakaway of the ascending trendline will happy at 1.2460 — this will be the second entry point. A breakaway of the Back will happen at 1.2410 — and this will be the third selling position.
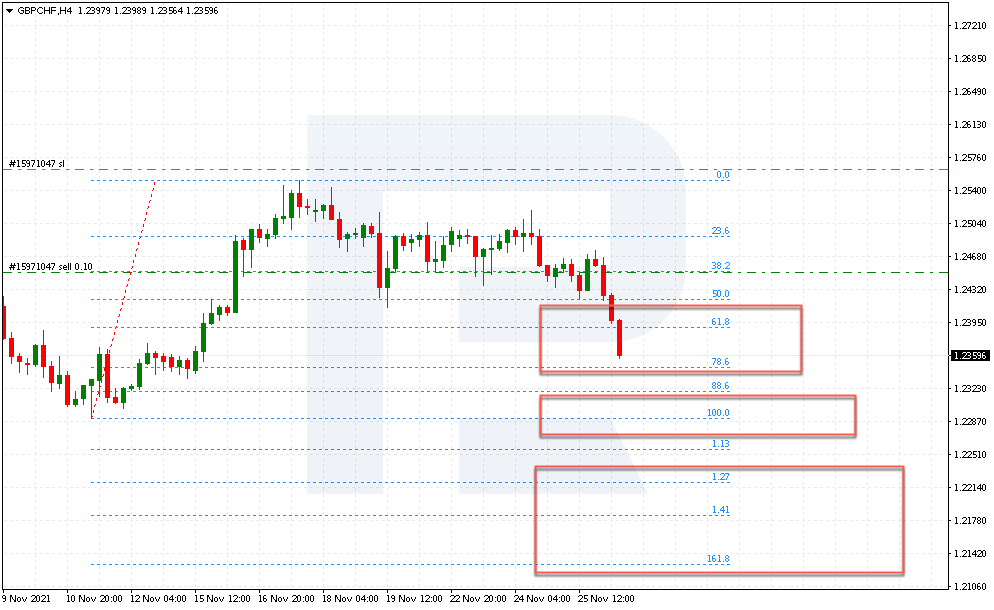
Take the first profit when the price tests 1.2390-1.2346. The second one — at 1.2290, and the third one — between 1.2222 and 1.2130.
Bottom line
The Dragon pattern is an improved version of classical reversal patterns that can easily be found on the chart by Fibo. The author provides us with entry points and more exit options. In classic patterns, there is only one goal and one opening point. Trading by the Dragon, the trader gets three entry points, from an aggressive to a more careful one, as well as three exit options with different profit sizes.
The pattern works well on various timeframes. The best option will be looking for the pattern by the trend.


