How to Use EIA Oil Report in Trading

5 minutes for reading
This overview is devoted to the weekly EIA report about the situation in the oil market that influences the quotations of black gold quite a lot. Many traders keep a close eye on this publication and use the information in trading.
What is the EIA report
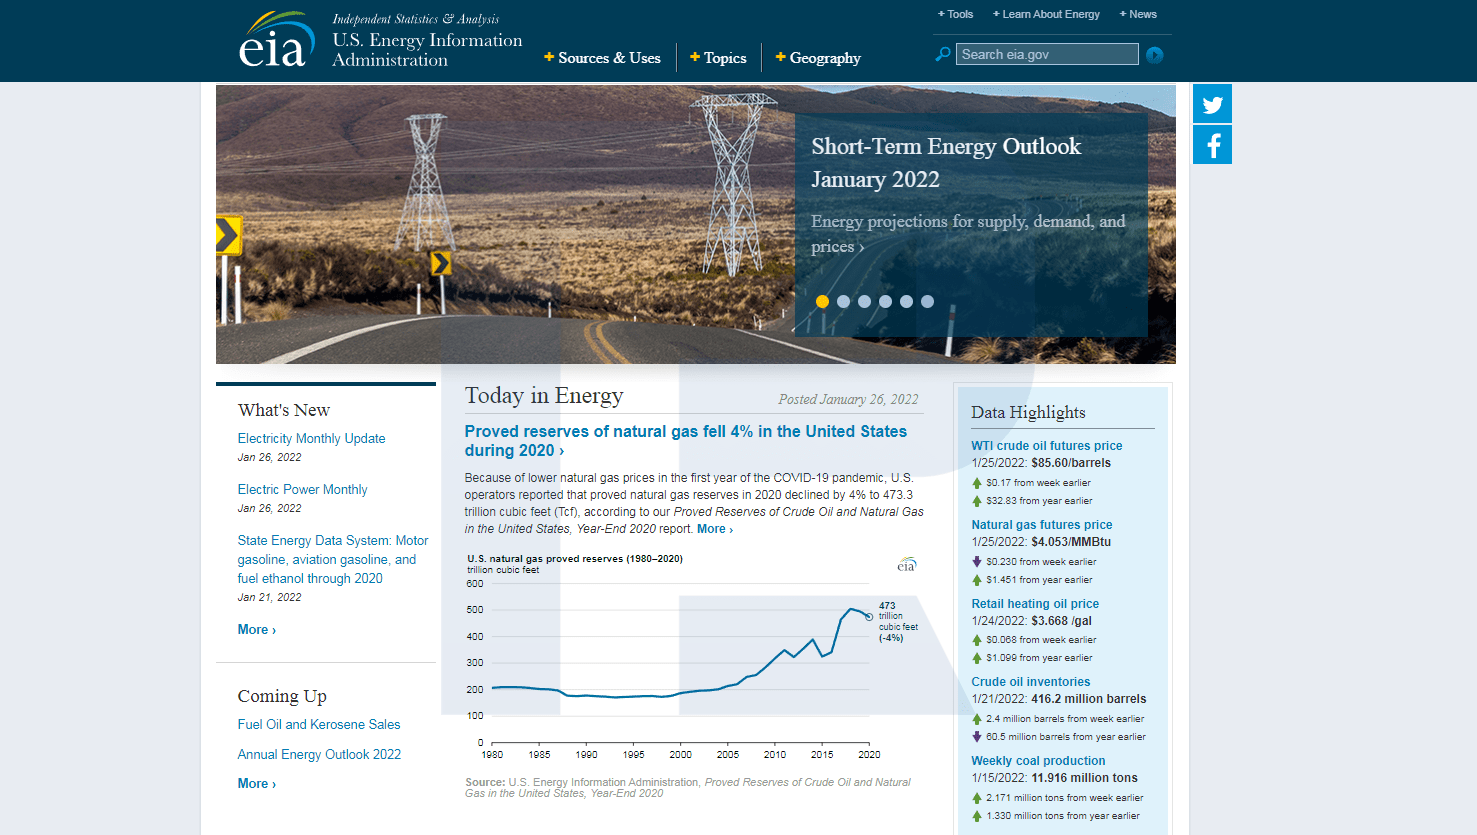
Energy Information Administration (that EIA stands for) is a department of the US Ministry of Energy created in 1977. It is responsible for objective collection of energy data, analysis, and economic forecasts. The department regularly publishes various reports on the topics around energy. Among them, there are reports on energy carriers reserves, demand for them, and prices.
The United States are not only the largest consumer of oil (consuming about 20% of global oil) but also the leading oil producer. The supply and demand balance in the USA gives a rough idea of the oil market on the whole. Traders, investors, and other market participants follow attentively oil statistics from the USA. Publication of these data is quite often followed by serious market volatility.
One of the most popular EIA reports is the weekly report on the state of the oil market called This Week In Petroleum. This report is published every Wednesday and contains comments on changes in oil reserves, demand, and other parameters of crude oil and oil products. If there are some unexpected major changes about crude oil and petroleum in the report, the market might react dramatically.
Fresh data, economic forecasts, and EIA reports are available online at the official EIA website https://www.eia.gov/.
Which info is there in the report?
Investors and oil traders study the EIA report very carefully to use the data for forecasting the behaviour of prices for energy carriers. Analysts from energy companies also use the report to collect data that help them develop long-term business strategies.
The information published in the EIA report:
- Domestic Production: production level of the previous week in the US. This is prelim estimation that can be mended later.
- Percent Operable Utilization: if refineries work at their most, this might indicate increased demand for oil products.
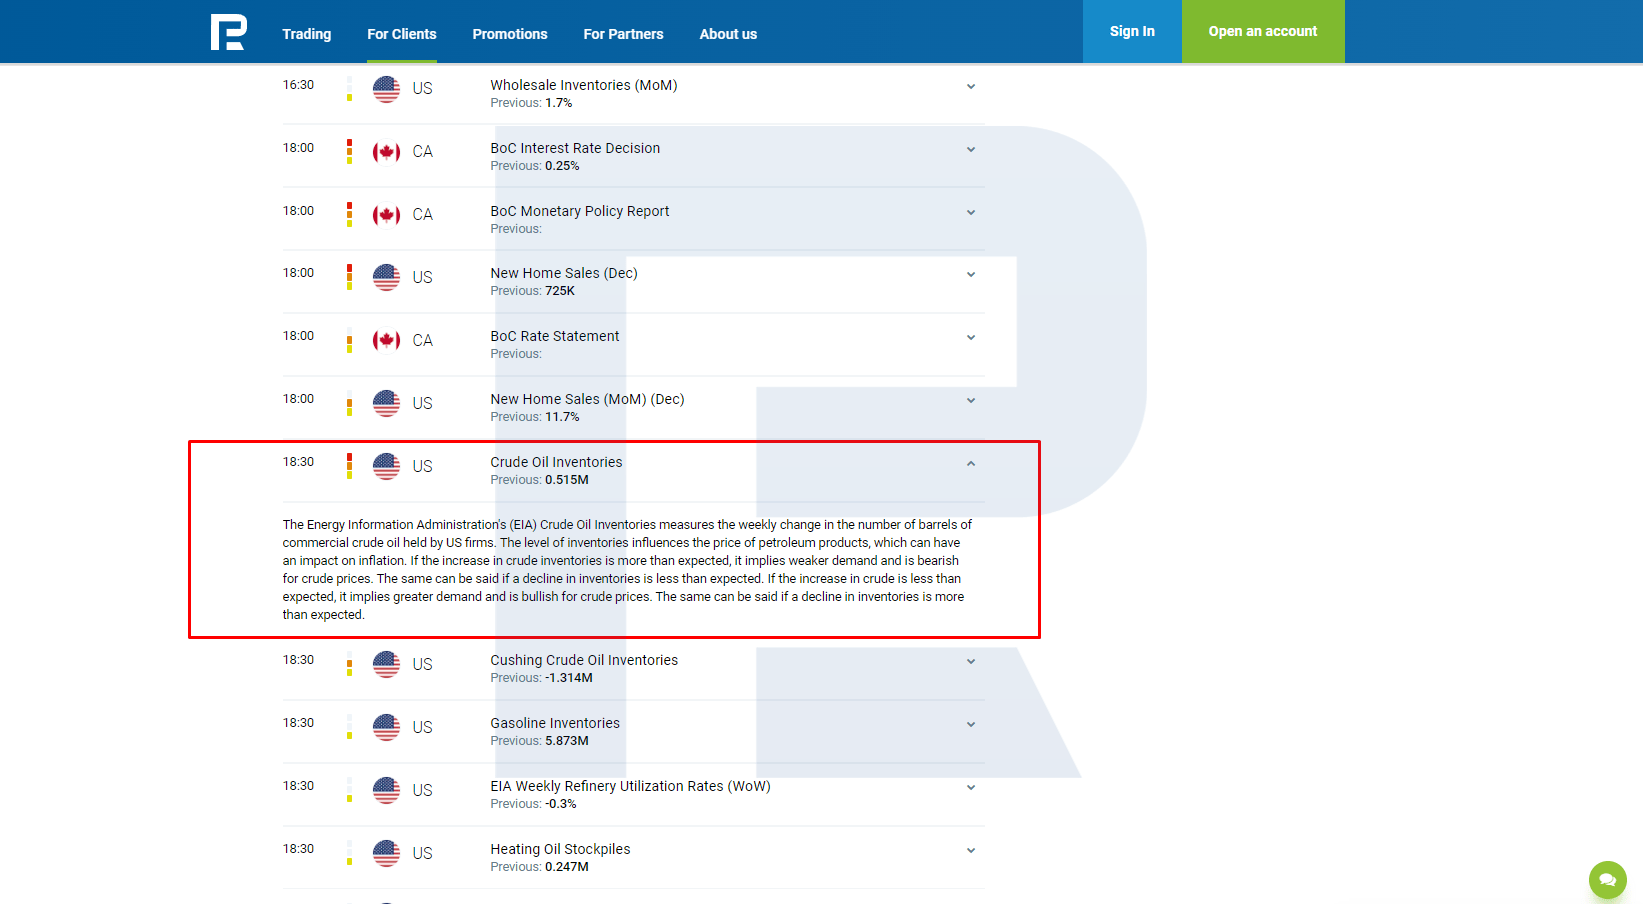
- Crude Oil Inventories: this is the most important part of the report that represents the changes in oil reserves in the US.
- Total Motor Gasoline Stocks: obviously, this represents changes in gasoline stocks. This parameter is seasonal: in summer, demand for gasoline grows, which might be reflected in a decrease in the stocks.
- Distillate Fuel Oil Stocks: represents changes in the stocks of crude oil products.
- Crude Oil Import: represents – obviously – changes in the import of oil in the US. An increase in the import can sometimes lead to the growth of oil inventories.
- Crude Oil Export: represents the dynamics of oil export from the US. This parameter has been growing since a couple of years ago.
The key parameter is Crude Oil Inventories. If the report represents a higher parameter than had been expected, this means the demand is weak, and oil quotations become stressed out. A decrease in oil inventories means that the demand has got higher than the supply and helps oil prices grow. Crude Oil Inventories in the US are published weekly on the Economic Calendar.
How to use the report in trading
Oil quotations are influenced by a whole bunch of data, including the EIA report. And as long as the report influences the quotations, investors and traders use it in their work. Investors prefer long-term strategies and traders – short-term ones.
Long-term trading
For planning long-term trading which means holding an open position for weeks or months, traders analyse the reports over a certain period.
For example, they can check for a downtrend or uptrend in oil inventories over several weeks or serious deviations from the average over several years.
Though weekly EIA reports provide data important for understanding oil supply and demand balance in the US, investors also have to be attentive to the international situation.
OPEC+ members regularly gather to discuss oil production quotas and oil prices. As long as OPEC+ controls about 70% of global oil production, changes in the policy of the organization can have a serious influence on oil quotations. This should be kept in mind for long-term trading.
Short-term trading
Trading strategies used for short-term trading on changes in oil reserves in the US have little differences to the general principles of trading news. When the data is published, short-term momentum movements of the quotations emerge, and they can be used for trading.
The direction of trading is chosen based on the current market situation, the technical picture, and data published in the report. Use tech analysis to detect the trend and draw the nearest support and resistance levels.
The result will be the prevailing direction and a trading plan. The more the published data differs from the forecast, the stronger the movement can be.
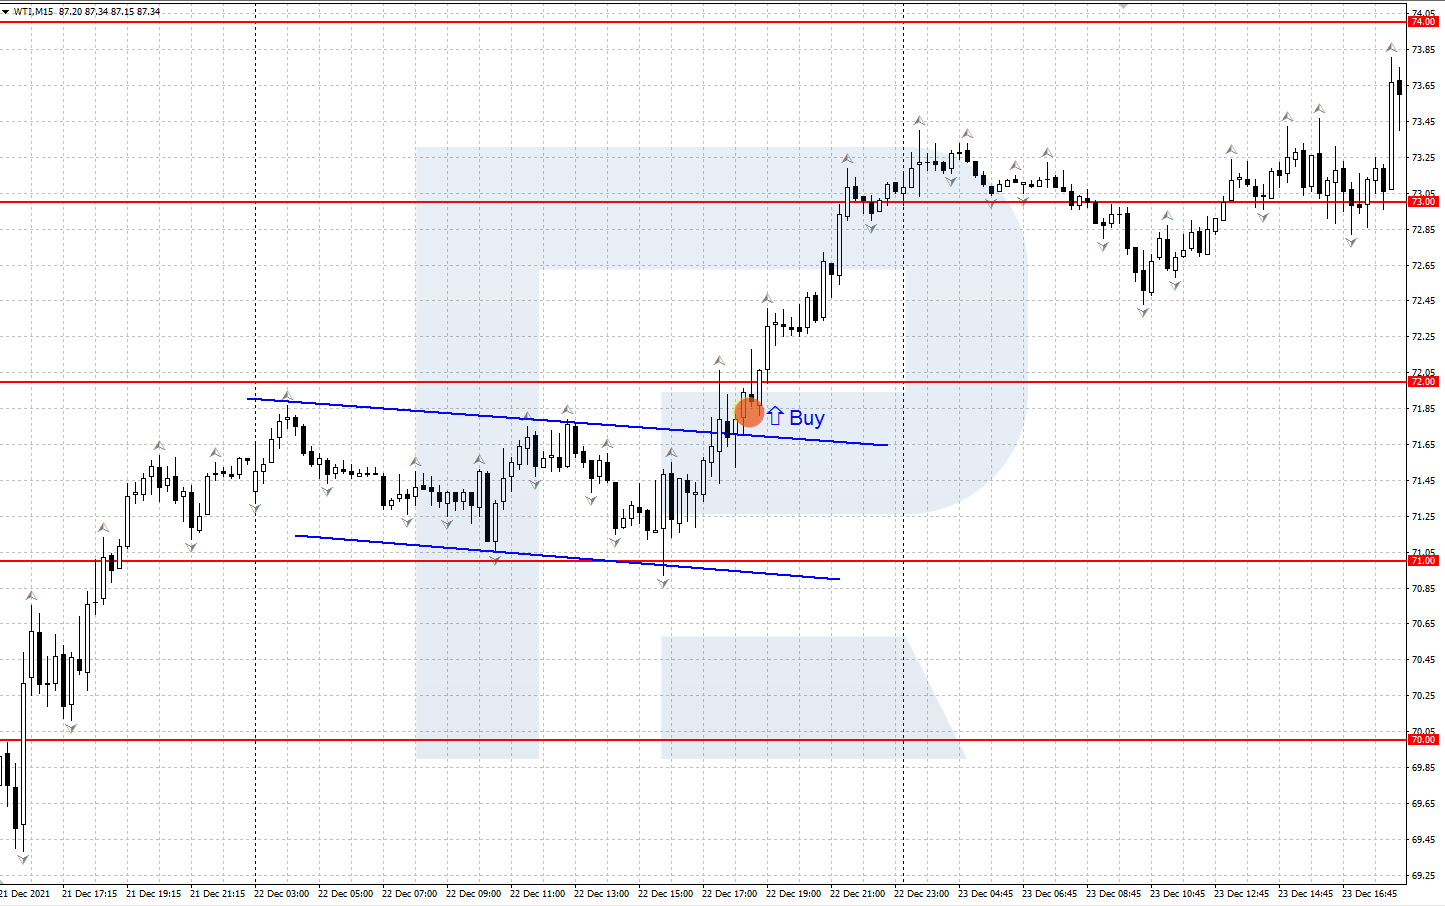
Example:
- 22 December 2021, an EIA report was published. Oil reserves had been expected not to change yet they dropped by 2.377 million barrels. This made oil prices grow.
- Before the publication, the tech picture supported oil price growth.
- As a result, the WTI oil demonstrated confident growth during the US session for about $1.5 and kept growing later.
Closing thoughts
The EIA report on the changes in the US oil inventories has a great influence on the quotations of black oil. Traders and investors assess the data carefully and use them for short-term and long-term positioning.
For short-term trading, they use tech analysis and dramatic difference between real and forecast data. Long-term strategies account for the aggregate of factors that influence oil quotations: the EIA report dynamics, OPEC+ policy, geopolitical risks, etc.


