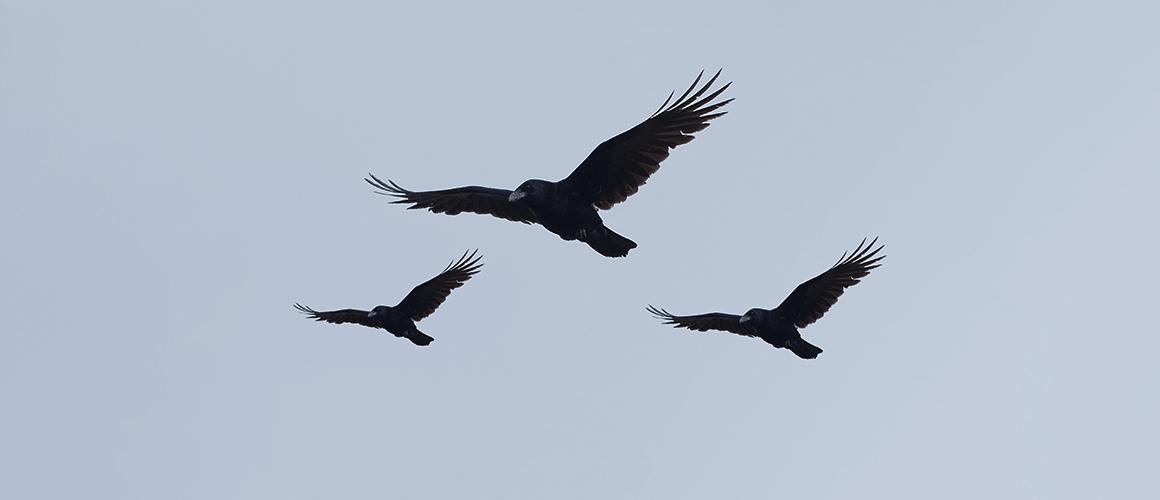
How to Trade Three Black Crows Candlestick Pattern
5 minutes for reading
In candlestick analysis, all patterns can be divided into two groups – trend continuation patterns and reversal patterns. Today, the article is about the Three Black Crows pattern belonging to the second group. This is definitely not the most frequent pattern on the chart yet experienced traders who use candlestick analysis are well acquainted with it.
How Three Black Crows pattern forms
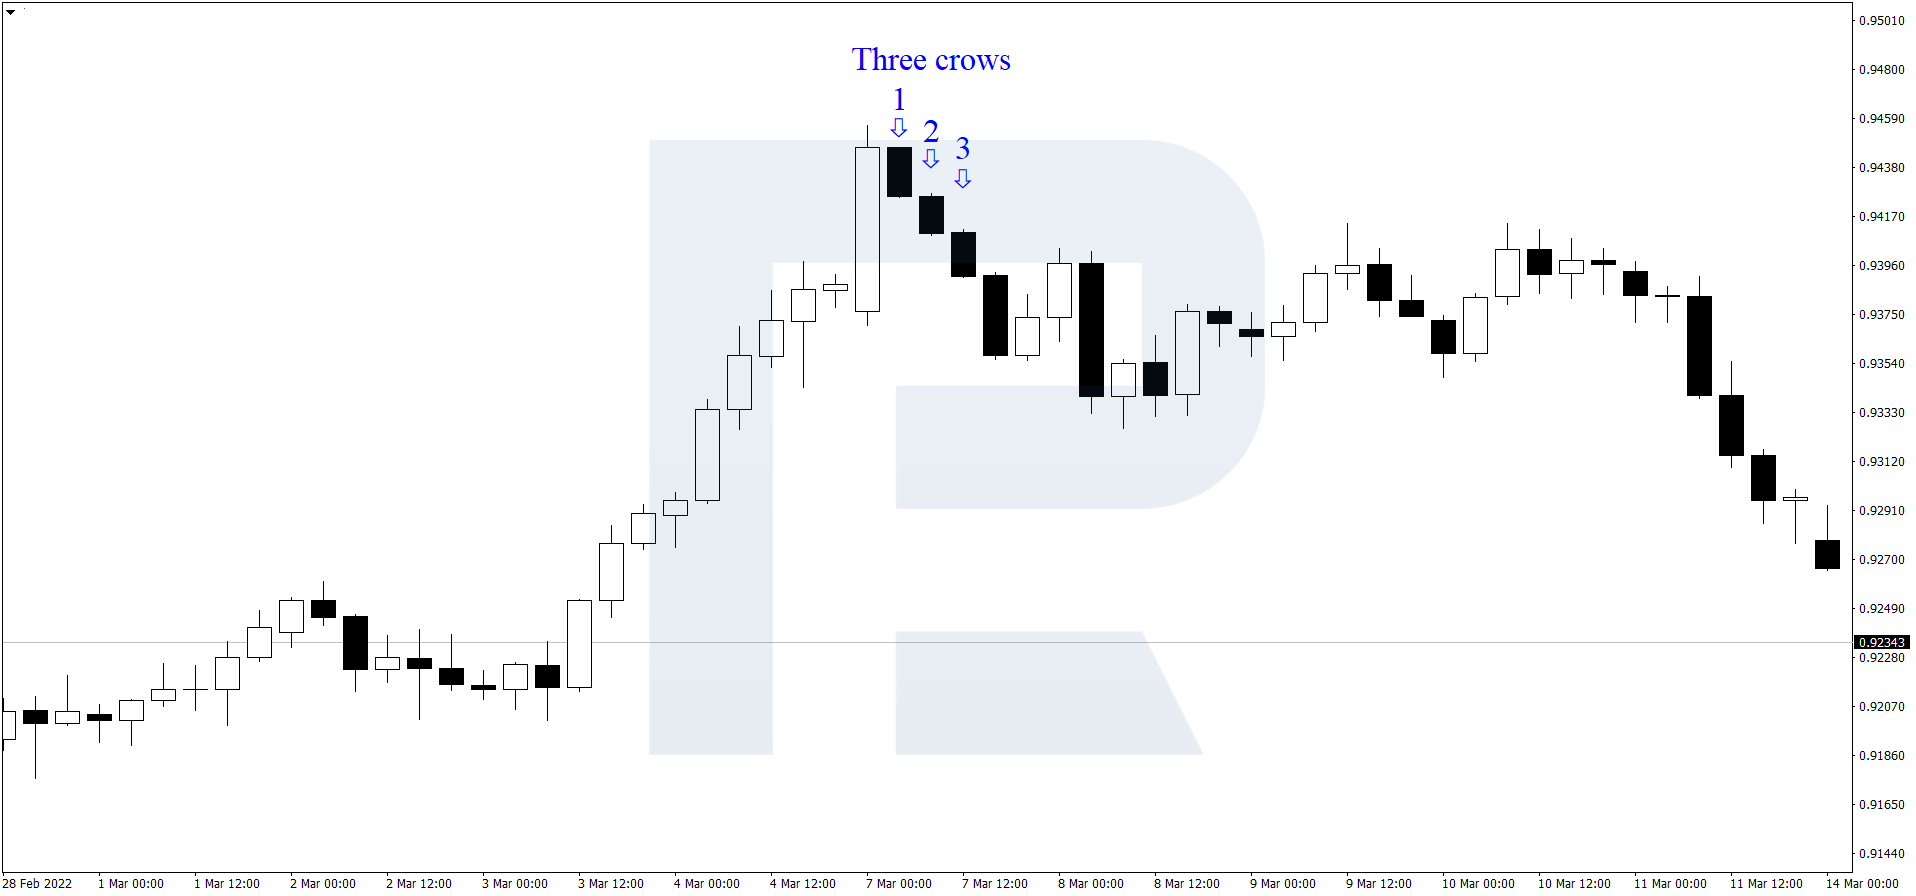
After a lengthy ascending impulse and a lot of purchases market players start closing their positions. The price forms a minor gap, and the first candlestick out of the three comprising the pattern opens above the previous closing price or at the same level.
Then the second candlestick opens at the close level of the first one, and after it closes in its turn, the third candlestick opens. The opening price of the third one coincides with the closing price of the second one or belongs somewhere close to this level. Next, the trend reverses.
Conditions for 3 Black Crows
- There is a lengthy ascending movement of the quotes.
- The pattern forms at the resistance level.
- The three candlesticks are of roughly the same size.
- Three candlesticks successively forming on a smaller timeframe, form one big Engulfing candlestick on a larger one.
- Each next candlestick opens at the close level of the previous one or a bit higher.
- Shadows of the candlesticks are relatively small or totally lacking.
How to open a position by Three Black Crows
- After the third (descending) candlestick closes, open a selling position (Market Order) by the current price.
- Place a Stop Loss behind the nearest high.
- Place a Take Profit in 1:3 relation to the Stop Loss.
- Later the TP can be moved lower, to the technical support levels, in order to increase the profit. The SL can be moved to the positive sector to minimize risks.


Advantages and drawbacks of 3 Black Crows Pattern
Advantages:
- The pattern demonstrates a trend reversal, specifically – an uptrend changing for a downtrend.
- It allows selling at the top of the trend.
- It does not need other indicators.
Drawbacks:
- It is a rare occasion on the chart.
- It is most efficient on TFs larger than H4.
- It takes a long time to form.
- On daily TFs, the SL can exceed admissible risks.
Examples of using Three Black Crows Candlestick
This pattern can be used both alongside other means of analysis and on its own. Indicators act as additional filters that enhance trade efficacy.
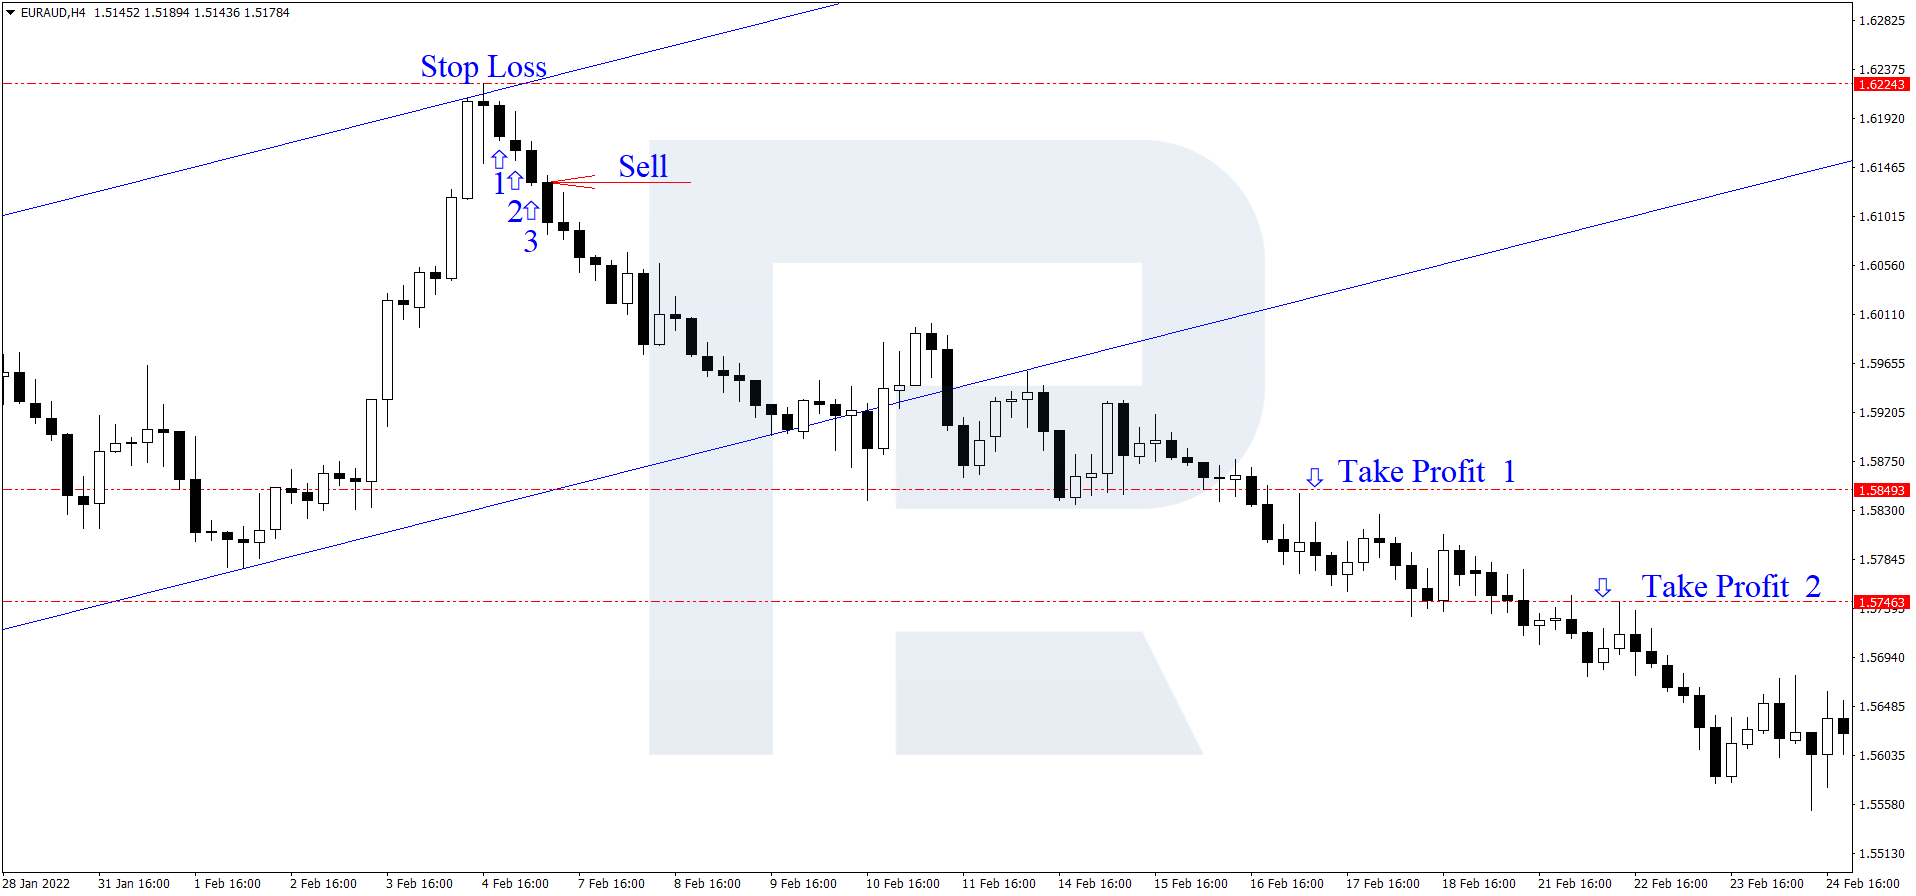
Example of selling by the pattern without indicators
- On the EUR/AUD chart, there has formed a Hanging Man.
- After that, at the top of the uptrend, there formed 3 Black Crows candlestick pattern.
- When the third candlestick closes, open a selling position at the fourth candlestick.
- Stop Loss is to be placed at the nearest high.
- Place the TP as 1:3 against the SL. In this case, the SL is 900 points and the TP 1, accordingly – 2,700 points.
- Later, when the price approaches the TP 1, the trader can place a TP 2 at the next support level.
- The trader can monitor the position and move the SL to the positive zone when necessary.
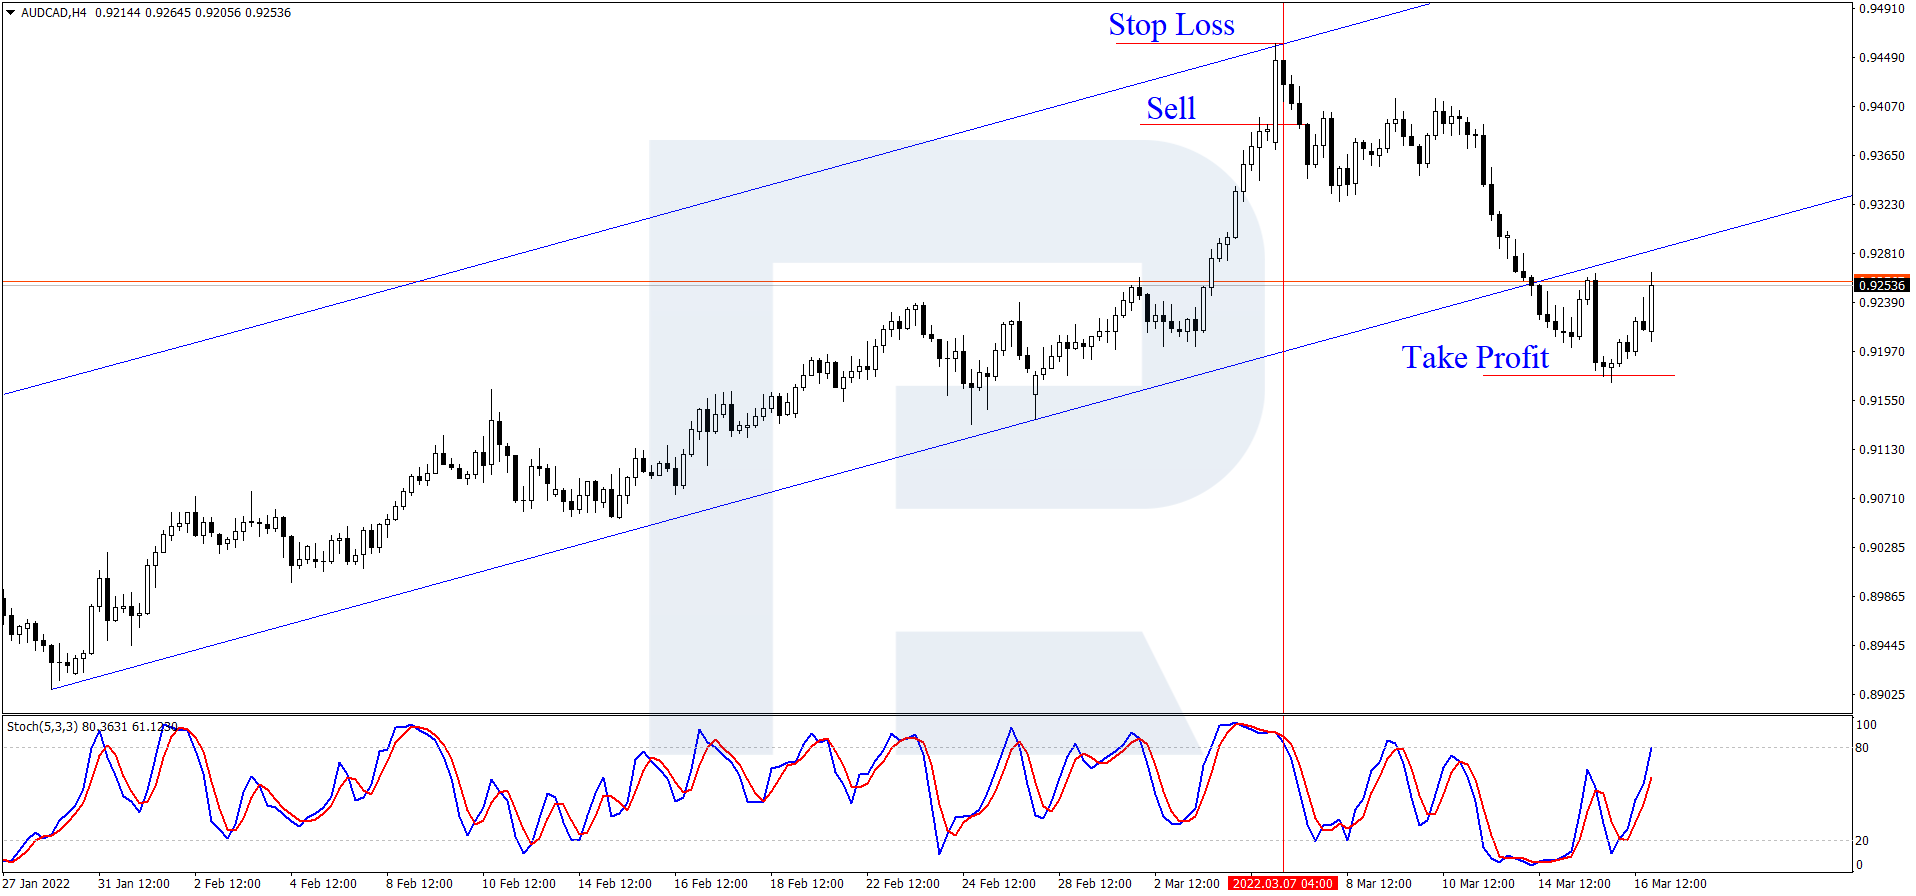
Example of selling by the pattern and one indicator
Here, the popular Stochastic Oscillator with basic settings is used.
- On H4 of AUD/CAD, Three Black Crows formed.
- The Stochastic is in the overbought area, confirming the reversal of the uptrend.
- Then the indicator crosses the level of 80 from above, selling an additional reversal signal.
- When the third candlestick from the pattern closes, open a selling position.
- Place an SL at the high and a TP as 1:3 with the SL.
On the chart below, the quotes reached the potential TP level. The position could have been closed at that moment. Otherwise the trader had to wait because the price started correcting.


Selling by the pattern and several indicators
Here, the Stochastic Oscillator and MACD with basic settings are used.
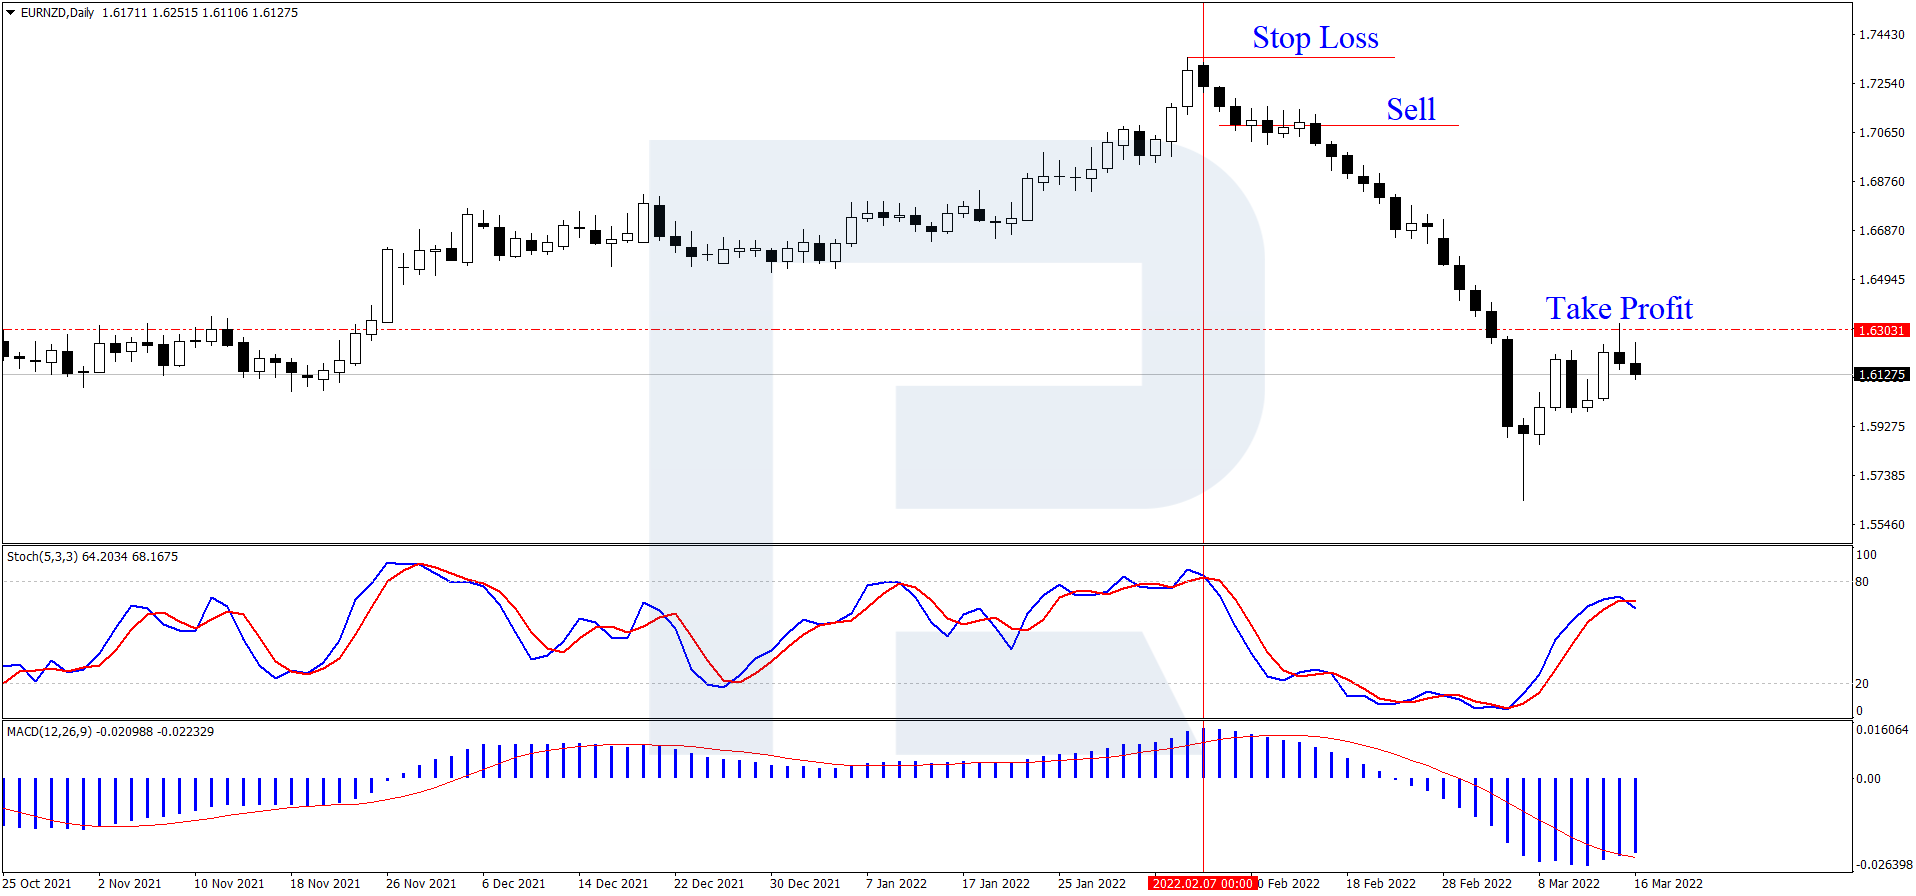
- On D1 of EUR/NZD at the resistance level the first candlestick of the Three Black Crows reversal pattern formed.
- The Stochastic is in the overbought are, crossing the level of 80 from above, which means the current trend is changing.
- Then the Three Black Crows pattern forms completely.
- Then the MACD confirms selling by an escape of the signal line from the histogram area. On D1, this signal will take several days to form.
- The SL is placed behind the high at about 2,600 points.
- The TP is still 1:3 against the SL, reaching roughly 7,800.
On the chart below, the price reached the target TP level and began a correction.
Bottom line
Before using Three Black Crows, the trader needs to study all of its conditions and peculiarities. The strategy is t be tested alongside other means of market analysis. For example, a trader can try out those indicators they are used to. This will help filter signals from Three Black Crows pattern.