How to Trade by Antitrend Strategy

5 minutes for reading
Not all traders like to trade the trend: there are deep corrections able to kick even a most patient investor out of the market. When trading against the trend, the results of a trade take much less time to wait for. And if the trader masters catching reversals, risks will also be small.
A trading strategy called the Antitrend strategy allows looking for such signals in stock indices. For successful work, only one indicator is needed, set up especially for the DE40 index, the most important stock index in Germany.
The article explains how to trade with the Antitrend strategy with a use of the Bulls Power indicator, what peculiarities selling and buying trades have, and how Stop Loss and Take Profit can be placed.
What Antitrend strategy is like
By the Antitrend strategy, trading occurs on H4. Signals will be few but quite noticeable – on smaller timeframes, the number of false signals is overwhelming.
The strategy is based on using a not-so-popular indicator Bulls Power with a standard period. The instrument calculated the difference between an Exponential Moving Average with period 13 and the high of the price.
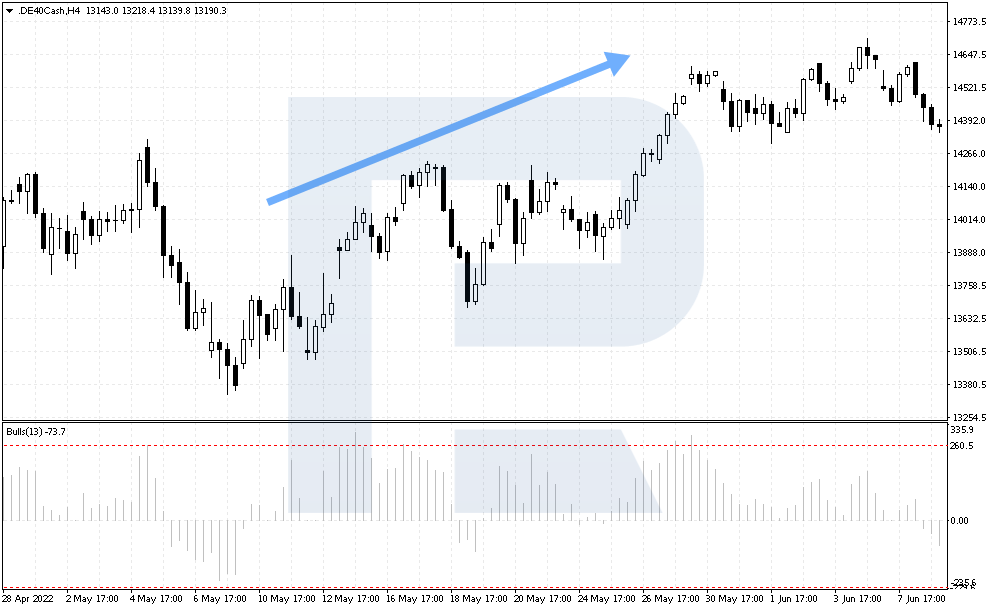
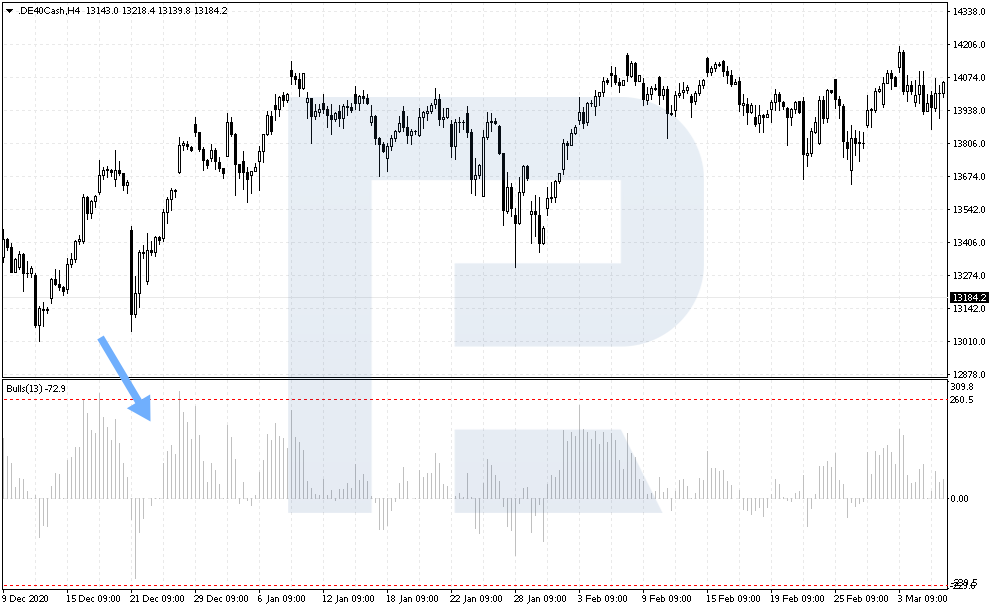
If the trend is bullish, the bars of the indicator are above zero, growing. This means buyers are strong, they have enough power to renew highs. And if the trend is bearish, indicator values drop below zero and are declining, demonstrating bearish pressure.
It is recommended to enter a trade only when Bulls Power reaches certain levels. For buying and selling, these levels are different. This tactics is applicable to all global indices but the levels are designed for the DE40 index.


How to set up indicator for Antitrend strategy
You can add Bulls Power to a MetaTrader 4 chart the following way:
Insert – Indicators – Oscillators – Bulls Power
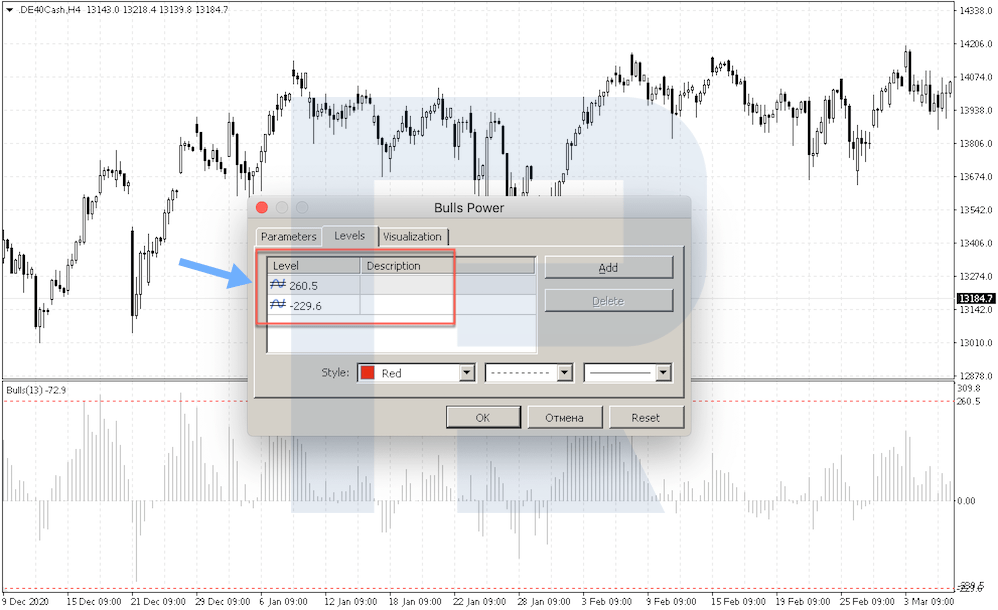
To set up the levels, open settings, go to Levels, and add there 260.5 and -229.6.
How to buy by Antitrend strategy
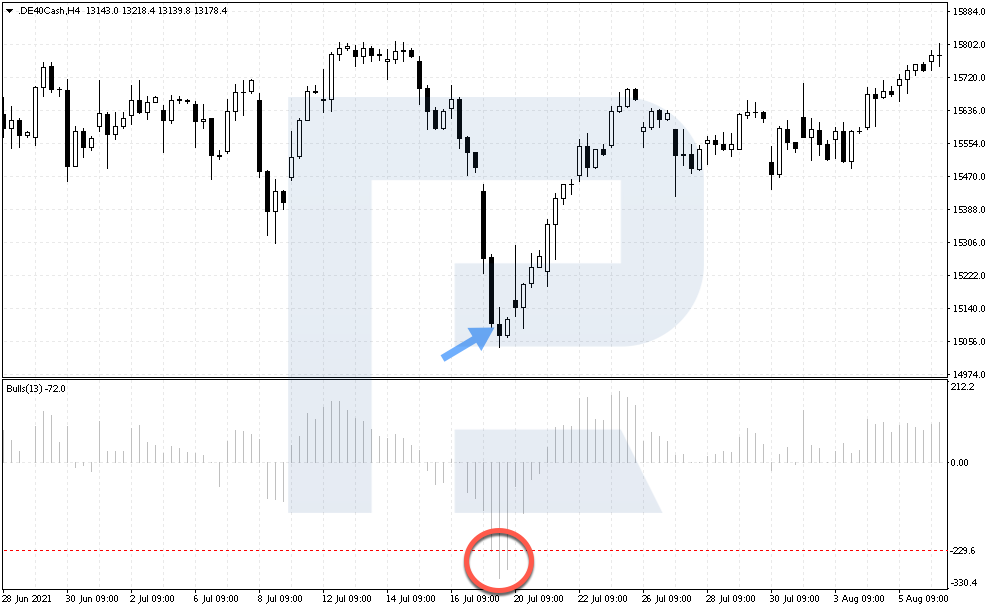
1. Bulls Power values drop below -229.6. Note that this is quite a hard level to reach, so signals will take long to appear.
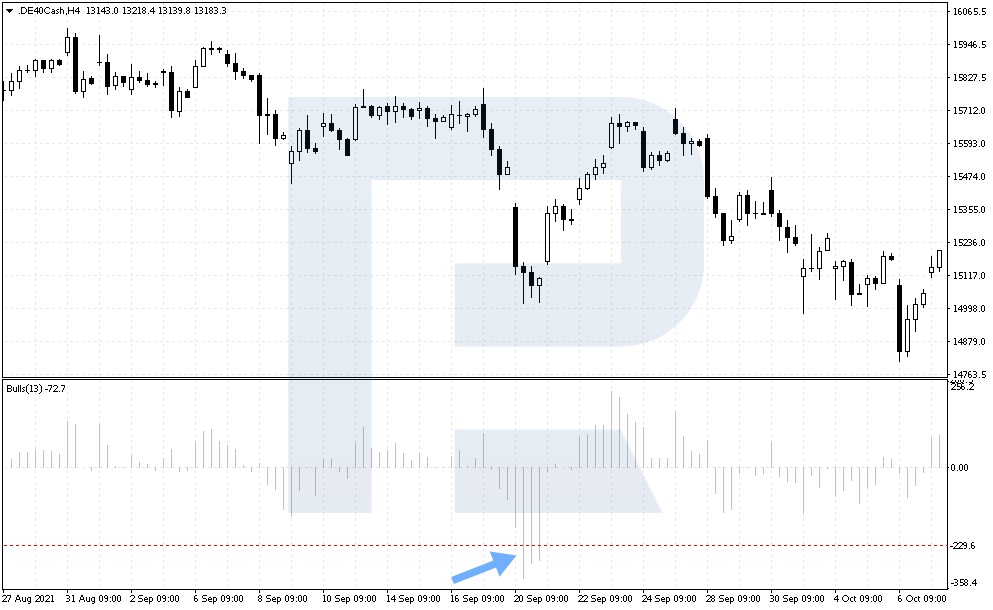
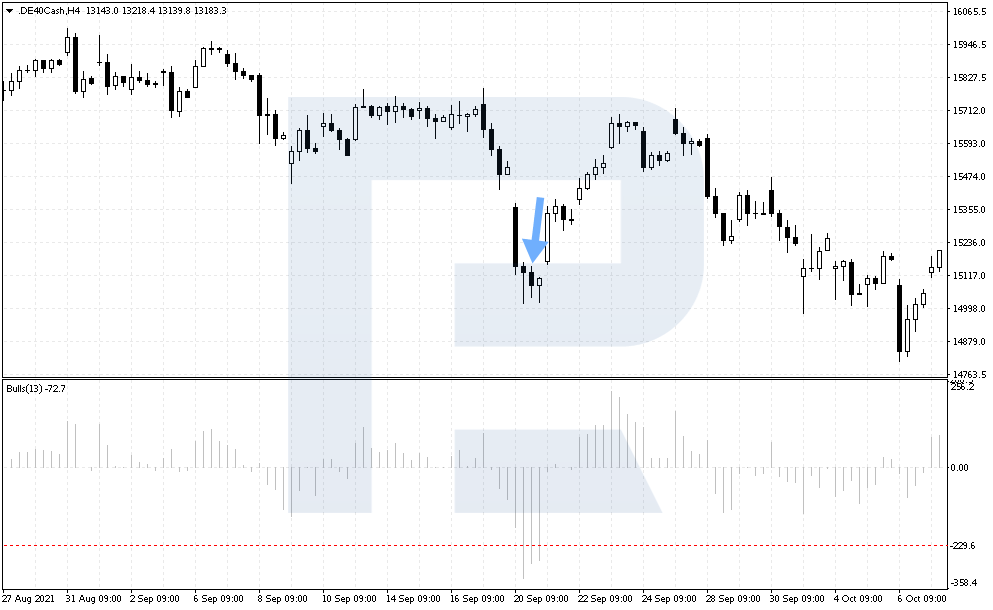
2. A signal to buy forms when the indicator reaches -229.6. The trade is opened by the open price of the next candlestick.
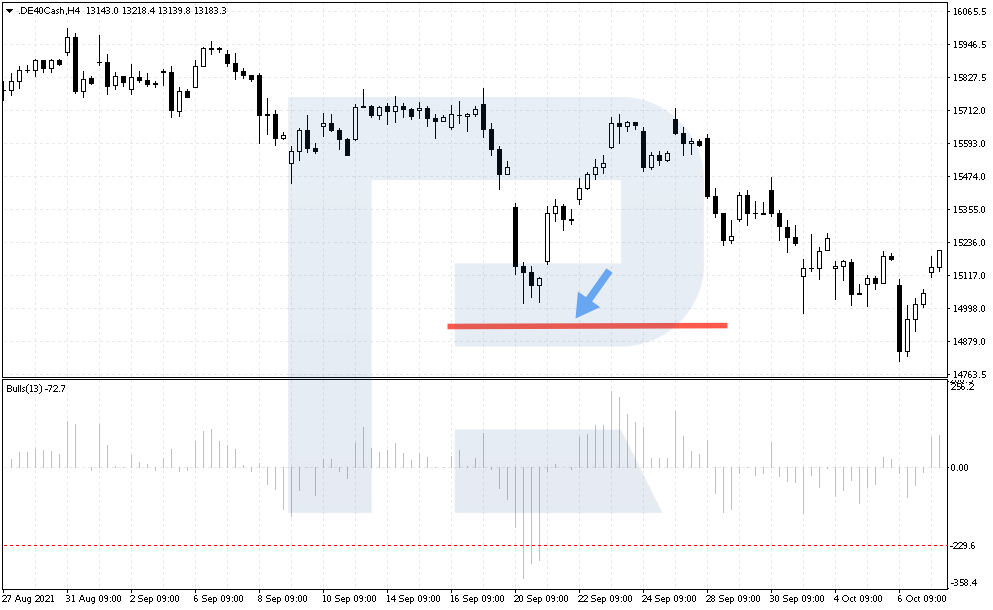
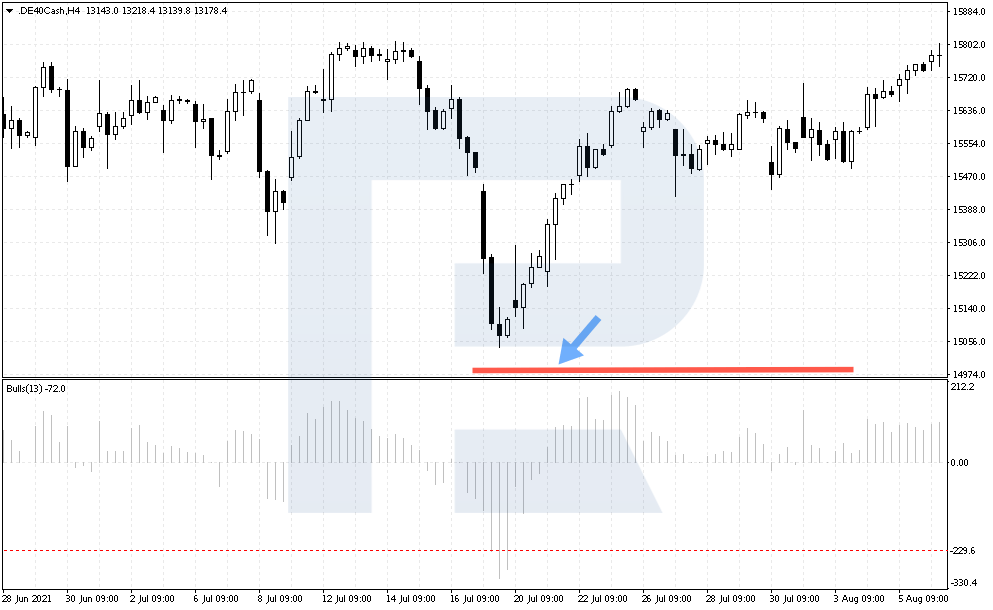
3. A Stop Loss is placed 1,500 points below the entry point. Such a size is mentioned because the price does not reverse at once: it may go on declining before it potentially reverses. Hence, we need to have some room for maneuvering.
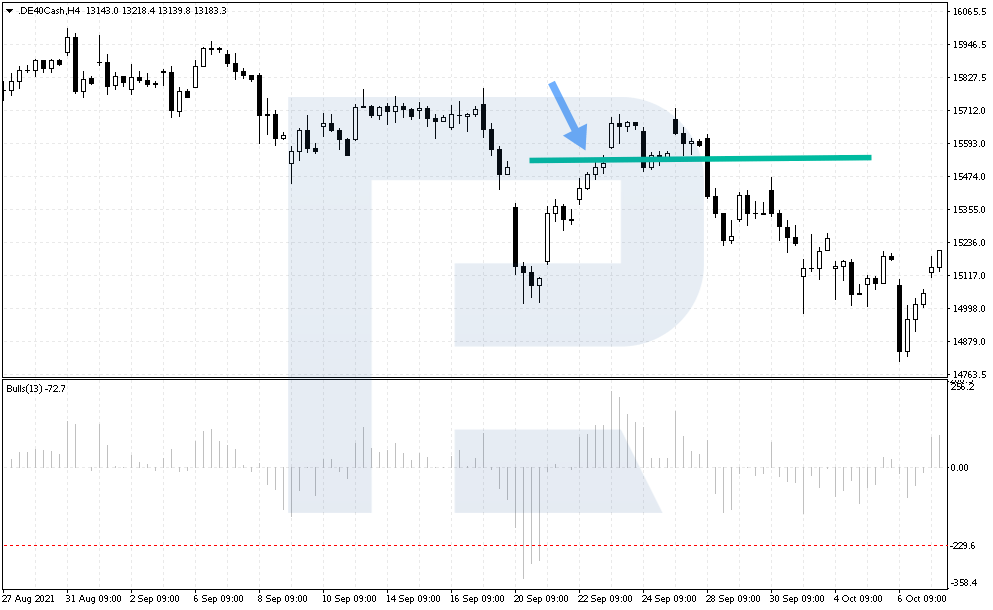
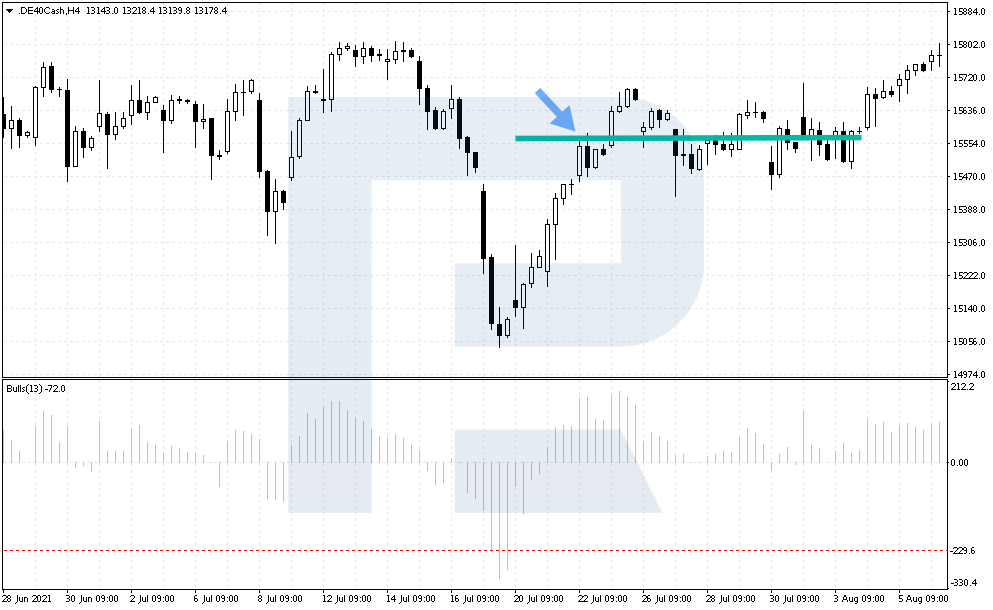
4. A Take Profit is placed 4,500 points above the buy point. The profit-to-risk ratio is 3 to 1, which is good and goes by the rules of risk management. Along with the price going up, the SL can be moved to the entry point, so that you could wait for major movements, or you can opt for a floating SL.
Example of buying by Antitrend strategy
Look at the DE40 chart for 19 July 2021. The price had long been in a flat previously. At a certain point, it dropped significantly. The Bulls Power values reached -229.6 when an H4 candlestick formed. At the opening of the next candlestick at 5 p.m. a buying trade could be opened for 15100.6.
The SL was at 14 950.6. The price did not head up at once, dropping by more than 580 points before it started growing.
The TP was at 15 550.6. The price reached this level in 34 hours. Maximum movement upwards was 5,900 points, so a floating SL was quite a reasonable decision.


How to sell by Antitrend strategy
1. Bulls Power values rise above 260.5. Regardless of lengthy bullish trends, such signals on the indicator will be scarce. However, this peculiarity of the DE40 makes the indicator rest above 260.5 for some time before it starts falling.
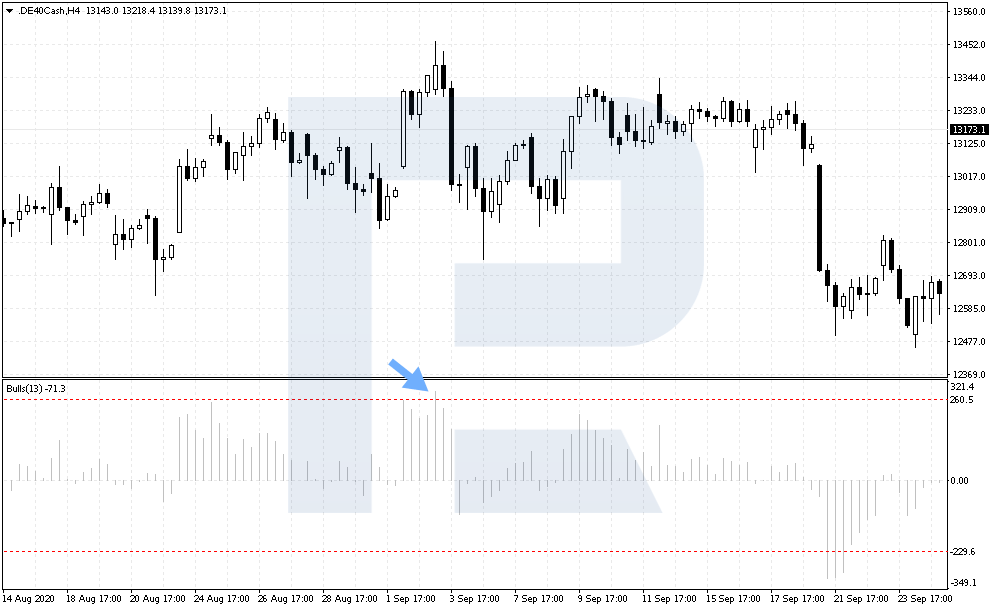
2. A signal to sell forms when the indicator reaches 260.5. A trade is opened by the open prie of the next candlestick.
3. Stop Loss is placed 1,500 points above the entry point.
4. Take Profit is placed 4,500 points below the selling point. It is recommended to use the very first opportunity to move the SL to the entry point and wait for an even bigger profit.
Example of selling by Antitrend strategy
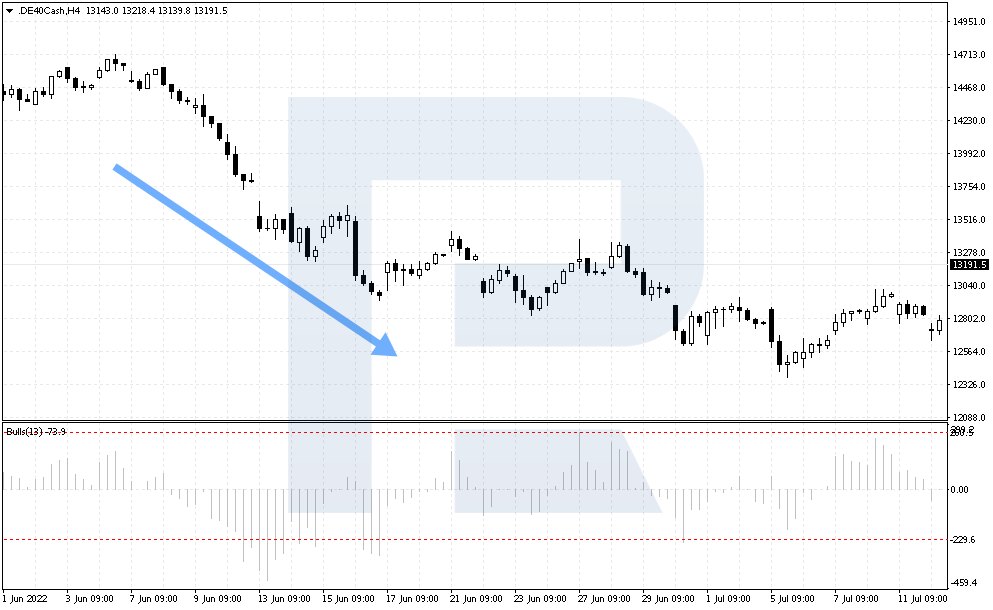
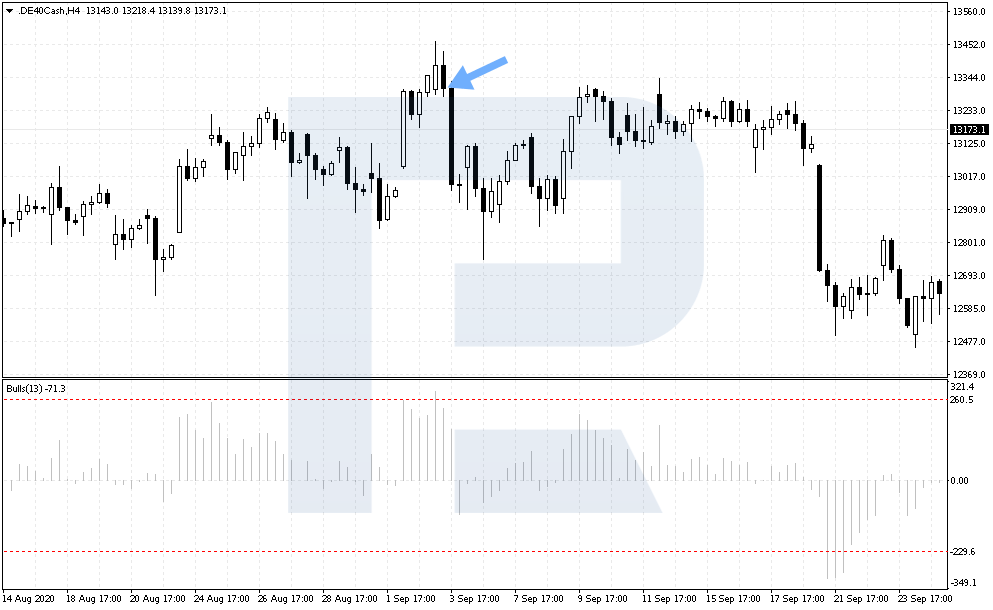
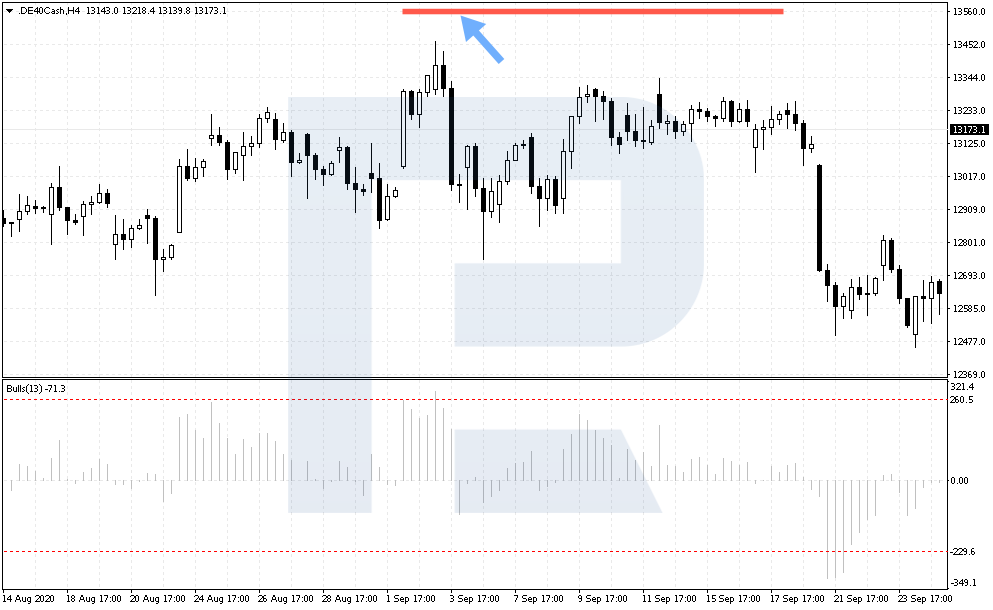
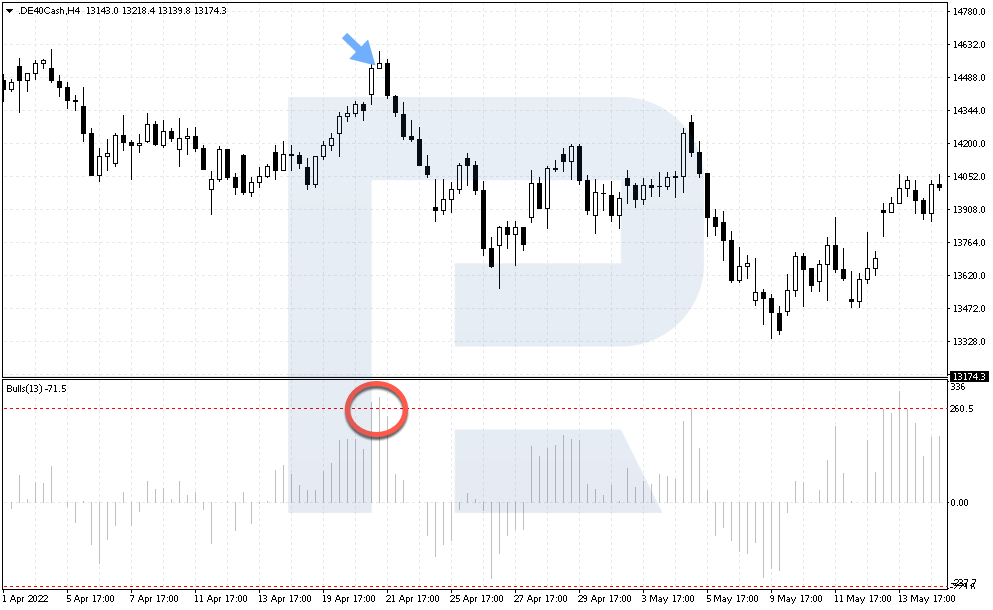
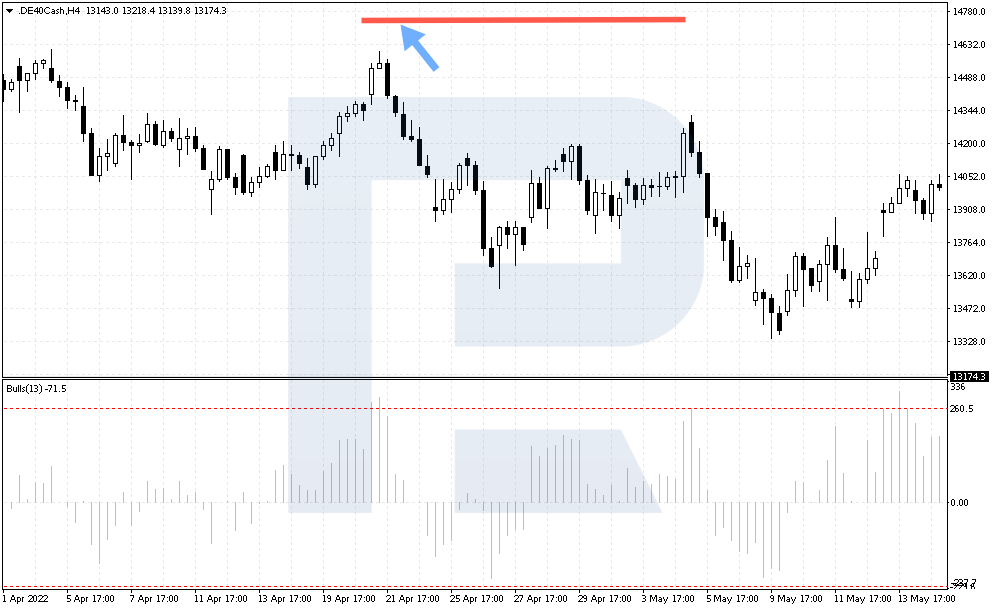
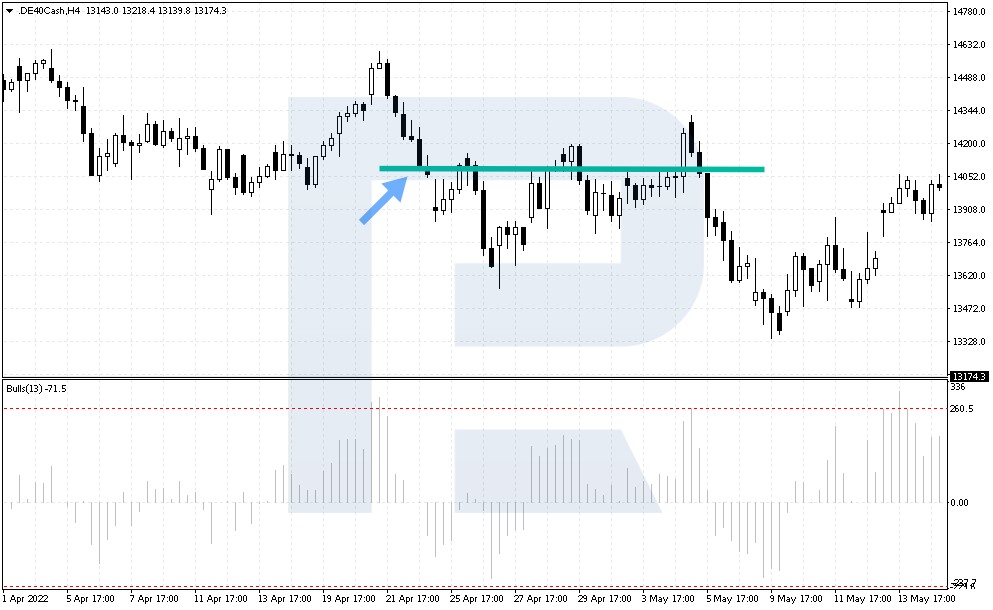
Look at the DE40 chart on 21 April 2022. The price kept pushing off the support level for some time, but later it grew significantly, breaking through the resistance area. Bulls Power values reached 260.5. When the next H4 candlestick opened at 1 p.m., a selling trade for 14 528.7 could be opened.
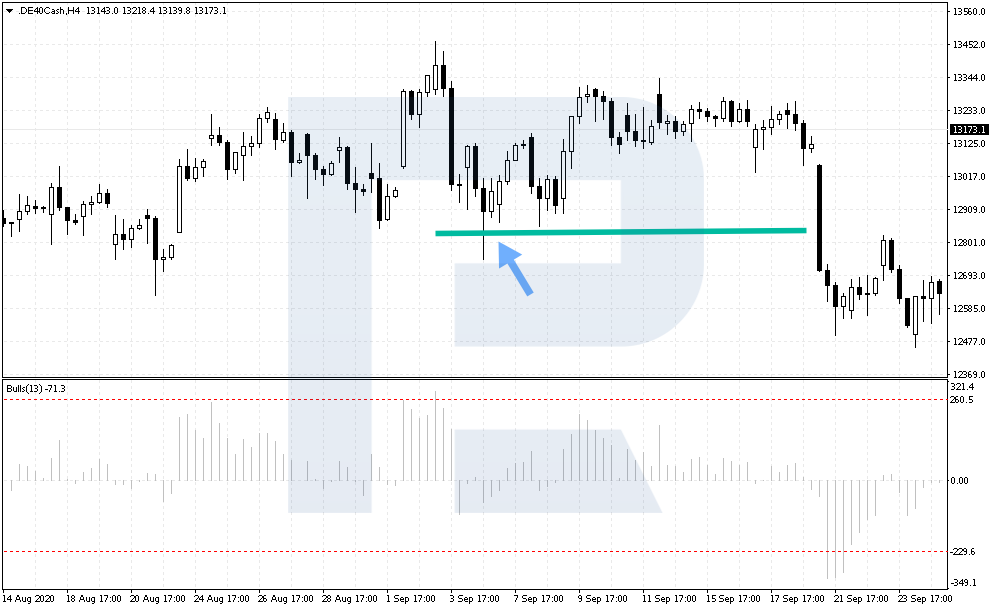
The SL was at 14 678.7. The price did not go down at once but rose by over 780 before it actually started falling.
The TP was at 14 078.7. The price reached the goal on the next day already. However, the decline of the index amounted to 9,600 points, so a floating SL would be a wiser solution for such a case.
Closing thoughts
The Antitrend strategy is meant for trading the DE40 stock index at strong impulses on an H4 chart. Signals will be few because levels for the Bulls Power indicator are extreme, and the timeframe is large.
However, this is more like an advantage for traders who do not want to enter the market frequently: they will be free of spending a lot of time before charts, constantly analysing price movements.
The rules for the strategy are extremely simple, and risk management is efficient because the profit-to-risk ratio is 3 to 1. Hence, such tactics can be used as an option for additional earnings.


