How to Trade the GBP/JPY Strategy Using the Bollinger Bands

6 minutes for reading
Today we will look at a short-term trading strategy based on the Bollinger Bands indicator with different timeframes. It is designed to work with the currency pair GBP/JPY on the M1 chart.
GBP/JPY is a highly volatile instrument, and the technical indicator will indicate instants when the price diverges significantly from its average fluctuation and there is a high probability of a move in the opposite direction.
How to trade GBP/JPY with the Bollinger Bands strategy

We will show you how to use Bollinger Bands signals with three different deviation values. We will look at the position opening and discuss the Stop Loss and Take Profit rules according to the strategy.
Bollinger Bands in brief
Bollinger Bands is designed as a trend indicator, and it can show not only the direction of the current trend but also estimate volatility. It has three lines: a simple moving average with a period of 20 is positioned in the middle, while two other lines are positioned above and below, estimating maximum and minimum values. The extreme lines act as a floating support and resistance levels.
According to the author of Bollinger Bands, prices spend 95% of the time in the area between the bands of the indicator. Therefore, any price move out of this corridor can be seen as a reversal possibility and an imminent return of prices to average values.
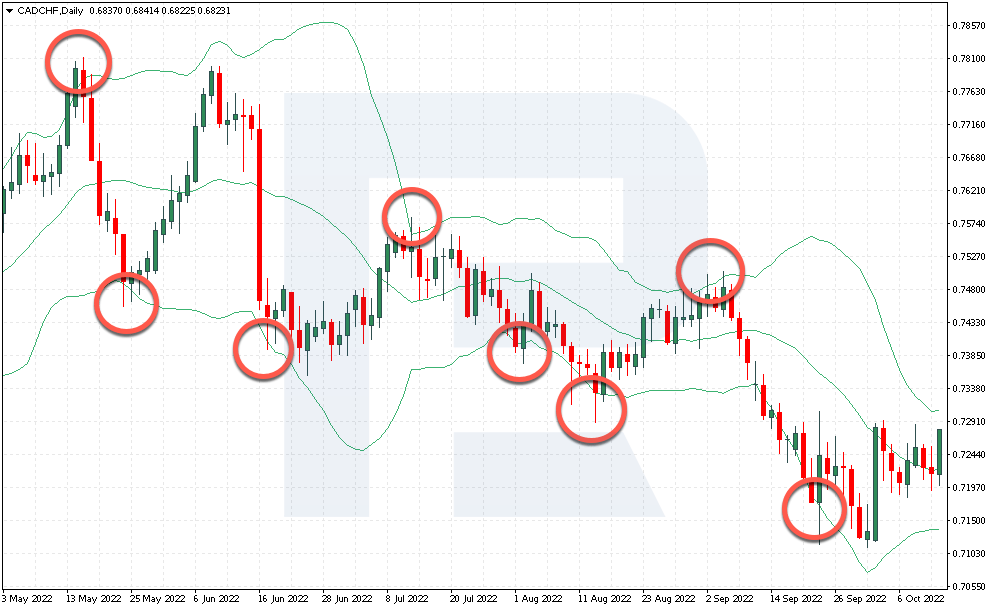
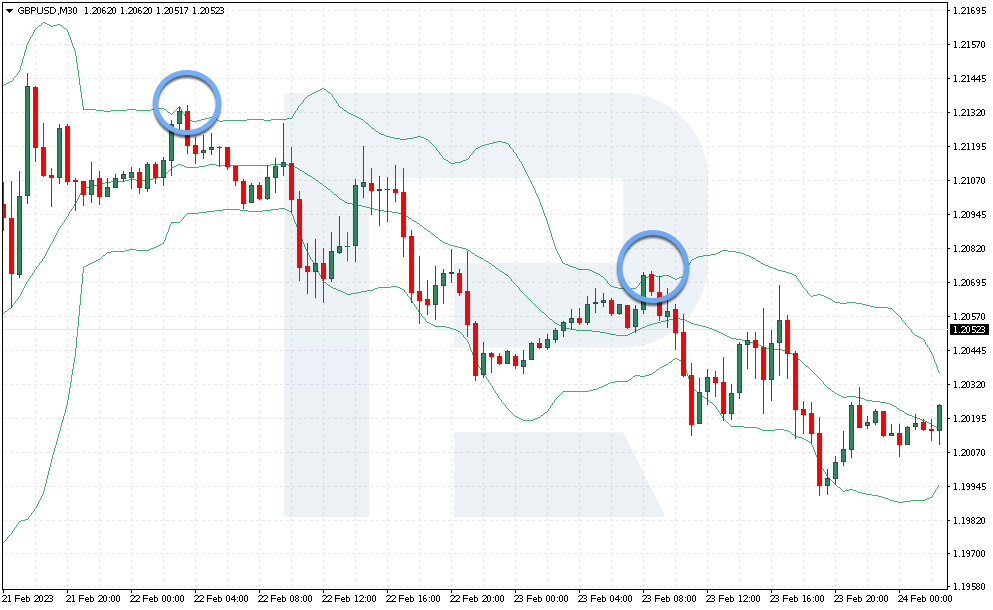
The behaviour of Bollinger Bands during strong market trends is also interesting. As a rule, in an uptrend, an investor wants to buy at the lowest price. In this case, one should expect the price to test the lower boundary of the indicator. In a downtrend, the investor wants to sell at the maximum price. In this case, the price is expected to test the upper boundary of the indicator.
How to set up Bollinger Bands
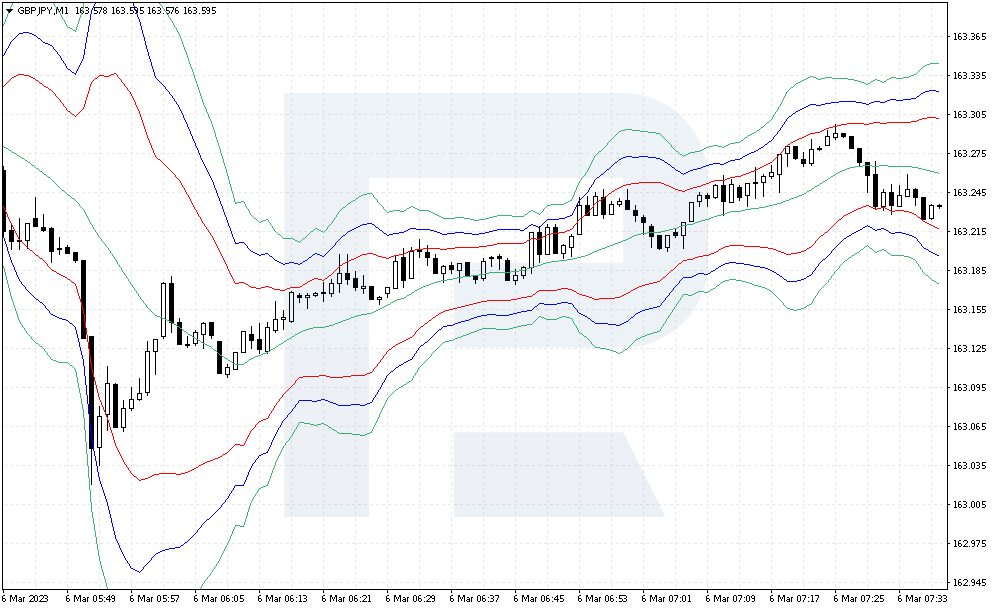
Add the Bollinger Bands indicator to the chart. To set the drawing period and colour of lines, double left-click on the indicator in the chart or right-click once and select "Properties" in the menu that appears. Then change the colour of the lines and the deviation value in the opened settings window.
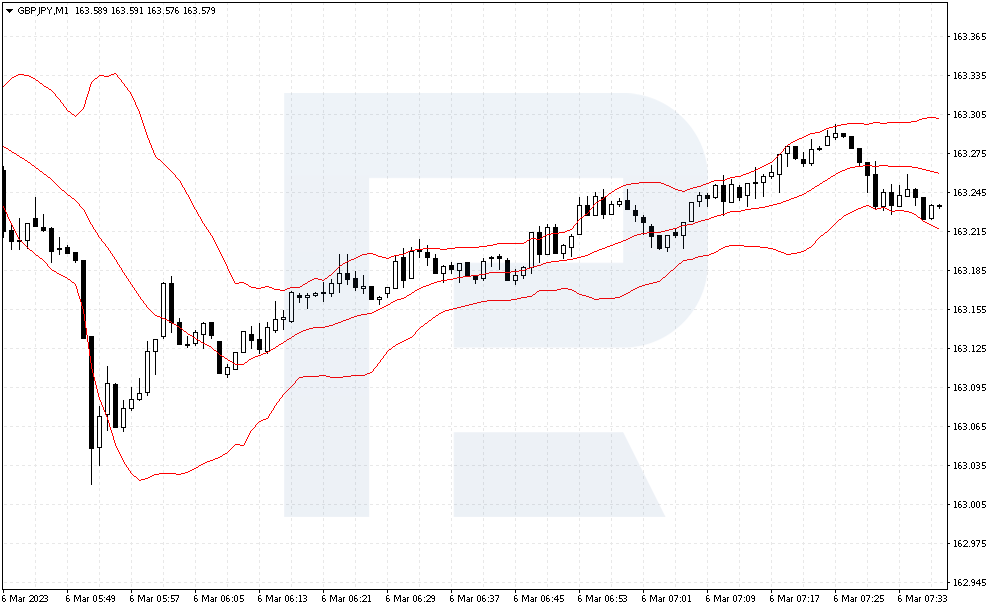
- Bollinger Bands with deviation 2 - select the red colour of the lines. Extreme lines of the indicator characterise the nearest support and resistance levels. According to the author of the indicator, the price very rarely moves beyond these lines
- Bollinger Bands with deviation 3 - choose the blue colour of the lines. According to the author of the indicator, price moves beyond these lines are even rarer
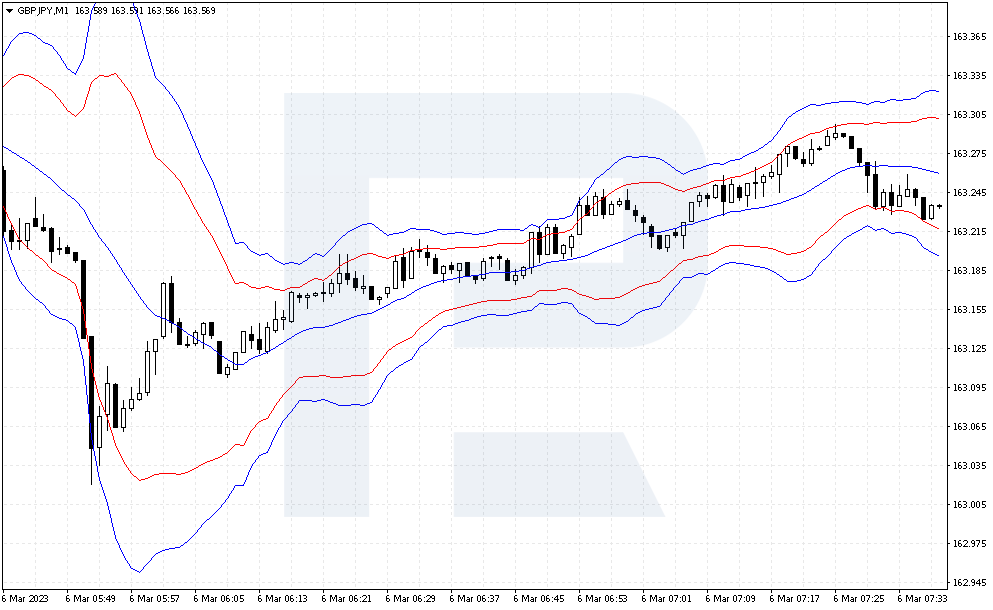
- Bollinger Bands with deviation 4 - choose the green colour of the lines. According to the author of the indicator, the price will reach these lines as rarely as possible, only at moments of peak volatility in the market
How to buy GBP/JPY using the Bollinger Bands strategy
- On the M1 chart, the price is testing the lower red indicator line or is positioned between the red and blue lower lines
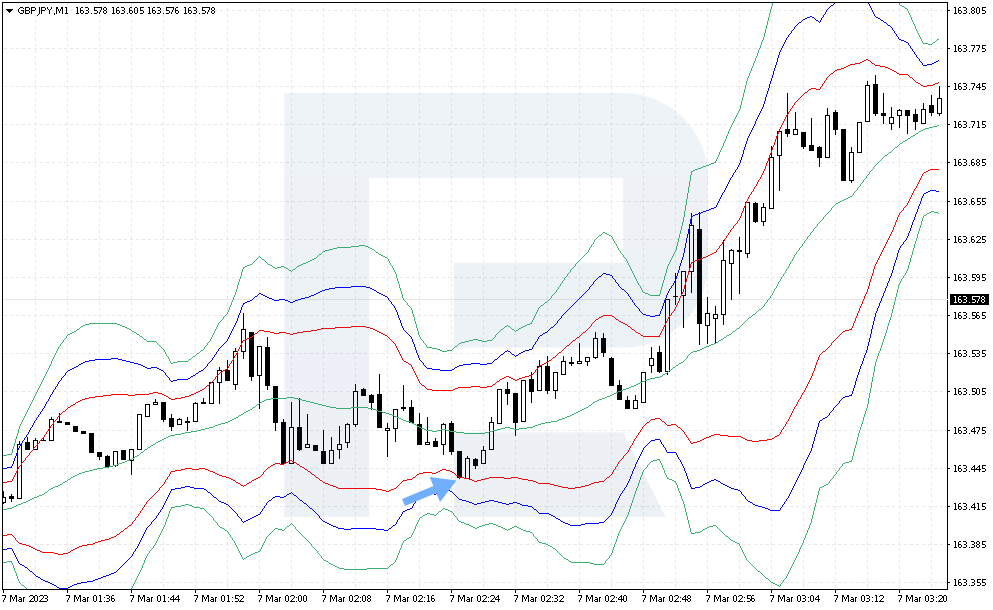
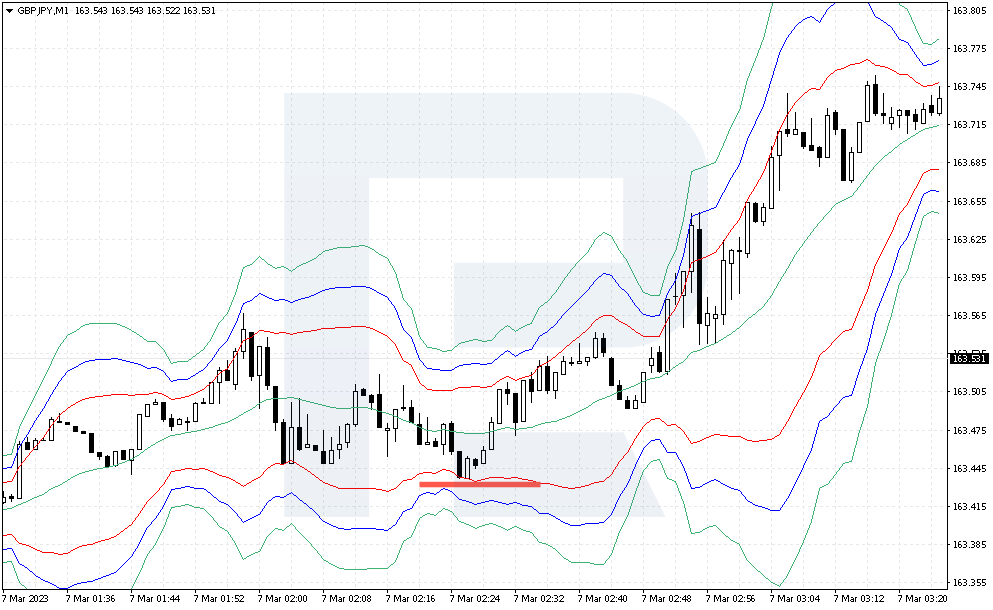
- A Stop Loss can be set 2 points below the low of the previous candlestick on which you are buying
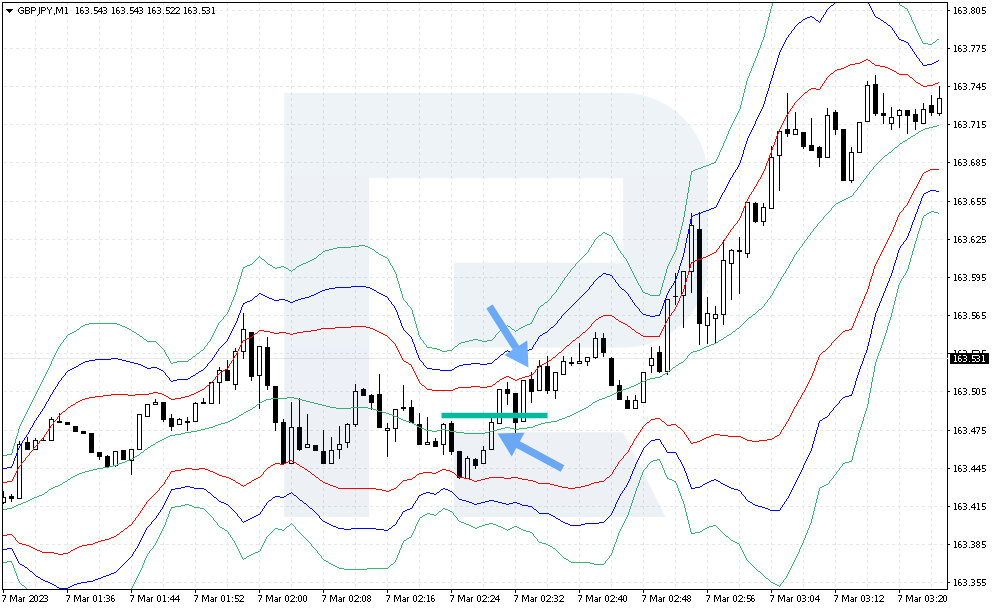
- Take Profit can be set 15 points above the market entry point. Another option for setting Take Profit: you can use the Bollinger Bands indicator lines to determine the targets for the signal. For example, the first target is the middle green line of the indicator, and the second is the upper red line
Example of buying GBP/JPY using the strategy
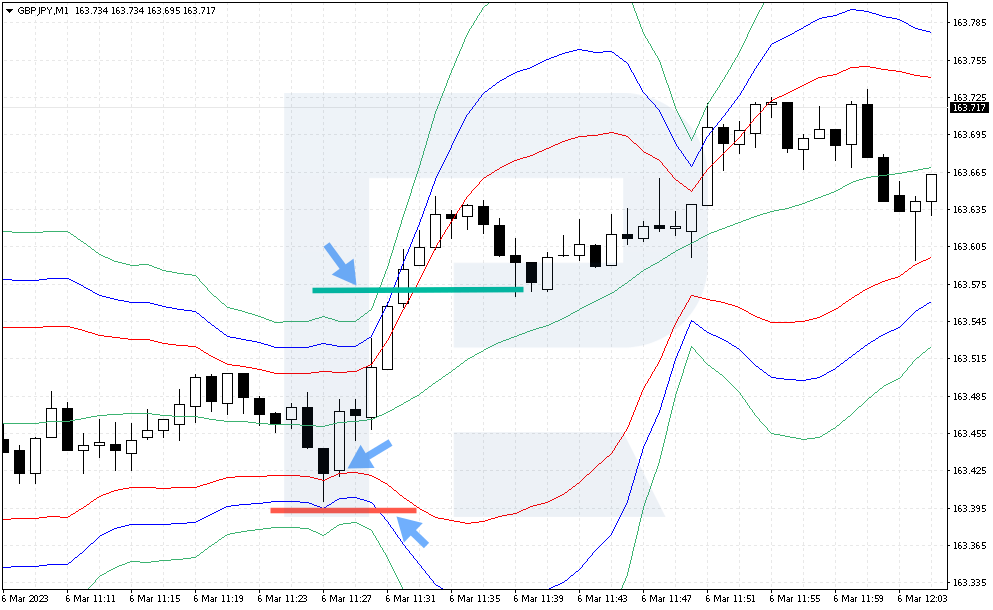
On 6 February 2023, the GBP/JPY currency pair chart showed a correction in a narrow range. The price then broke through the lower red line, which was a signal to open a long position. It was possible to buy at the opening of a new candlestick.
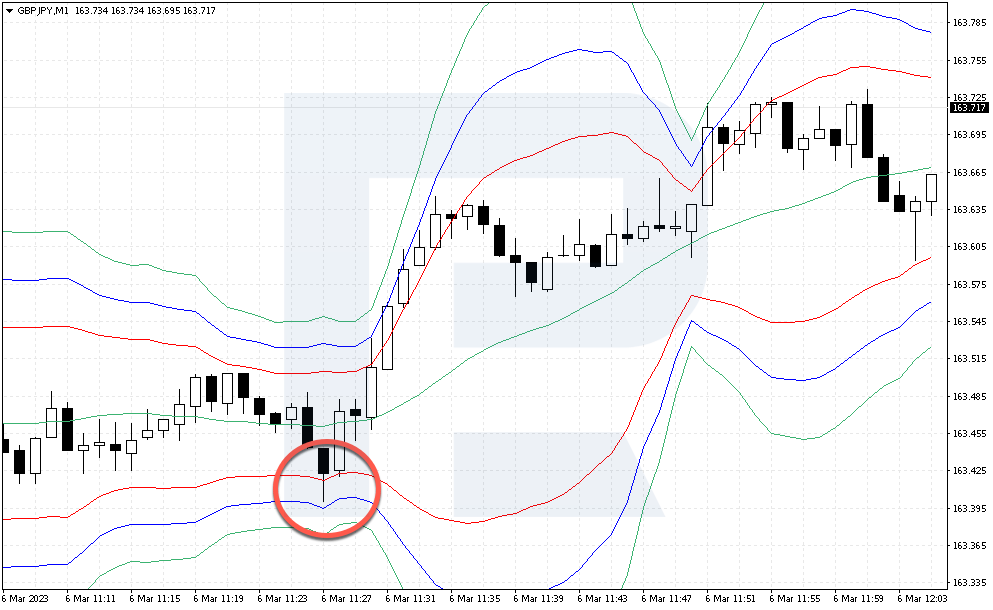
The buy order was opened at the price of 163.42. Stop Loss was placed at 163.38, below the previous candlestick's low by 2 points, and the risk reached 4 points. Take Profit was set 15 points above the entry point, at 163.57. The price reached this target within 4 minutes.
- On the M1 chart, the price is testing the upper red line of the indicator or is positioned between the upper red or blue lines
- A Stop Loss can be set 2 points above the high of the previous candlestick on which the sale is opened
- Take Profit can be set 15 points below the market entry point. One more variant of Take Profit: we use indicator lines to determine the targets for the signal. For example, the first target is the middle green line of the indicator, and the second is the bottom red line
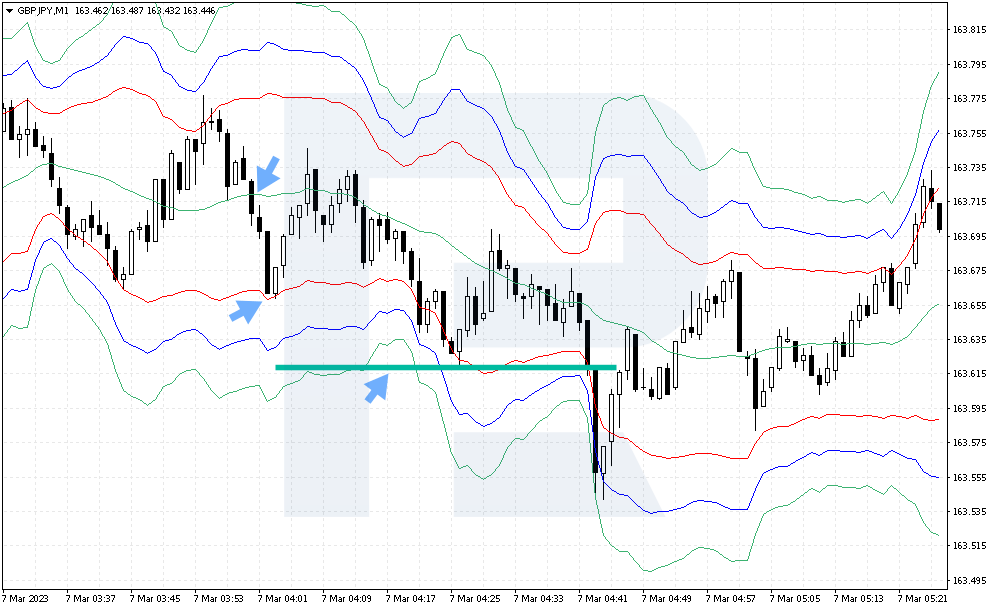
Example of selling GBP/JPY by strategy
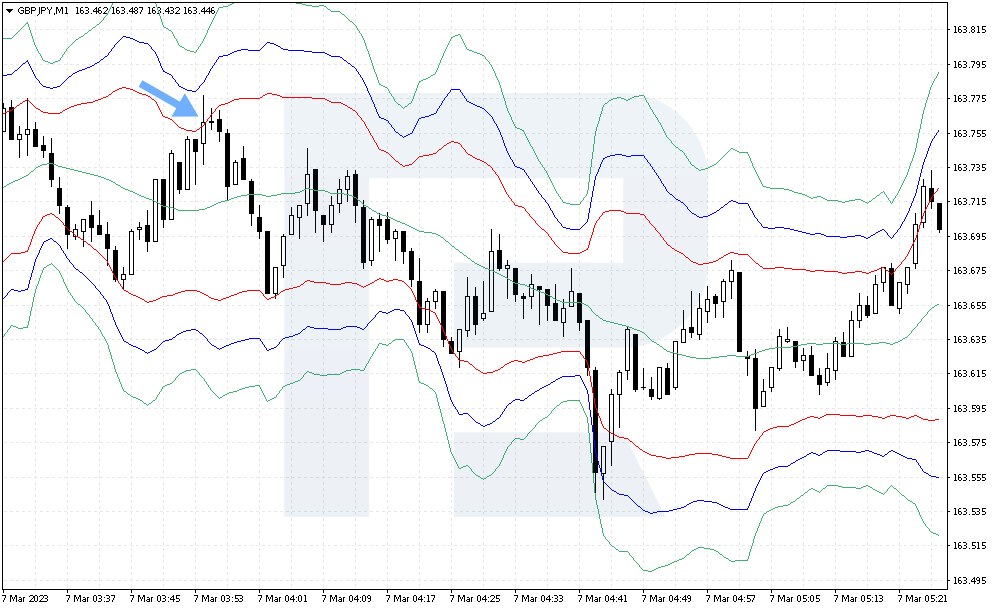
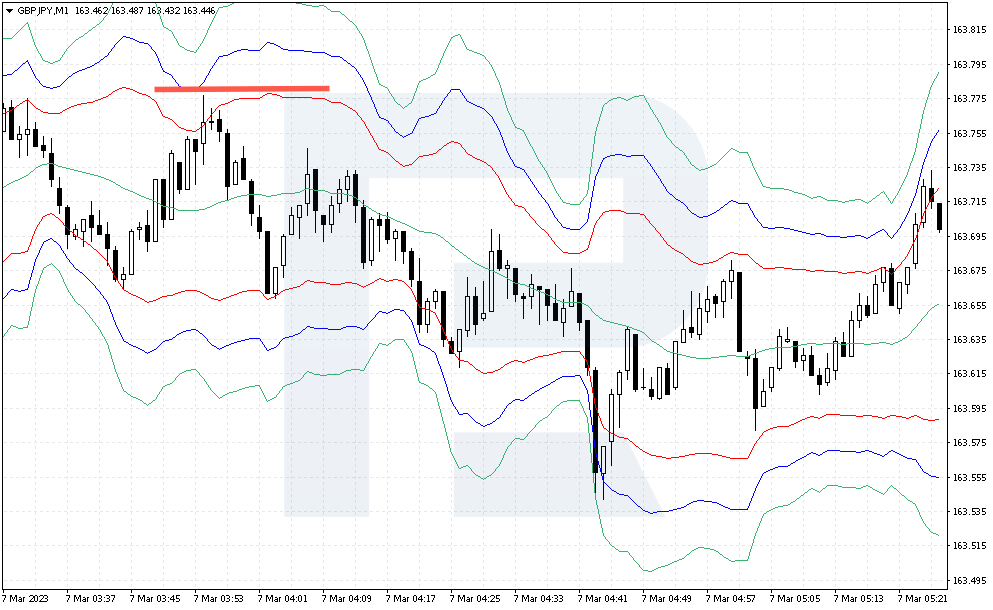
On 6 February 2023, after the growth recorded on the GBP/JPY currency pair chart, the price broke through the upper red line. This was a signal to open a short position. It was possible to sell at the opening of a new candlestick.
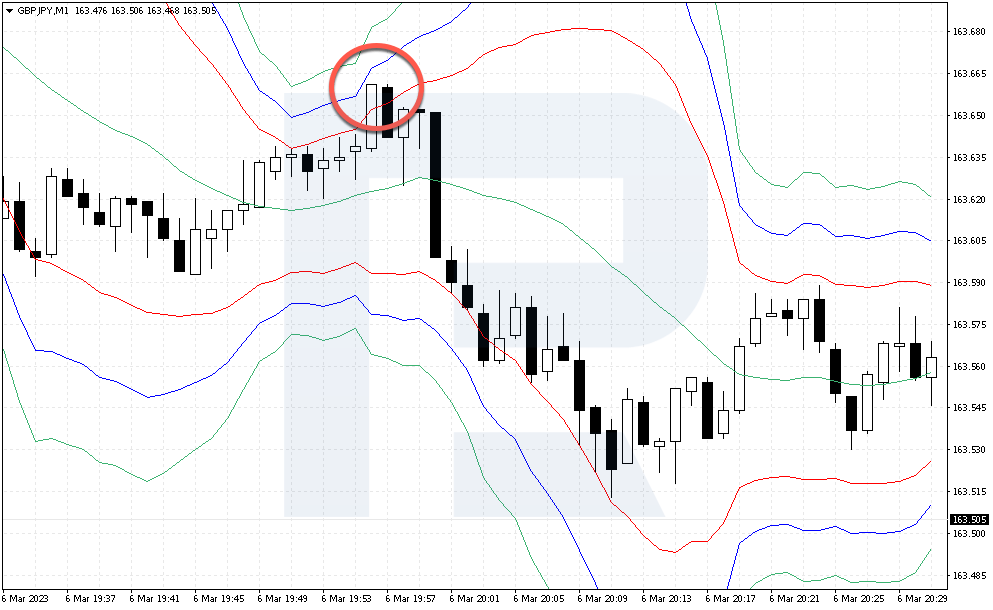
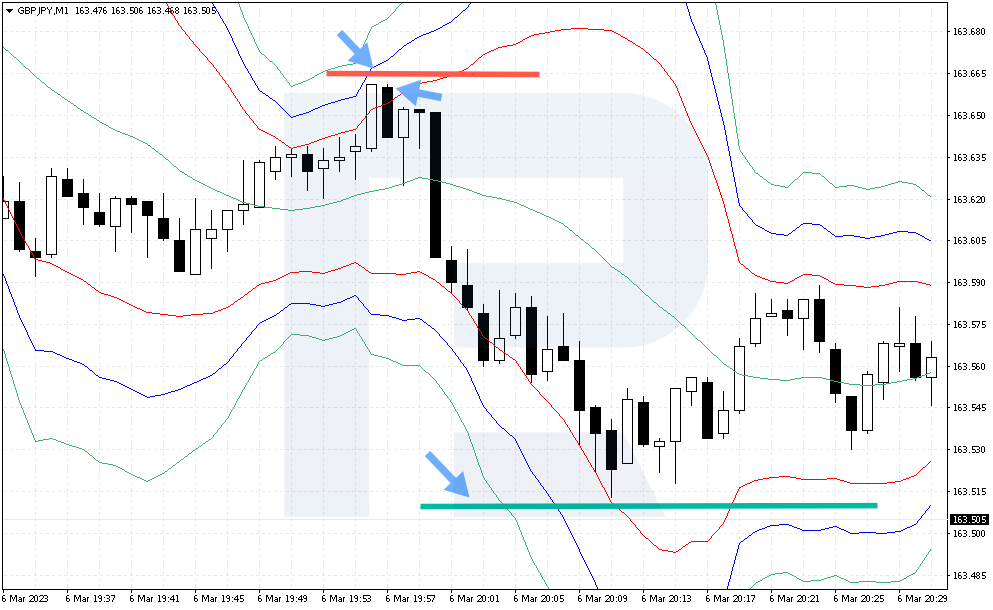
The sell trade was opened at the price of 163.66. Stop Loss was set 2 points above the previous candlestick's maximum, at the level of 163.68, the risk reached 2 points. Take Profit was set 15 points below the entry point at 163.51. The price approached this target in 14 minutes, but then it reversed upwards.
Conclusion
A scalping strategy based on the Bollinger Bands indicator for the GBP/JPY currency pair is a simple variant of trading on the M1 chart with clear rules. The trader focuses on extreme deviations of the price from the average values and opens deals only at these levels. The strategy has thought-out ways of setting Stop Loss and Take Profit, which can be changed slightly to increase the level of performance.
One disadvantage of this approach is that it does not work towards the prevailing trend, but simply from the levels on the indicator. It might be worth considering adding a Moving Average to determine the direction of the trend, and only work towards the main trend.


