How to Trade the Kicker Candlestick Pattern

5 minutes for reading
In this review, we will get acquainted with a rather rare reversal candlestick pattern called Kicker. We will consider the features of its formation and the rules of trading with it.
How a Kicker candlestick pattern is formed
The Kicker candlestick pattern is not often seen on price charts and portends a reversal of the current trend, showing a sudden change in market sentiment. It is usually caused by important or unexpected news related to an asset.
A pattern consists of two candles of different colours: if the first is white, the second is black, and vice versa. The size of the body of the candles does not particularly matter. The body of the first candle follows the direction of the current trend, and the second candle opens with a gap from the opening price of the first candle and closes in the opposite direction.
The peculiarity of this pattern is that the second candle opens immediately with a large gap against the direction of the trend. If the first candle of the pattern is "bearish", the gap widens, and a white candle appears; if the first candle is "bullish", the gap shrinks, and a black candle follows. The gap covers the whole body of the first candle and forms a gap with its opening price.
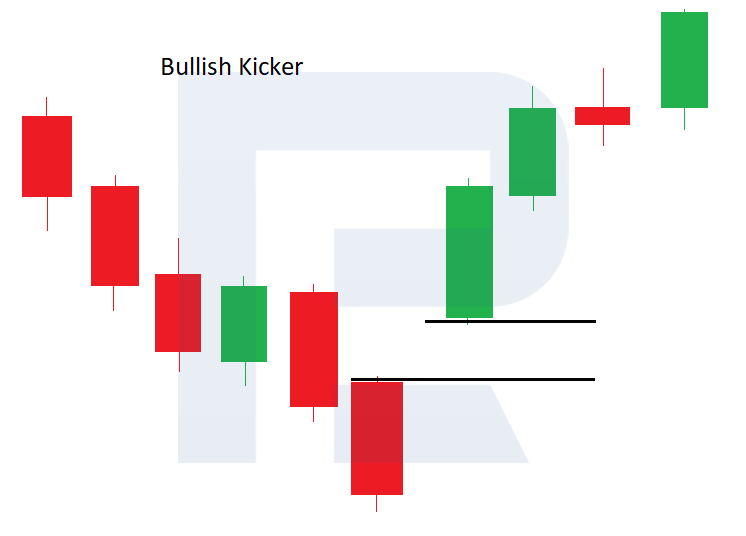
A bullish Kicker candlestick pattern
This forms on the price chart during a downtrend when there is an active downward price movement and local lows are formed. First, the first black candle of the pattern appears, then the second candle opens with a large gap upwards and closes in white, showing growth. The "bears" were moving the market down, confident in their strength, but unexpected positive news strongly influenced market participants, and the situation changed dramatically. Now, the "bulls" have taken the initiative.
Thus, a bullish candlestick pattern Kicker has been formed on the chart. It is fully formed after the closing of the second candle with a white body, and it is assumed that the bulls, having received unexpected support and going on the offensive, will continue to move the price upwards. Thus, we can expect a severe upward correction or even a reversal and the start of a bullish trend.
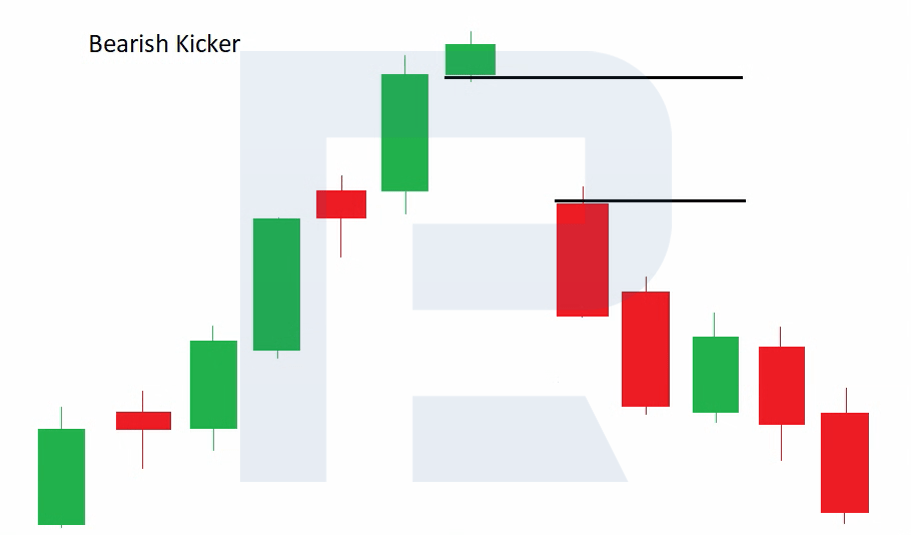
Bearish candlestick pattern Kicker
This forms on the price chart during an uptrend, which is when there is a strong upward price movement and local highs are formed. First, the first white candle of the pattern appears, then the second candle opens with a large downward gap and closes in black, showing a decline. "The bulls" had been driving the market upwards with a strong initiative, but unexpected negative news strongly influenced the market participants, and the situation changed dramatically: now the bears have taken the initiative.
So, a bearish Kicker candlestick pattern has been formed on the chart. It is fully formed after the second candle closes with a black body, and it is expected that the "bears", having received unexpected support and going on the offensive, will continue to move the quotes downwards. Thus, we can expect a severe downtrend or even a reversal and the start of a bearish trend.
How to buy on a bullish Kicker pattern
- During a downtrend, a bullish Kicker pattern forms on the price chart.
- It is recommended to open a buy position at the opening of the next candle after forming the pattern. Stop Loss can be set at the low of the first black candle.
- The Fibonacci retracement lines and significant resistance levels can be used to set Take Profit.
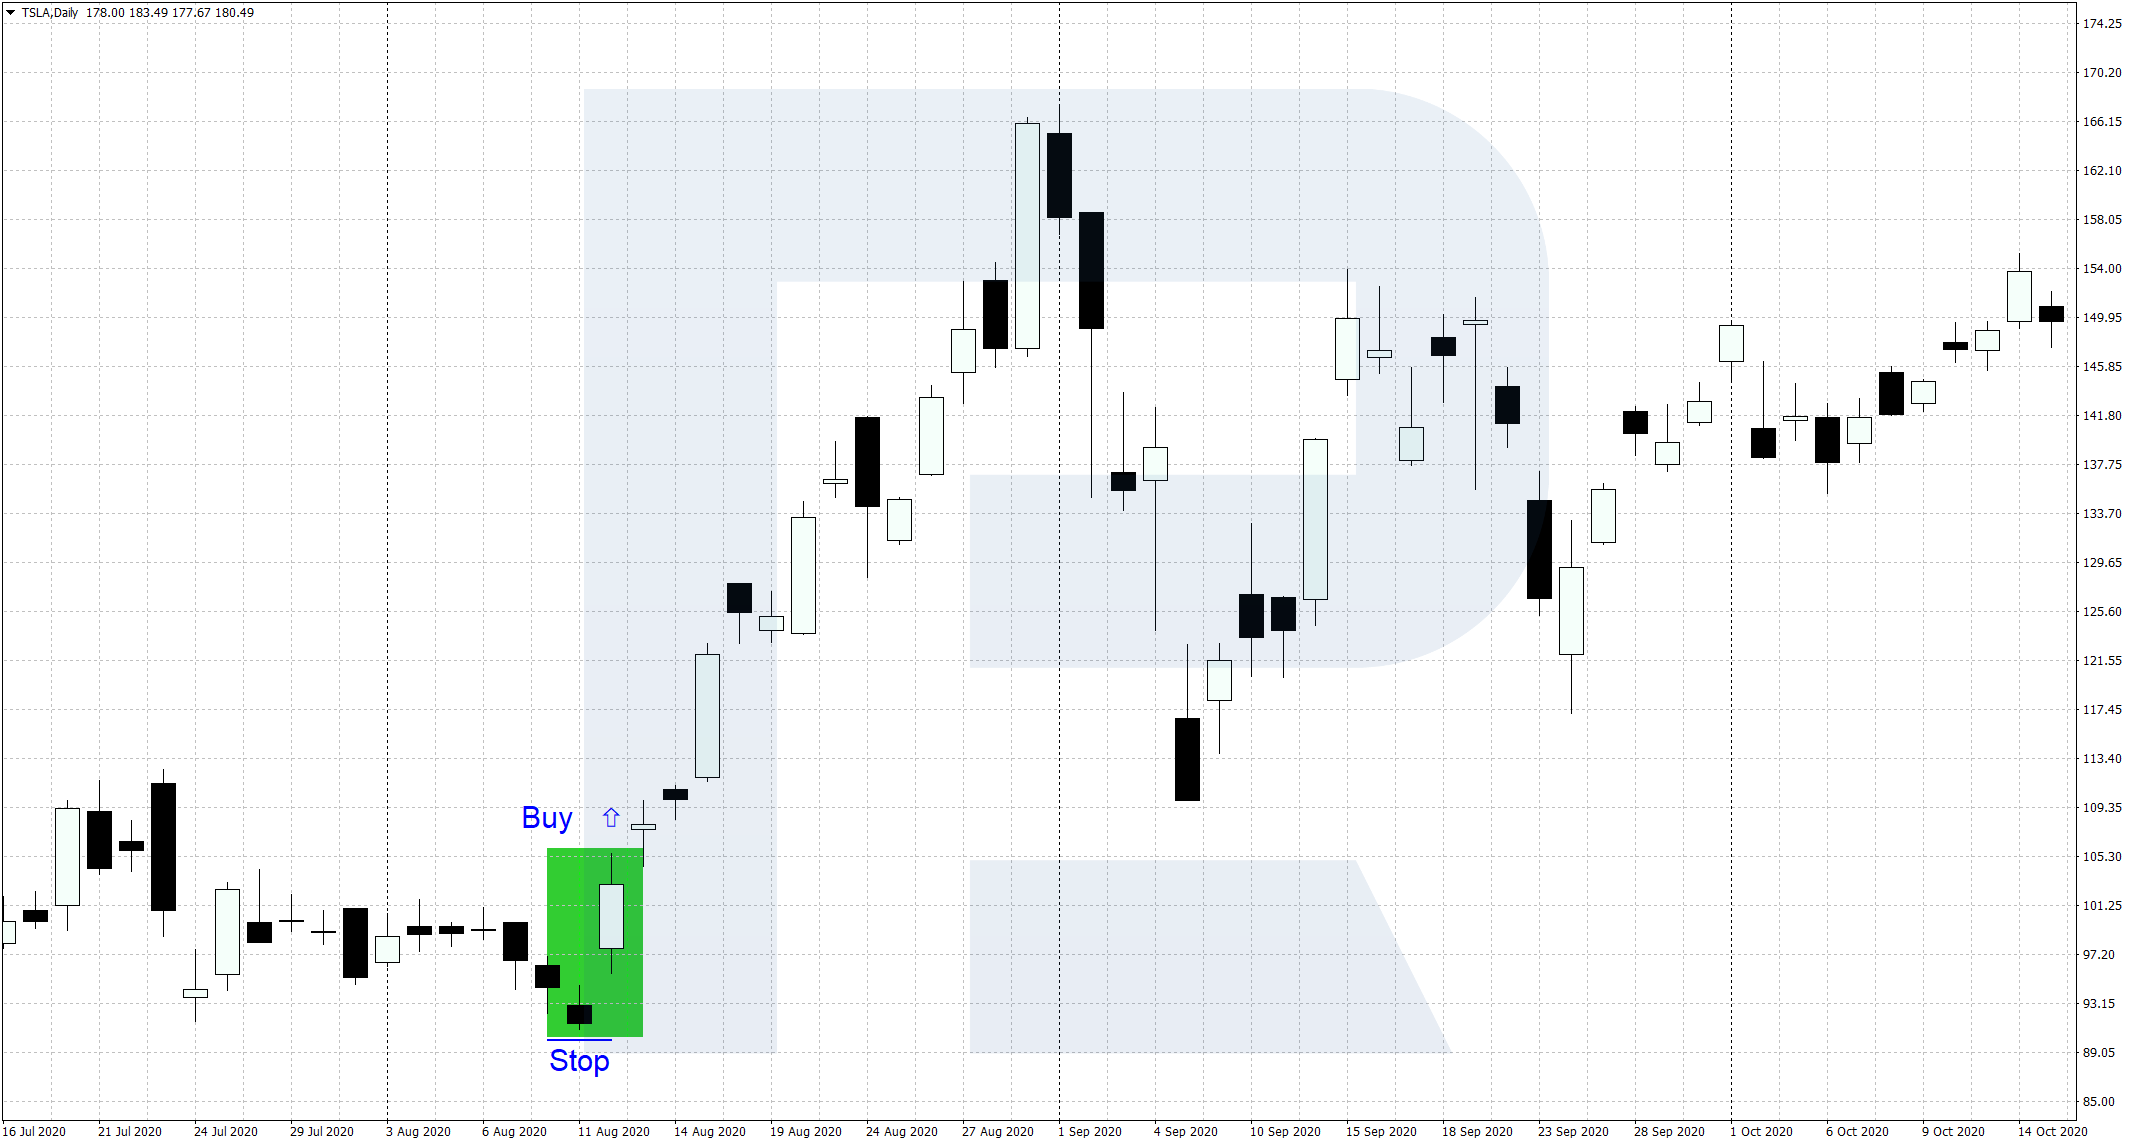
An example of buying on a bullish Kicker pattern
- On the 11th of August 2020, a bullish Kicker pattern formed on the daily chart of shares of Tesla Inc. (NASDAQ: TSLA). The next day, a buy position was opened at 107.55 USD at the start of the trading session.
- Stop Loss was set just below the low of the first black candle at 90.90 USD.
- The shares then rallied, setting a local high at USD 167.36.
How to sell in a bearish Kicker pattern
- During an uptrend, a bearish Kicker pattern forms on the price chart.
- It is advisable to open a sell position at the opening of the next candle after forming the pattern. Stop Loss can be set at the maximum of the first white candle.
- The Fibonacci retracement lines and significant support levels of the analysis can be used to set Take Profit.
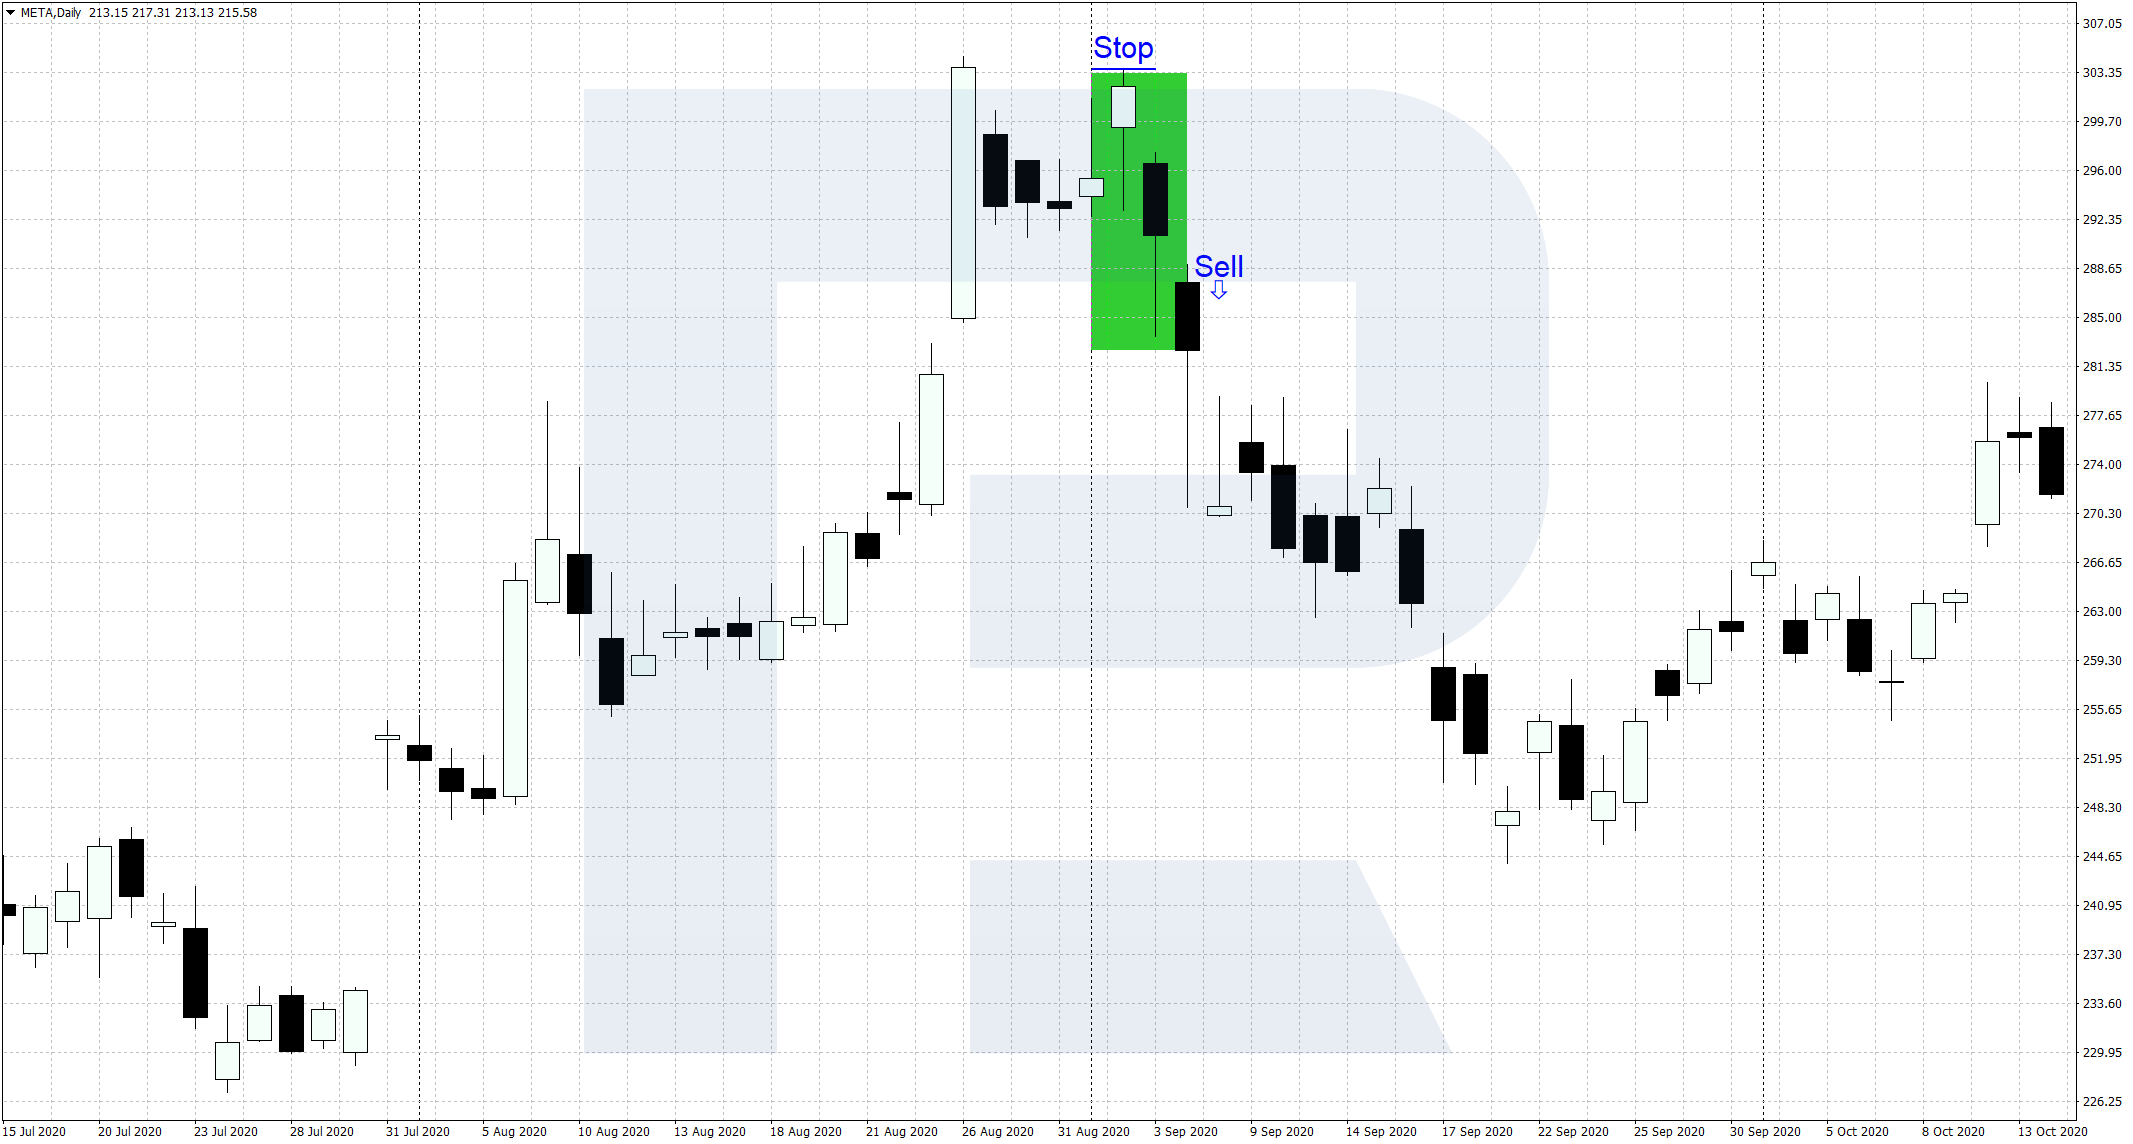
Example of a bearish Kicker pattern sale.
- On the 3rd of September 2020, a bearish Kicker pattern formed on the daily chart of Meta Platforms Inc. (NASDAQ: META) shares. The next day, a sell position was opened at 287.60 USD at the start of the trading session.
- Stop Loss was set just above the high of the first white candle at 303.60 USD.
- Then, the stock price fell steadily, setting a local low of USD 244.11.
Recommendations for the use of the pattern in trading
- This model is particularly suited to stock market trading, where it is most commonly found.
- You can open a position just before the second candle closes because this pattern may be followed by another gap to the upside, and the entry point at the opening of the next candle will be slightly worse.
- Risk management should be followed, and protective Stop Loss orders should be placed.
Conclusion
The Kicker candlestick pattern appears during an uptrend or downtrend and signals a sharp market reversal. It is rarely seen on price charts and usually forms due to the release of important information related to an asset. Before using this model in real trading, you should test its performance on historical data and practice on a demo account.