Unpacking Pump and Dump Strategy with Examples

14 minutes for reading
In order to make money on the stock market, a trader must either have patience or a trading system. Patience makes the most of the money on the stock market. The only thing a trader must do to receive profit is to buy stocks on several different companies (for risk diversification) without the leverage, with dividend payouts if possible, and hold them until there is a wish to take profit.
Stocks portfolio at Finviz.com
I’ll show a simple example. At Finviz.com, you can create your own demo stocks portfolio with the information on the time of purchase and the current profit. In 2013, which was almost seven years ago, I wanted to know what kind of money I could make by buying stocks and holding them for a long time. so, I created my demo portfolio and forgot about it.
At that time, I was choosing stocks on some kind of principles I had. Finally, I bought one share of Delta Airlines (NYSE: DAL) at 56.79 USD and и 4 cheap shares that cost less than 20 USD each. By now, the portfolio profit has exceeded 48,000 USD. However, at some moments the portfolio value was more than 100,000 not including dividends.
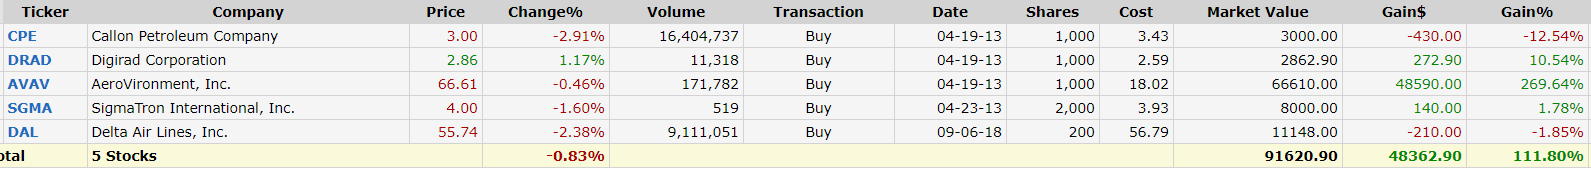
Thereby, taking into account purchasing prices in 2013, 43,258 USD were invested in these shares, which makes the average annual yield 16% and that’s much more than the yield of any bank deposit calculated in USD.
Pump and Dump strategy
When it comes to a trading strategy, it’s much more complicated. There are a lot of different trading systems: some of them make a profit on trend markets, while others – during “dead season”. Some people trade at level breakouts, while others do the opposite. However, in all these systems, periods of profit are followed by periods of losses. As a result, each of these systems requires some particular market conditions, when they will ear profit.
But today we’ll talk about one of the systems, which doesn’t depend on the market environment, the country’s economy, crisis, or something like that. This trading system has always been and will always be efficient as long as trading operations on the stock market are performed by a man.
This trading system is based on nothing but human greed and wish to make a fast buck. And you know, the greed will always follow the money.
The trading system’s name is Pump and Dump.
Example with NanoViricides Inc
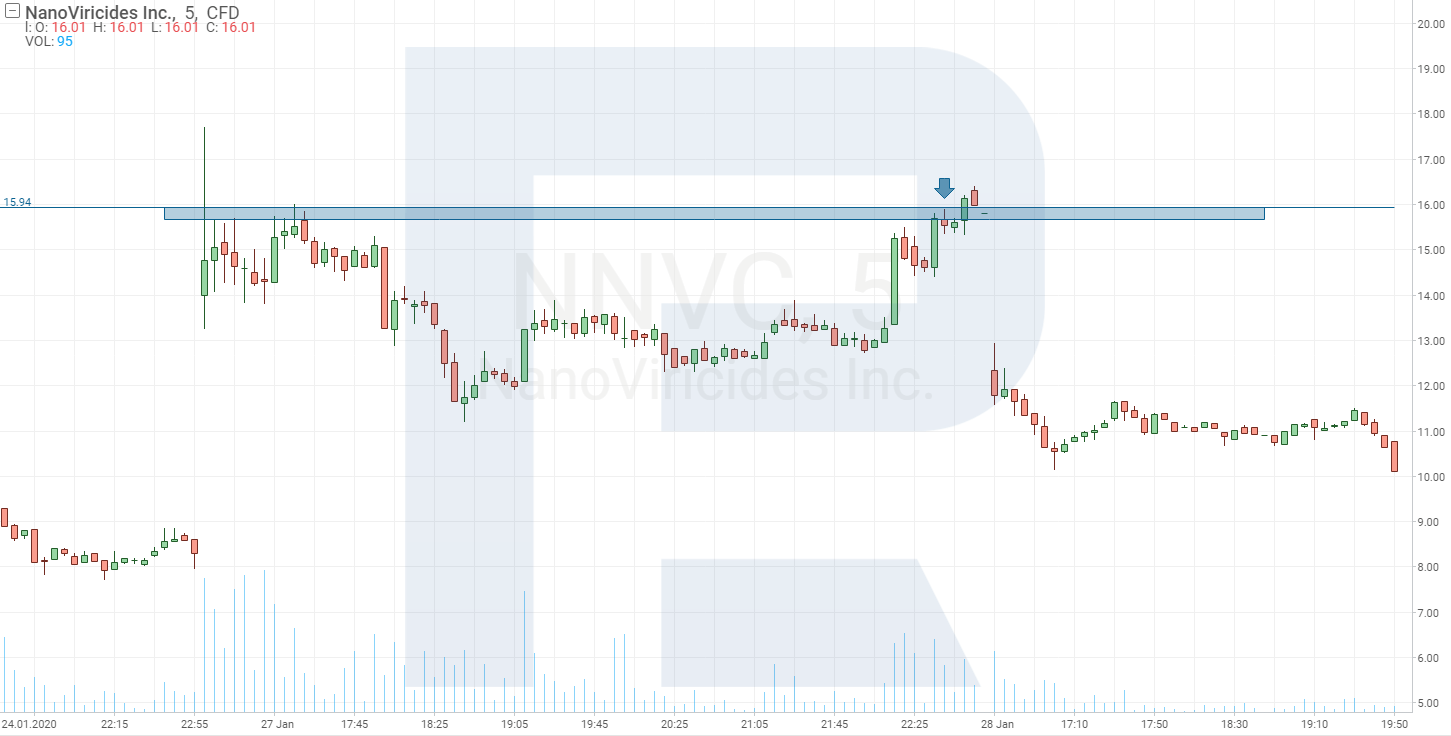
So, pay attention to NanoViricides Inc (NYSE: NNVC) stocks. Until the middle of 2019, the average traded volume didn’t exceed 50.000 shares per trading session, while the trading range was between 1 and 3 USD per stock. However, in only a month, the daily traded volume skyrocketed up to 4.4M shares per trading session and in 4 days it was more than 33M shares. And this was happening to the company, the capitalization of which was less than 32M USD with only 17 people on the staff.
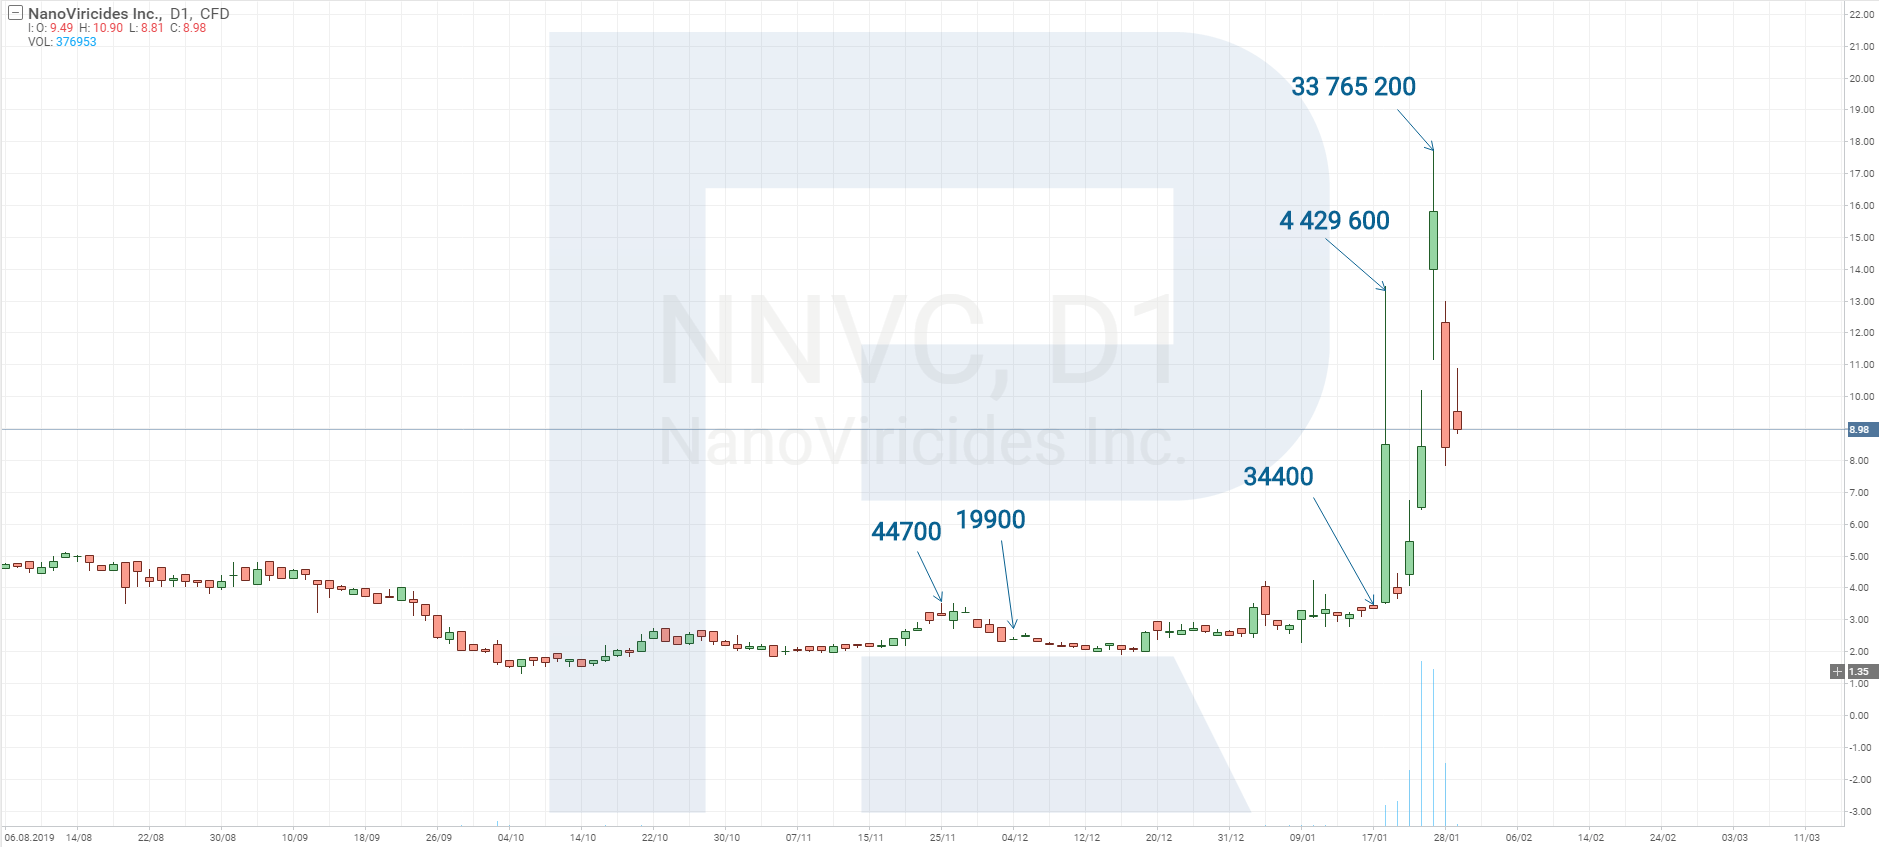
For a better understanding of the volume growth rate, let’s compare it with a famous car manufacturer, Ford (NYSE: F), shares of which are also not very expensive. The average traded volume in Ford is 35M shares, but its capitalization is 35B USD and the staff includes 199,000 employees. Sizes of these companies are way too different, but the traded volume of shares is almost the same.
Okay, going forward. Over the last 4 years, NanoViricides Inc never became clearly profitable, that’s why such a fast growth was insupportable, in other words, it was just “pumped” with money. Consequently, this growth had to be followed by a similar quick decline, and we can see it right now.
However, any growth of stocks has to be supported by something, so in order to understand whether you should sell shares on this company or not, it’s necessary to find out the reason for this growth. For that, you can use any available sources of information.
Analysis of the NanoViricides Inc news
First of all, it’s necessary to check the Finviz.com website, which contains almost all news related to the targeted companies.
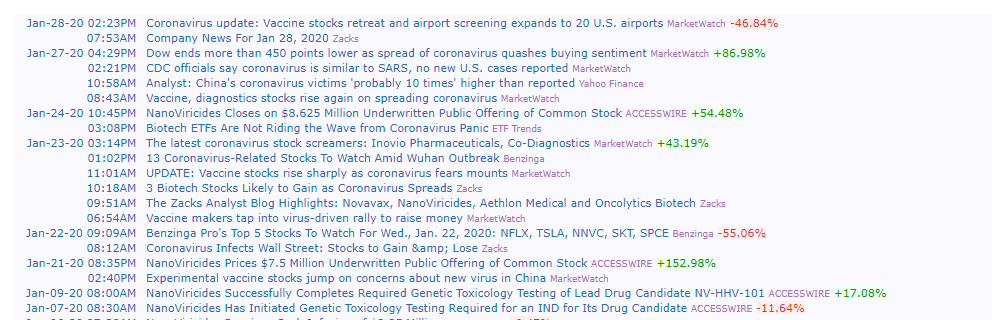
Reading the news headlines, one can find out that the growth was caused by the Chinese coronavirus outbreak, while NanoViricides is one of the companies that develop a vaccine to confront the virus. As a result, investors, capitalizing on a situation, started to buy up shares of pharmaceutical companies, thus increasing demand for them. And then it is transforming into an avalanche.


Watching the stock price movements
On the first day of the increased demand, shares rose not more than by 300%. Of course, on the following day, investors that keep track of stocks with high volatility also paid attention to this company. They found out the reasons for growth in the same way we did and started monitoring the situation.
And then the market gives traders a real present. On the following trading day, the stock’s opening price is the same where it started to grow. As a result, a greater number of traders, much more than earlier, joined this purchasing process. And guess what? This leads to an increase in demand by 8 times: the stock price rose by more than 400% in just days.
And here comes the moment when investors, who bought the stock at the bottom, start selling it and take profit. In this situation, the one who sells first will get more profit. But that’s not the end.
At this moment, the fast growth of the stock attracts traders, who want to make money on its decline. Hence, the stock attracts everyone who is looking for an opportunity to make a fast buck.
Bears come into play
Now it’s a real fight for profit between bears and bulls. Bulls are doing their best to keep the stock at the top because many of them didn’t have a chance to buy it at the lower price and then hope that the stock will continue rising. They place limit buy orders, thus creating demand for the stock, while bears increase their short positions, thus satisfying bulls’ demand.
As a result, investors, who bought the stock at the top, get trapped as they start accumulating losses. The stock is plummeting and decisions have to be made immediately because every wasted minute can be worth thousands of dollars.
Finally, bulls have to sell the stock and record losses, thus putting additional pressure on it and making its price plummeting even faster. In the end, the stock price usually reaches the level, from which it earlier started skyrocketing.
After all battles are over, comes the calm period. The company is analyzed by an entirely different group of investors, who specialize in long-term investments. If they find the company promising, they start opening positions, but slowly, without attracting a lot of attention. As a result, the stock is forming a new uptrend, which may within several months break the highs reached during the feverish demand in the past. Such intense fights between bulls and bears happen from time to time in stocks of cheap and unknown companies.
So, I described how traders act at different stages of an increase and decrease in stock prices. In this particular example, bears were stronger and bulls won’t forget it. Such battles occur almost every day. An excellent example of the battle where bulls won is Tesla (NASDAQ: TSLA), when bears lost more than 5 billion USD.
To find out how to become a bull and manage to buy a cheap stock before it rises, read FDA: How to Find Stocks of Promising Healthcare Companies?
And now let’s discuss how to make money on the depreciation of stocks, the growth of which hasn’t been confirmed by improving financial indicators.
How to make money on the depreciation of stocks?
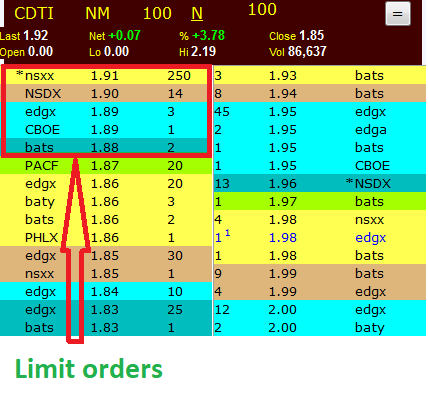
Let’s remember what bulls do for ceiling the stock price. They place limit buy orders. These orders are displayed in on the left in Level 2 (Market depth) window.
As a result, as long as the big order at some particular price is in Level 2, the stock price won’t go below this level. If there is no major seller in the stock, who is ready to satisfy the demand with a single deal only, then we can start noticing on the chart that the stock is forming a support at the level where the buy order is located. It means that the price is reaching this level and rebounding from it, because minor sellers can’t satisfy the demand and because active buyers appear close to this level in order to prevent the price from further decline.
This continues until either buyers or sellers run out of money to increase their positions.
We shouldn’t join this battle from the very beginning, it might be enough just to watch the happenings and catch the moment when bulls start faltering. And this moment is defined by a breakout of the support level, after which buyers sometimes try to keep the price, but in most cases, they lose control over the situation and bears take charge. This is exactly the moment when we should enter the market, thus putting additional pressure on the stock.
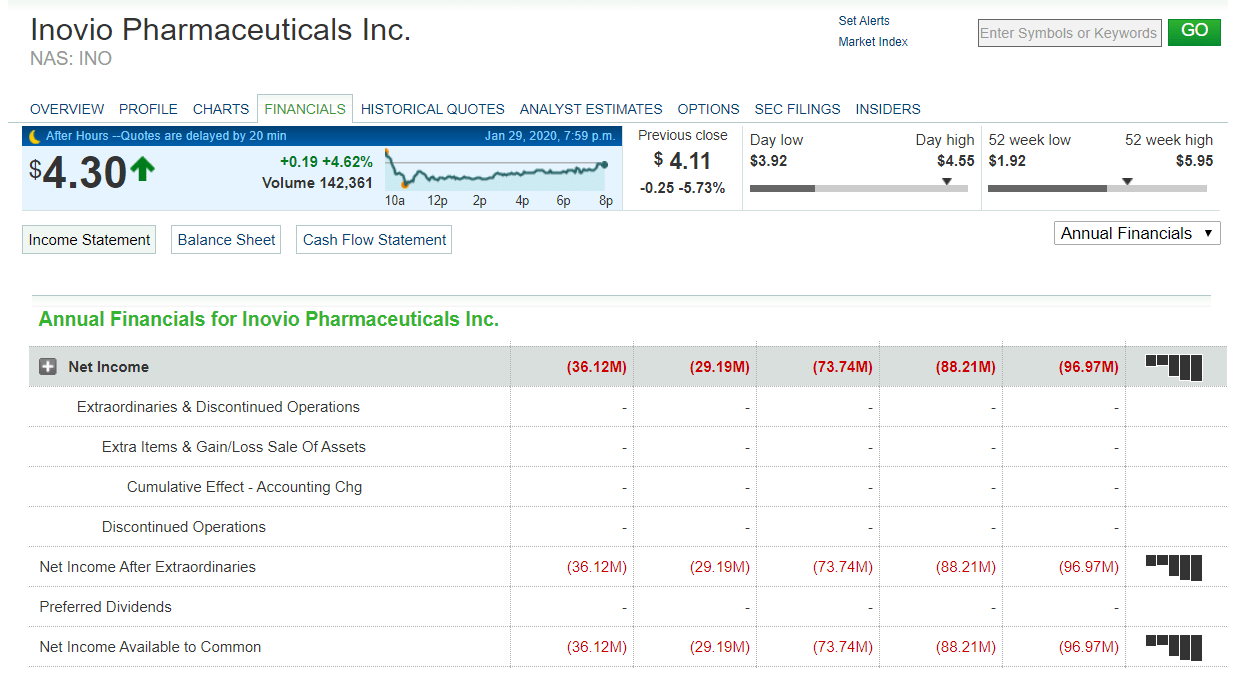
Example with Inovio Pharmaceuticals
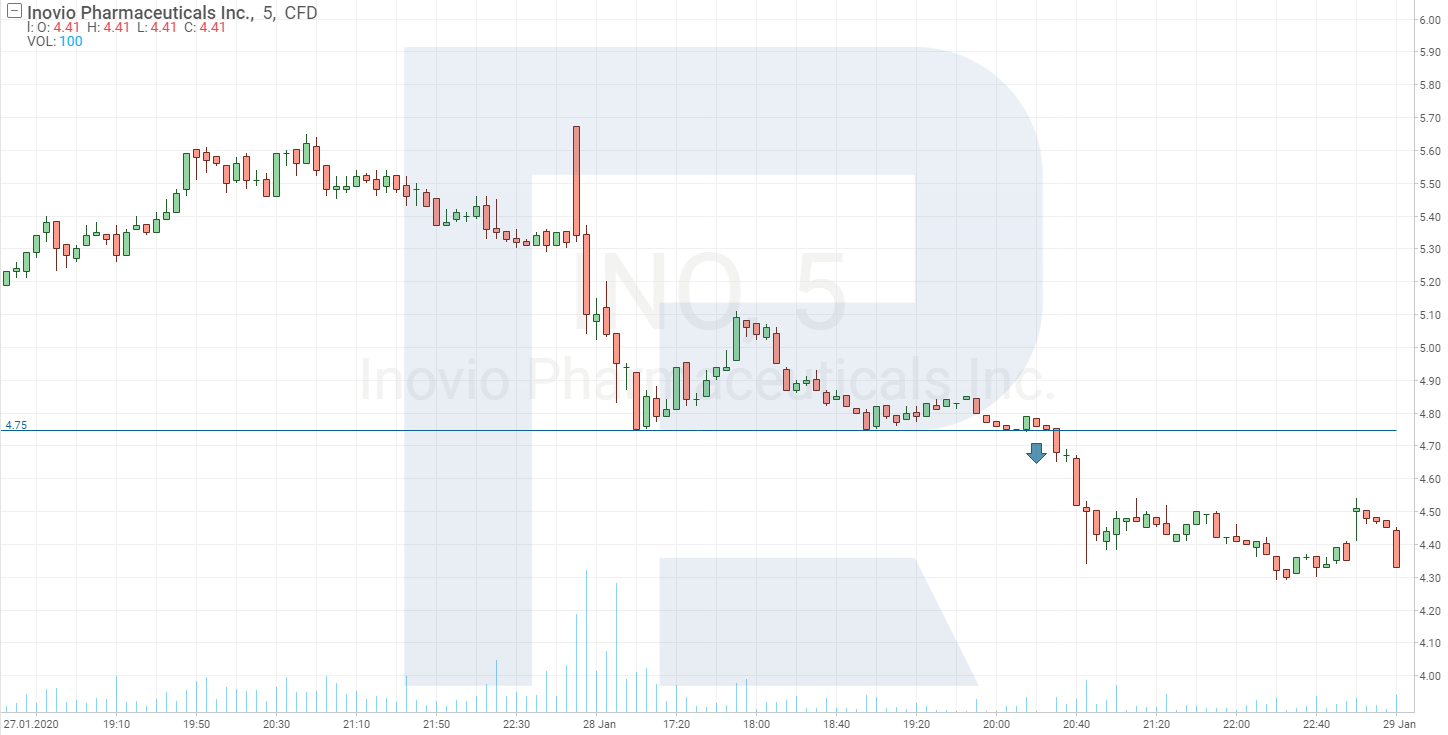
Now I will show how it looks on the chart. As an example, let’s take Inovio Pharmaceuticals (NASDAQ: INO). It’s a loss-making company, shares of which rose at the time of the coronavirus outbreak.
Since December 2019, the stock has risen by more than 100%. The stock required special attention at the moments when each new trading session started with a gap upwards.
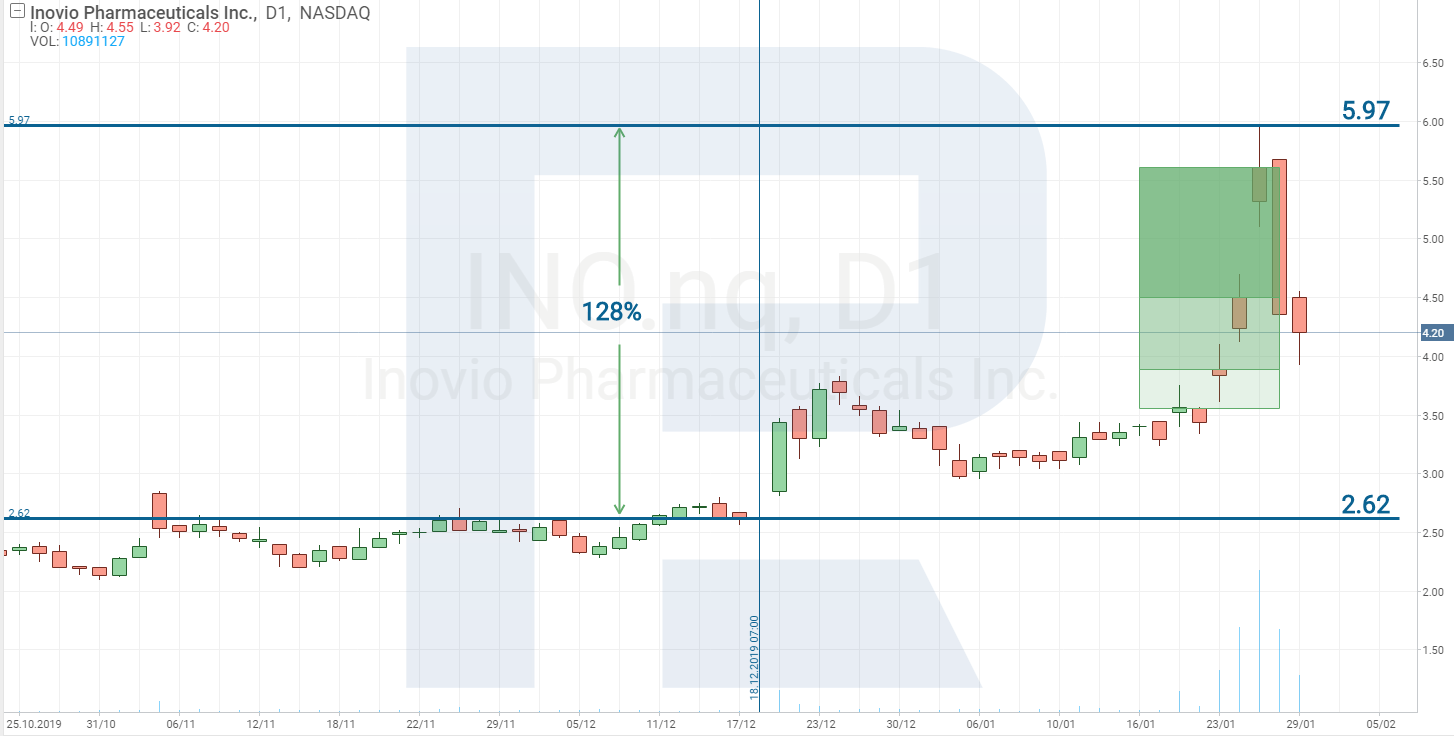
The wider the gap, the higher the chance that the stock may reverse soon.
In this stock, the gap was widening for three consecutive trading sessions. Our task is to define the exact moment when bulls and bears start their fight. To do this, we switch to M5 and wait for the first support to appear.
Finally, at the end of the third day of skyrocketing, bulls formed a support level at 5.30. On the following day, the stock’s opening price was above this level, but bears managed to break this support in ten minutes, make bulls surrender, and start a new decline in the stock.
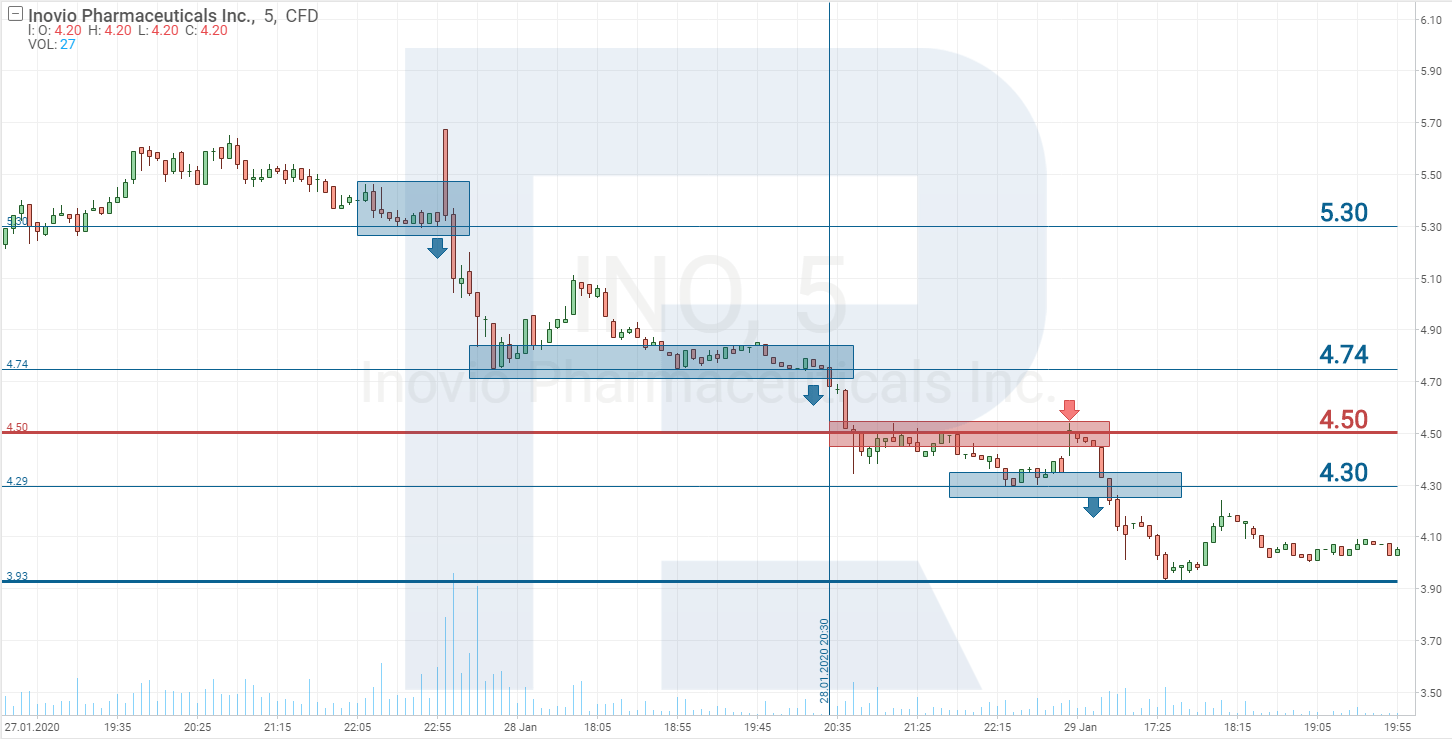
Regarding the chart, bulls were keeping their hopes up to recover the price. They managed to stop the decline at 4.74 and were “defending” the support level for more than 3 hours, but in vain. Bears broke this support level as well and then, feeling their strength, formed a resistance level at 4.50 per stock and prevented the price from breaking it. As a result, bulls lost all hopes to recover the price and the stock went below 4 USD.
Thereby, by selling 1,000 shares at 5.30 (invested amount would be 5,300 USD), one might have earned 1,300 USD in two days. Such situations in stocks happen almost every week.


MegaPump through the example of Tilray
Many would think that it’s very childish to trade cheap stocks and decide to switch to something more serious, where it may be possible to profit 20-30 thousand USD per day from 1,000 shares.
Here you go: if you want to make some serious money, welcome to MegaPump. The stock, where millions of dollars are pumped in one share, which may later collapse in a second. But unlike cheap stocks, you won’t see a perfect picture on the chart there. Levels will be blurred, while investors will be acting in the same way they do with cheap stocks. The difference is the trade value.
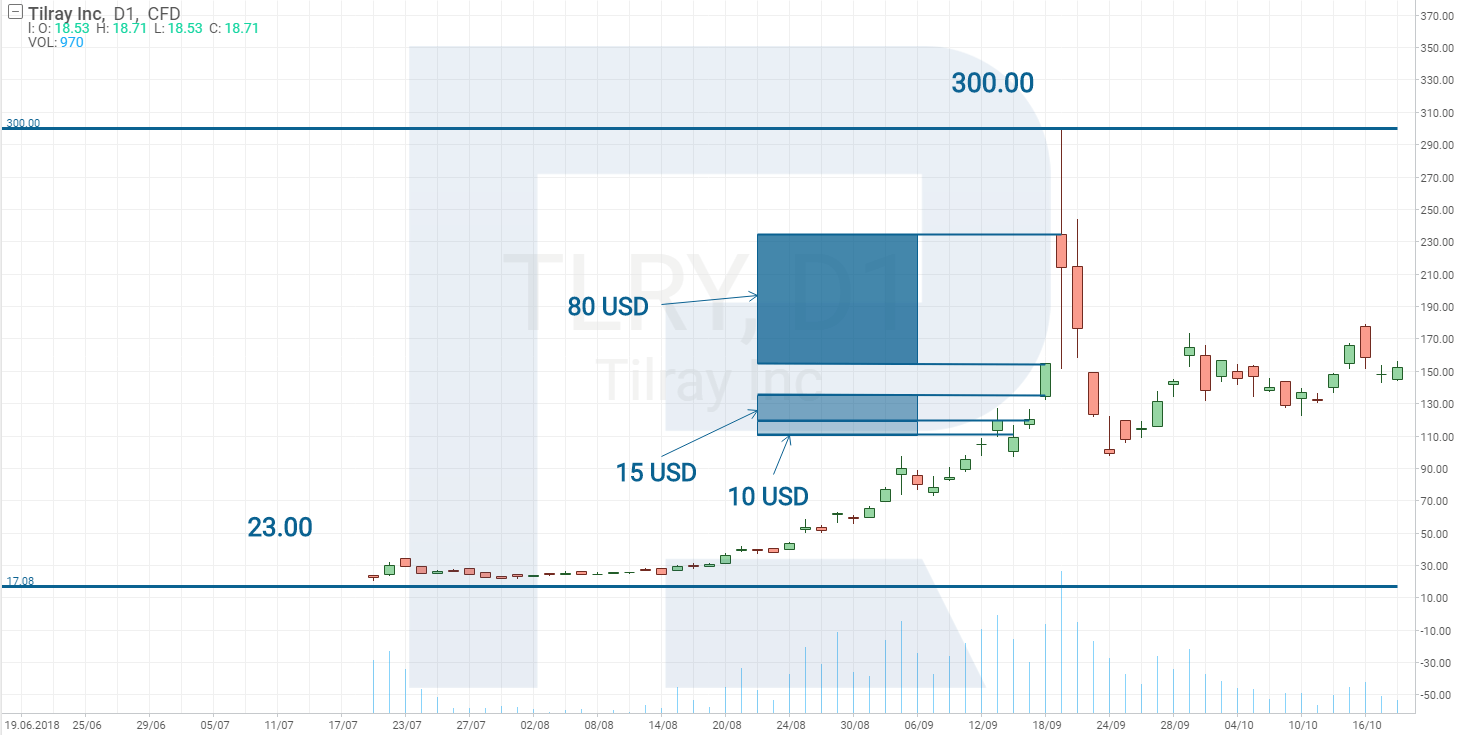
I’ll provide an example of one such company, the stocks of which rose by almost 15 times in several months. In 2018, the US government legalized using marihuana for medical purposes. As a result, the companies that were producing medications based on marihuana rushed to US stock exchanges. One of these companies was from Canada, Tilray (NASDAQ: TLRY). On July 19th, 2019, Tilray held an IPO at NASDAQ. Nothing special was happening on that day, the stock was trading the same way as stocks of many other companies.
However, in the media, there was a lively discussion about legalizing marihuana, which later increased investors’ interest in such companies. Ща course, they started looking for opportunities to benefit from this and Tilray step into the spotlight. Literally a month after the IPO, the stock started rising step by step and this growth boosted with each passing day. Then, everything went according to a familiar scenario. Three days before the collapse, the gap between trading sessions increased.
The same happened with Inovio Pharmaceuticals and you can see in in the chart above. All we had to do afterwards is to check M5 and find a spot where bulls are trying to keep the stock from inevitable decline.
There was very high volatility on the day when the price reached 300 USD: the stock could cover 150 USD in an hour, which means that an open position of 1,000 shares could bring 150,000 USD of profit. It’s very difficult to work under such conditions. The profit amount can change every second by thousands of dollars. It’s very essential to be cold-blooded when monitoring what is happening in the chart, see the hints that appear, and look for necessary information.
On September 19th, when the price reached the highest level, bears already tried to stop it at 240 USD, but bulls were too aggressive at that time. As a result, the stock skyrocketed up to 300 USD and investors started to take profit, thus forcing the stock to plummet down to 150 USD.

On the following day, when everyone calmed down, bears once again formed a barrier at 240 USD, but this time bulls couldn’t handle it. In two hours, the stock went from 240 USD to 160 USD per share. As a result, those with deposits exceeding 240,000 USD could easily get profit of 80,000 USD from a position of 1,000 shares without any fuss.
And now let’s collect all the information that is necessary for trading with Pump and Dump system.
Choosing stocks for Pump and Dump strategy
To do this, one can use Screener at Finviz.com.
In search settings, go to Signal and choose Top Gainers, then go to Current Volume and choose Over 100K.
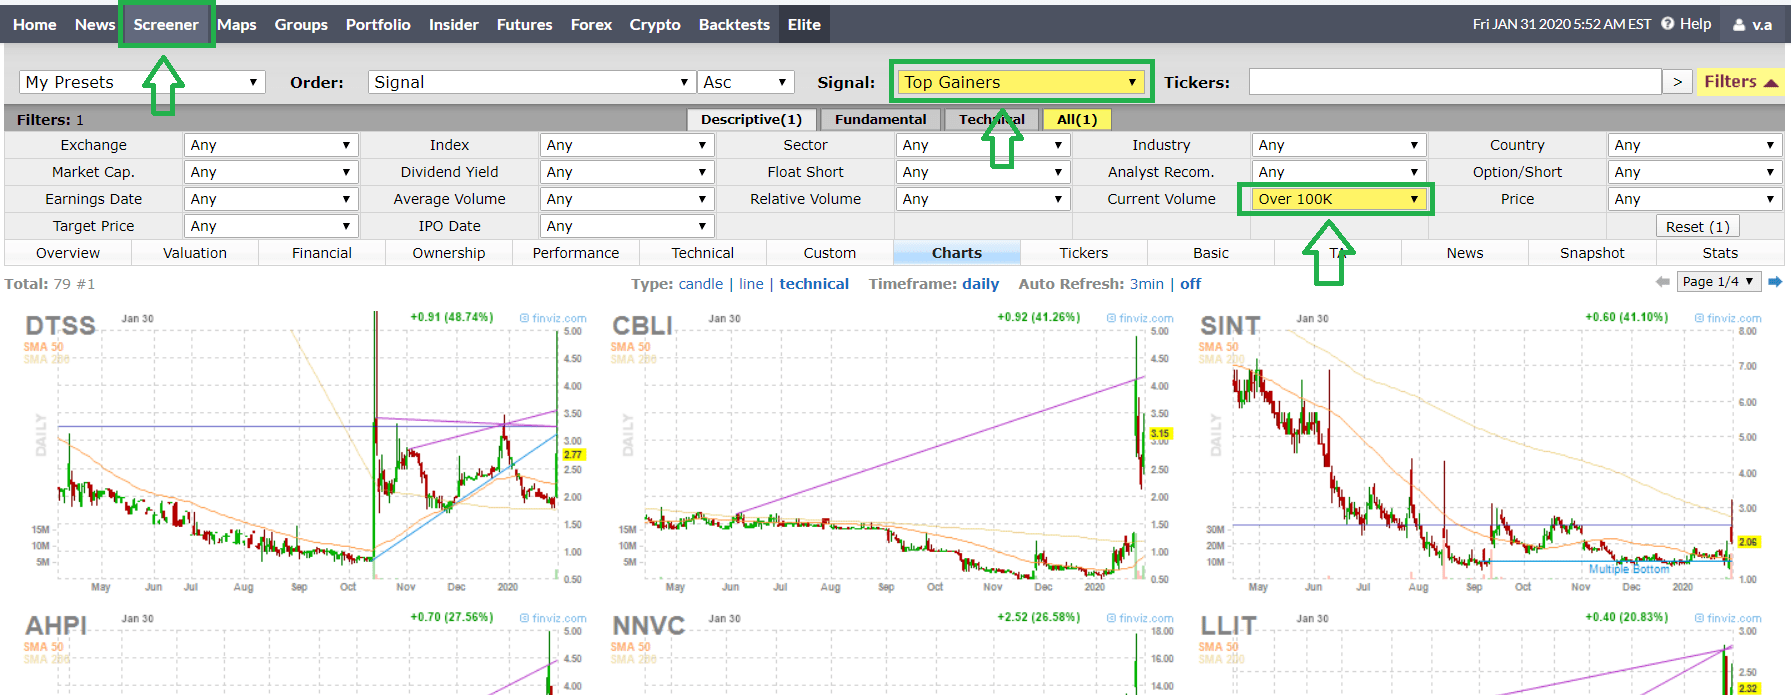
Then turn your attention to the stocks, prices of which increased by more than 50%.
The higher the percentage, the deeper the decline.

After choosing the stock, go to the R StocksTrader platform and start monitoring its M5 chart. The purpose of this is to find the moment when bulls or bears start forming the level, where you can later open a position. In our case, there two scenarios to open a position. The first one implies a breakout of the support level formed by bulls.

The second scenario suggests a rebound from the resistance level formed by bears.
After that, all you have to do is click Sell.
Conclusion
Pump and Dump trading system is very simple in use and can be easily handled by any trader who knows how to work with support and resistance level. Potential profit is not limited, because traders can work with stocks of both cheap and expensive companies. An initial deposit od 1,000 USD is enough to start working with this system.
All a trader is required to do is to stay away from the battle until bears take charge.


