Catch Your Smash Day with Larry Williams

7 minutes for reading
In this article, we will discuss the trading method Smash Day of a famous exchange trader Larry Williams. His expertise is confirmed by his victory in a prestigious world futures championship Robbins World Cup with a phenomenal result — over 11000% profit in a year.
How to trade a Smash Day?
The Smash Day trading pattern by Larry Williams suggests that the current impulse of the price movement has a higher possibility of a reversal after on the chart, there appears a highly volatile day closing above/below the last extremes. Such a trading day is called "Smash" (or reversal) because it precedes a change in the current price direction.
When a Smash Day forms, the market leaps up- or downwards, closing behind the previous highs/lows. At this moment, all the traders that were late for market entry try to catch the last train, counting on the continuation of the movement. However, their hopes will not come true if the next day the price goes in the opposite direction and forms a Smash Day reversal pattern.
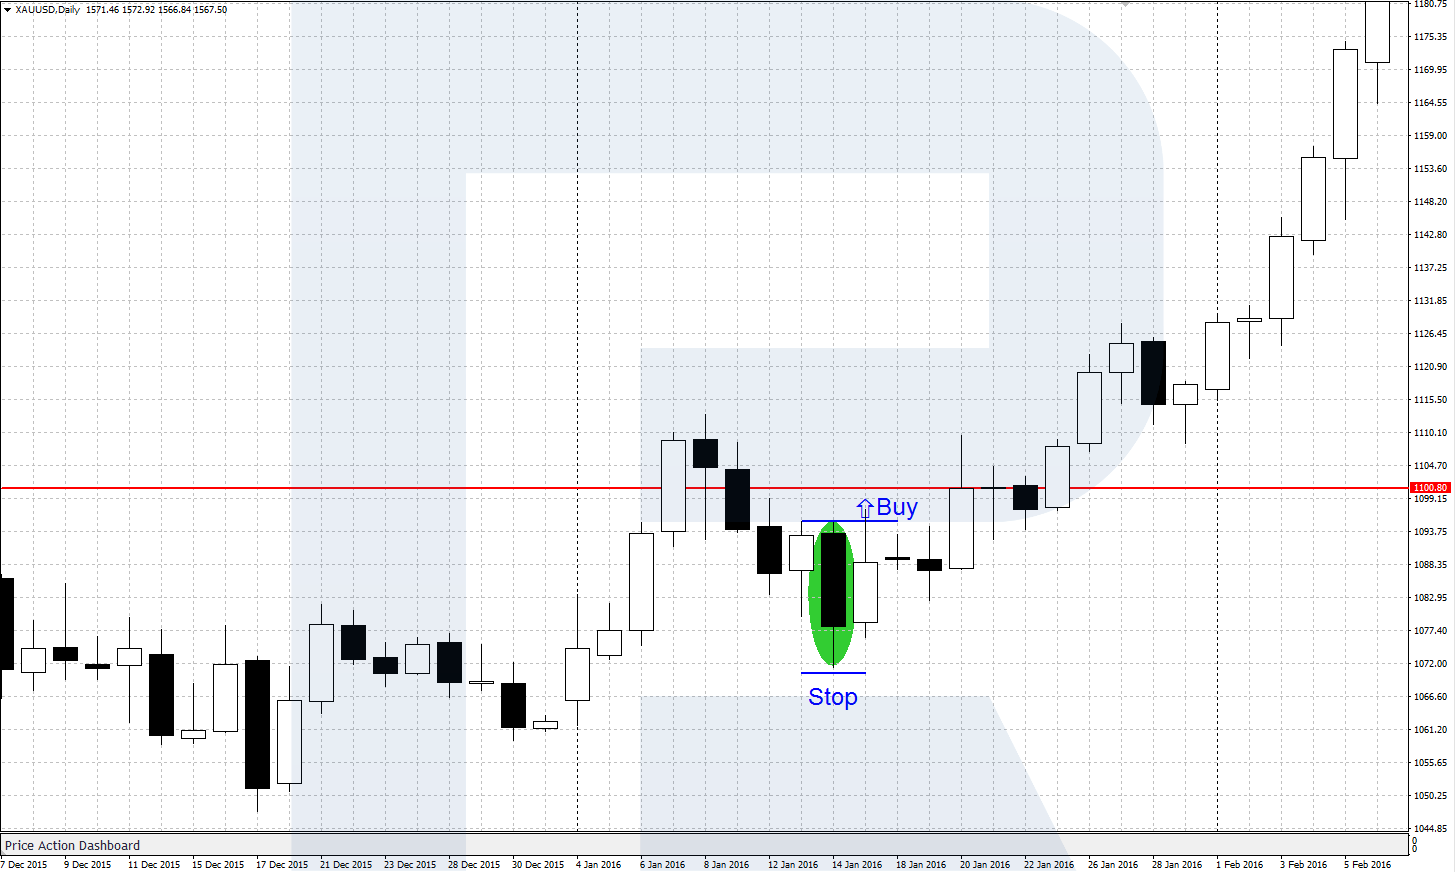
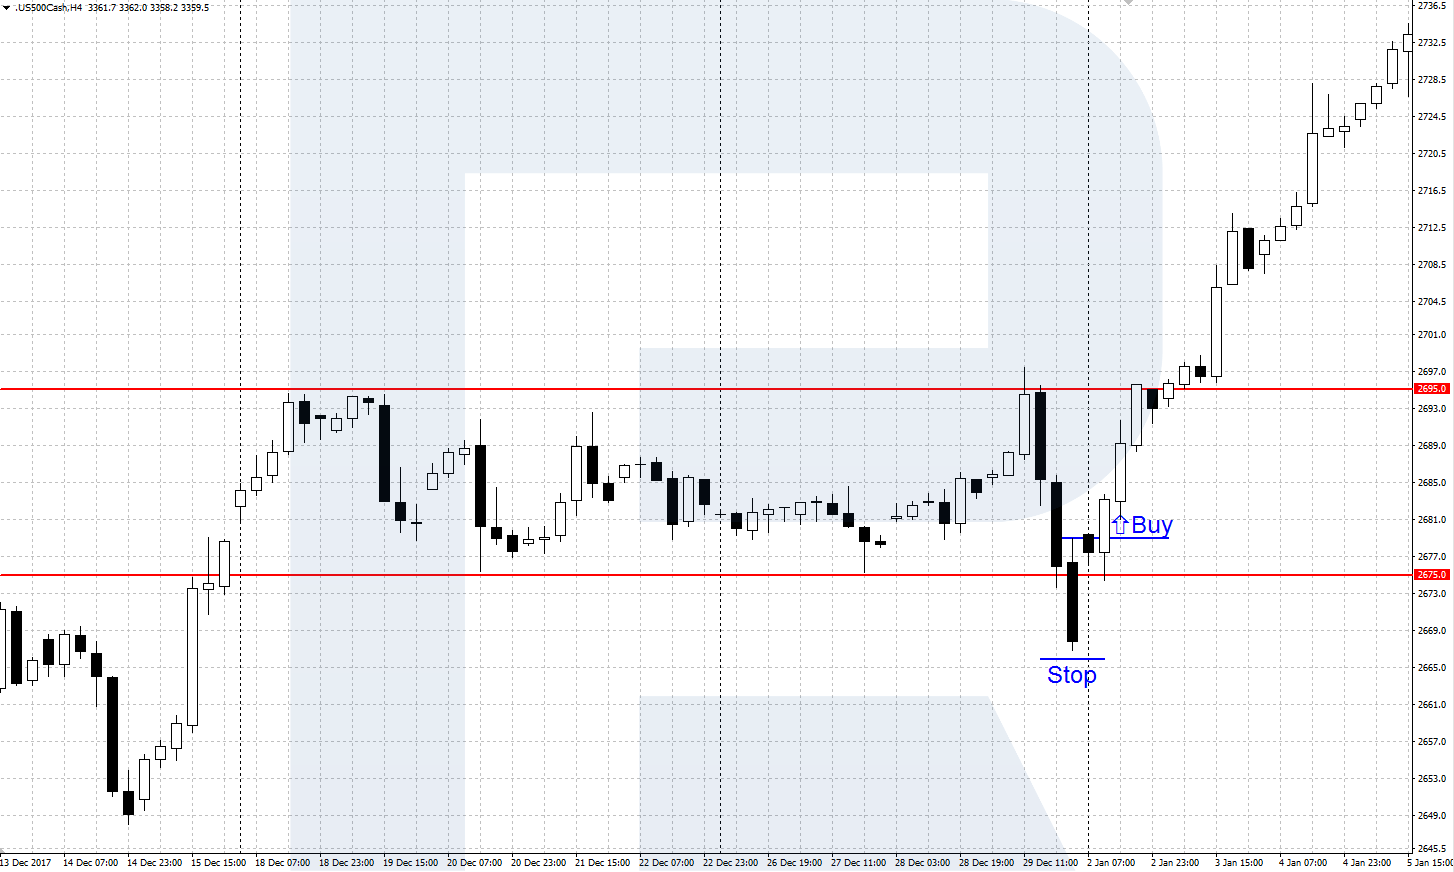
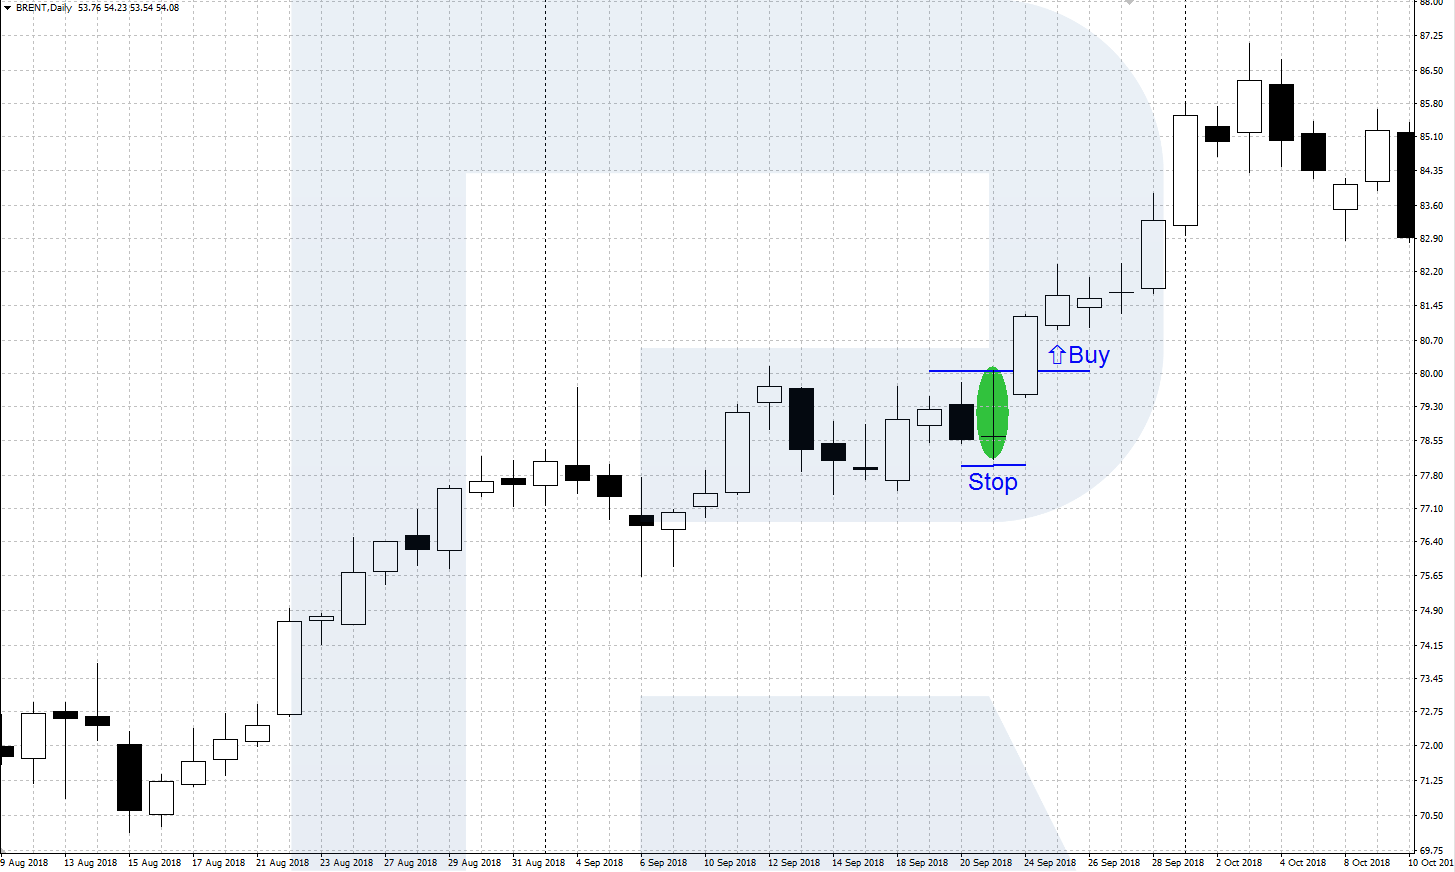
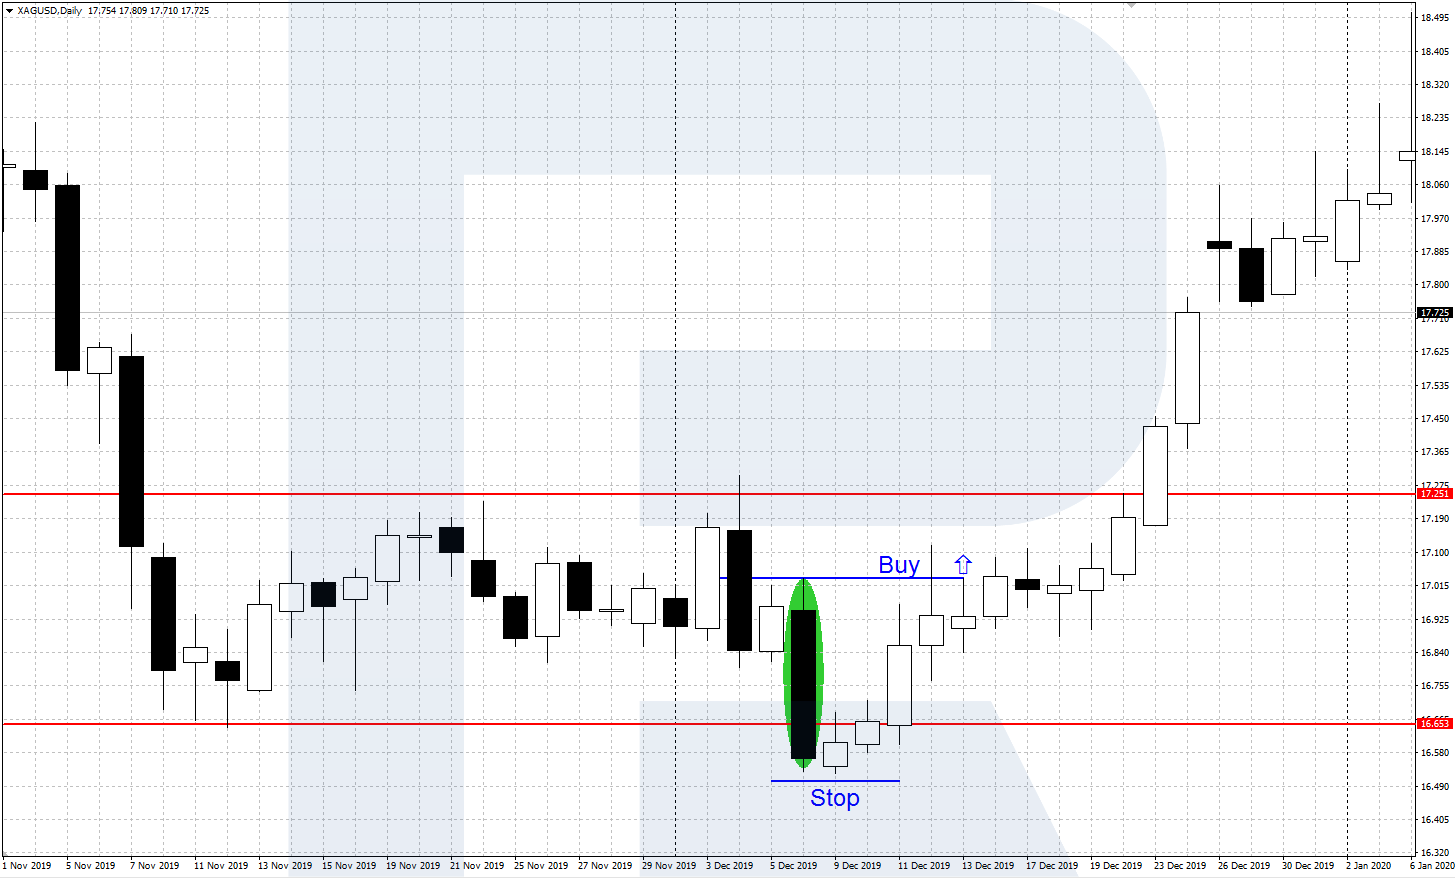
A Smash Day to buy
This is a day of increased volatility in a descending price movement that closes below the low of the previous session. Such a day can cover up the lows of the previous 3 to 8 days. If the next day the price starts moving in the opposite direction and renews the high of the Smash Day in the end — you can open a position to buy with a Stop Loss below the low of the Smash Day.
This is a reversal pattern but you may not necessarily trade a Smash Day counter a strong trend. To my mind, it is perfect when this pattern finishes a correction to an uptrend. For example, if the daily trend is ascending, there is a descending correction on H1 or H4, finished by a Smash Day to buy. When the correction is over, we open a position to but in the direction of the main (daily) uptrend.
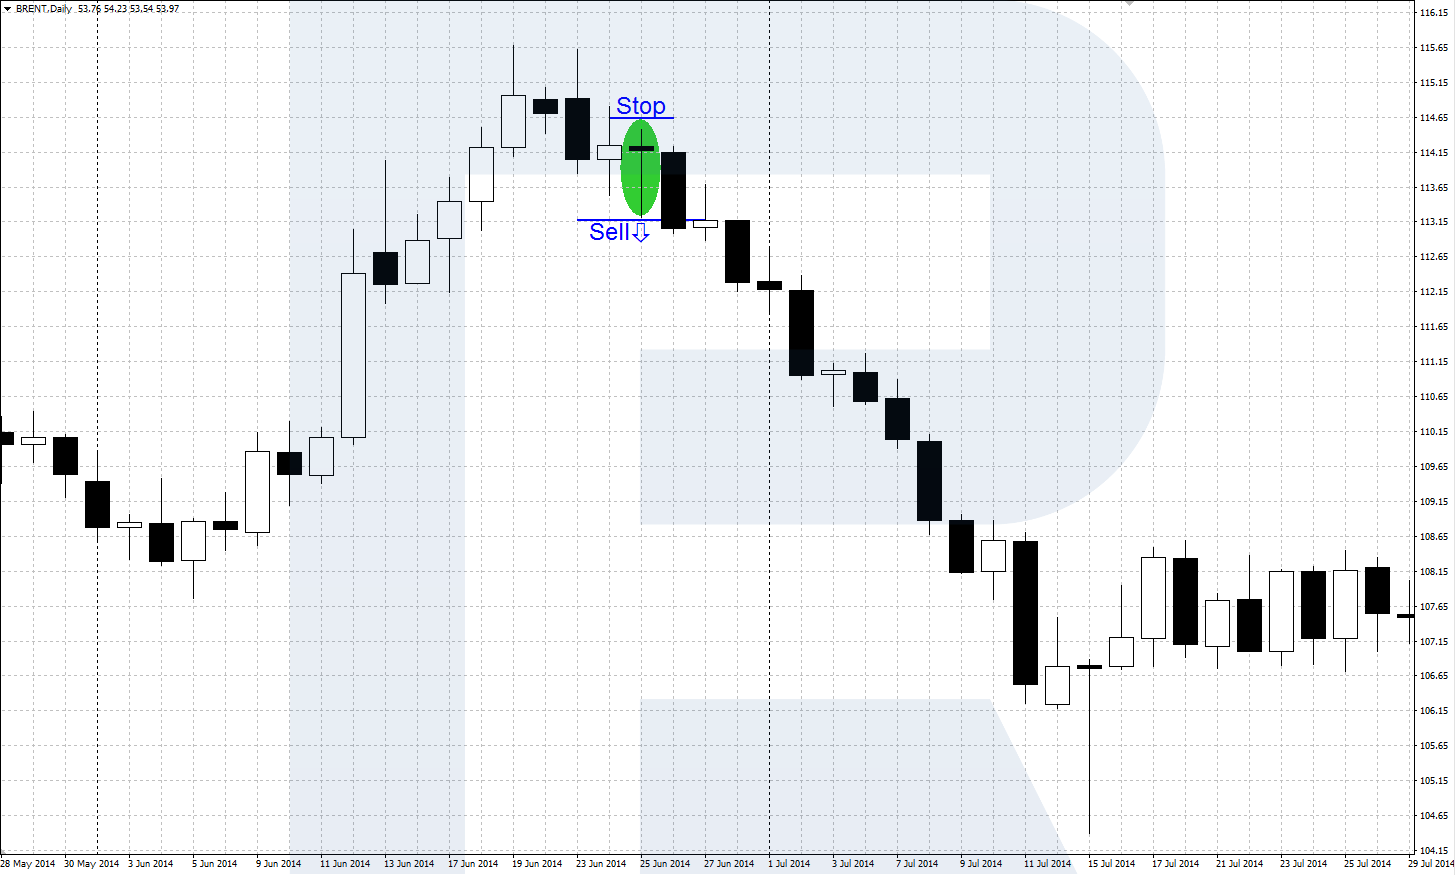
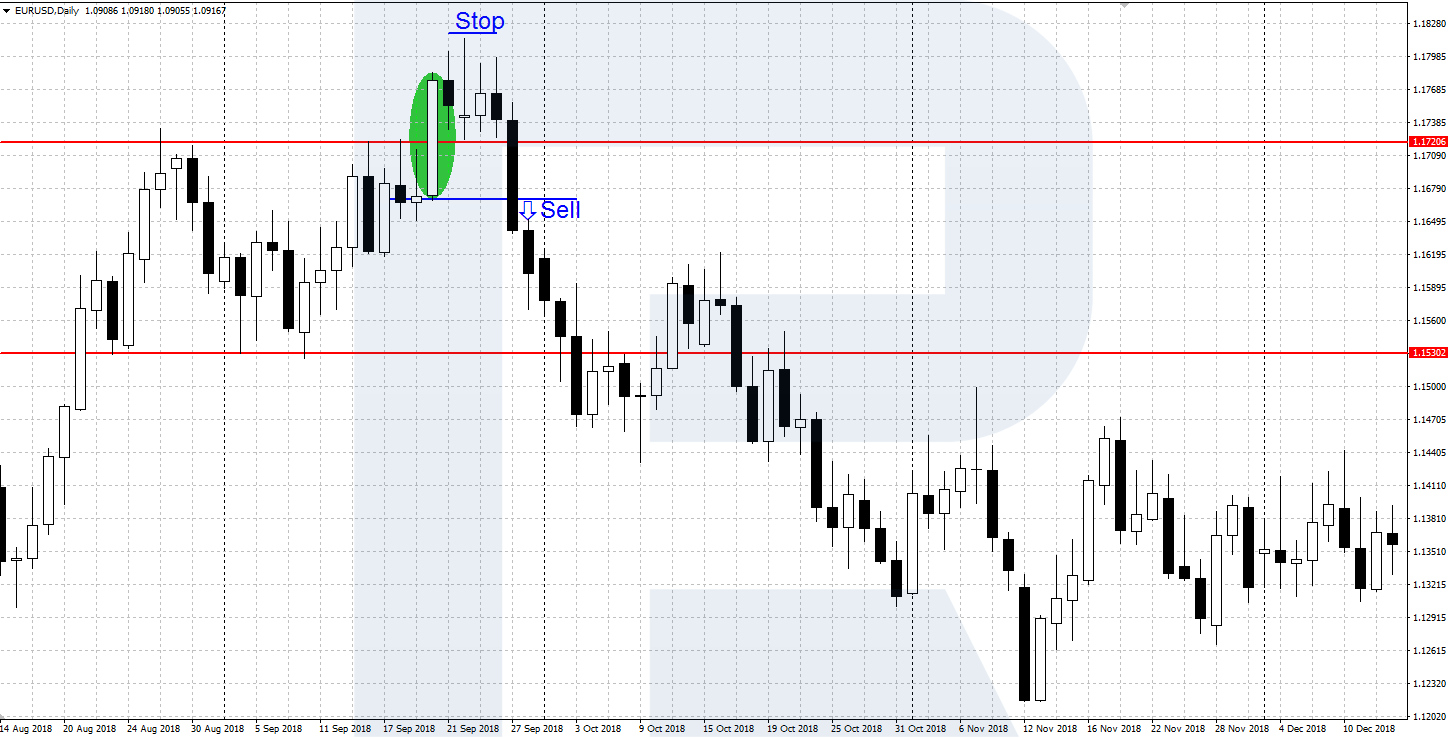
A Smash Day to sell
Same with the previous one, this reversal pattern forms when there emerges a day of increased volatility on the market — in an ascending price movement this time. The day is closed at the top of the trading range above the previous high. The next day, the price starts going down actively. After the minimum of the Smash Day is renewed, we open a position to sell, with a Stop Loss behind the high.
This pattern can also be used when it emerges in a correction against the main downtrend. The trend of the longer timeframe must be descending, and the trend of the shorter timeframe (the correction) must end in a Smash Day reversal pattern to sell. Then the position being opened will be in the direction of the main downtrend.

A Smash Day in a flat
A flat is a type of a range in which the quotations consolidate without a clear direction of the price movement. Here, a Smash Day can also appear – a day of high volatility, when the price attempts to break out the flat, exceeding the previous highs/lows. If a Smash Day is followed by a reversal and the price goes in the opposite direction – open a position as described above.
A Hidden Smash Day
Another trading pattern based on the emergence of a highly volatile (smash) day on the market is called a Hidden Smash Day. Though its name resembles the Smash Day, the Hidden Smash Day means that the price keeps moving in its main direction. In other words, the Hidden Smash Day is a trend continuation pattern.
On the price chart, a Hidden Smash Day looks like a daily candlestick with a long “tail” in the direction of the current trend and a small body. The idea of the pattern is that the price comes across a strong resistance in the trend, reflected by the long tail of the candlestick. But if a reversal does not happen, and the price moves in the same direction renewing the high/low – the trend is likely to continue.
A Hidden Smash Day to buy
In an uptrend, a highly volatile day emerges, renewing the previous high and closing in the lower part of the range of the day. The closing price must be in the lower 25% of the range, it may be even lower than the opening price. If the next day the price starts moving upwards actively and renews the high of the Hidden Smash Day soon – open a position to buy with a Stop Loss behind the minimum of the Smash Day.
A Hidden Smash Day to sell
It is formed in a downtrend after a highly volatile day appears, renewing the nearest low. The day must close in the upper 25% of the range of the day, it may even exceed the opening price. If the market continues moving downwards actively, renewing the low of the Hidden Smash Day – open a position to sell with a Stop Loss above the high of the Smash Day.
Specialist Trap
This is another interesting trading method that Williams found in the works of another famous trader Richard Wyckoff. The method is based on a false breakout of a small flat formed in an up- or a downtrend. The execution principle resembles the Smash Day reversal pattern in a flat.
The psychology of this approach is explained by the fact that the markets are moved by big money ready to lure an inattentive trader into a trap. When a flat is broken out, traders are agitated to enter the market hoping to make money on the further movement but this may be a trap. This moment can be used by large players to close their positions and play in the opposite direction.
A trap to sell
It appears in an uptrend when at the market high the price stabilizes in a small flat 5-10 days long. This is followed by a strong breakout upwards, and the day closes above the upper border of the flat. If after that the price goes down and in 1-5 days finds itself lower than the low of the breakout day – open a position to sell with a Stop Loss behind the high of the breakout day.
A trap to buy
It appears in a downtrend after the price forms a small flat during 5-10 days. Then the flat is broken out downwards, the day closes below the last lows. The pattern is triggered if right after the range is broken out, the price starts moving upwards and exceeds the high of the breakout day in 1-5 days. AT this level, open a position to buy with a Stop Loss below the local low.
Bottom line
The trading methods by Larry Williams proved highly efficient as they helped him win the Robbins World Cup trading championship in 1987. You can check on practice if they work as efficiently nowadays. Also, Williams is the author of several trading indicators, such as Williams %R, used in addition to graphic patterns.
According to Larry Williams, successful trading requires attention to psychology and risk management. The market is prone to change, at any time it can reverse and go in the opposite direction. One must always keep an eye on reversal signals and change their positions on time, not focusing on their expectations. Protective orders must always be used. In more detail, the trading methods of Larry Williams are described in his book "Long-Term Secrets to Short-Term Trading".