Using Hidden Divergence Panel (HDP) Indicator in Trading

5 minutes for reading
In this review, we will discuss a useful indicator Hidden Divergence Panel (HDP). This indicator finds hidden divergences on the chart and generates trading signals on their basis. You can buy the latest version of this indicator at the developers official website indicatorvaulthq.com.
Hidden Divergence Panel: what is it based on?
As can be deducted from its name, the Hidden Divergence Panel indicator finds hidden divergences on the chart. A hidden divergence is the difference between the price chart values and the values of the chosen indicator (oscillator); it means that the current trend will most likely continue.
The principle underlying a hidden divergence is similar to that of a normal direct divergence; only it should be looked for not counter but along with the current trend. The signals of a hidden divergence may be called more correct from the point of tech analysis because positions are opened in the direction of the actual trend.
Hidden Divergence Panel is a holistic trading system that generates trading signals based on hidden divergences. For searching for and detecting hidden divergences, the MACD indicator is used. For trend filtration, two EMAs are used. The landmarks for Stop Losses and Take Profits are provided by the ATR volatility indicator.
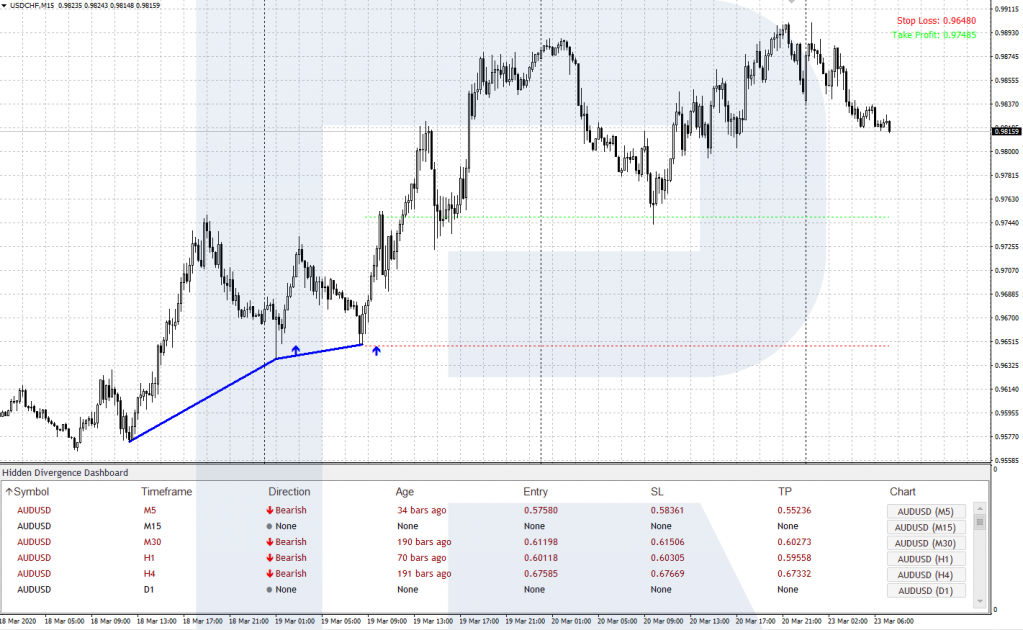
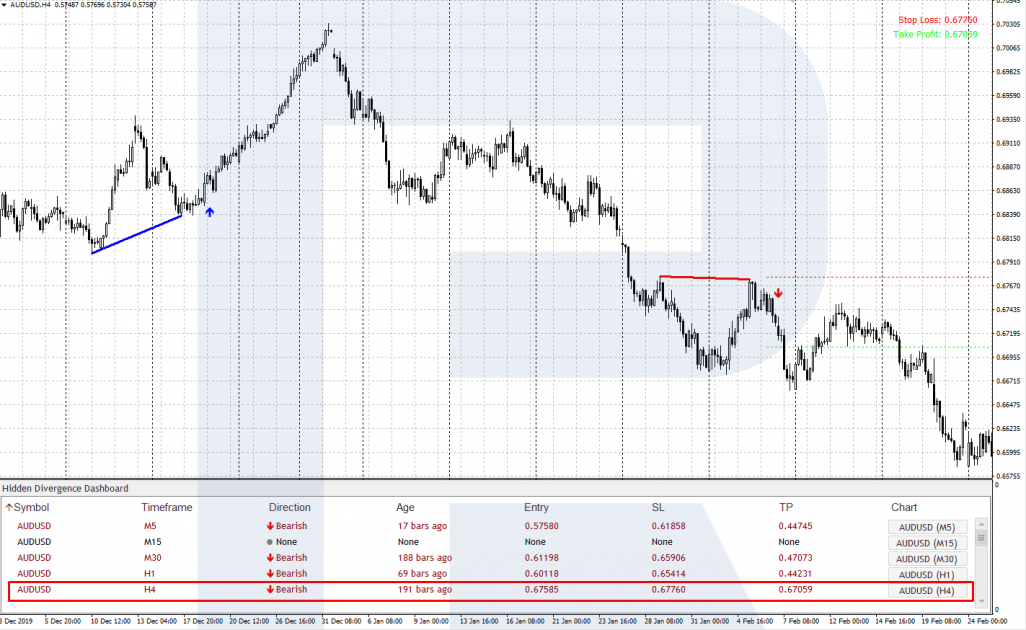
All information about hidden divergences found by the HDP is displayed right on the price chart, as well as on a special informational panel – Hidden Divergence Dashboard, situated right under the price chart. Clicking the desired instrument in the Chart, you can switch to the chart with a hidden divergence found right away.
Installing and setting up Hidden Divergence Panel
The HDP indicator can easily be found on the Net. To start using it, download the file with the indicator and copy it in MetaTrader 4. To do it, pen the Main Menu in MT4, proceed to File – Open data catalogue – MQL4 – Indicators and copy the file of the indicator to this folder, then restart the terminal.
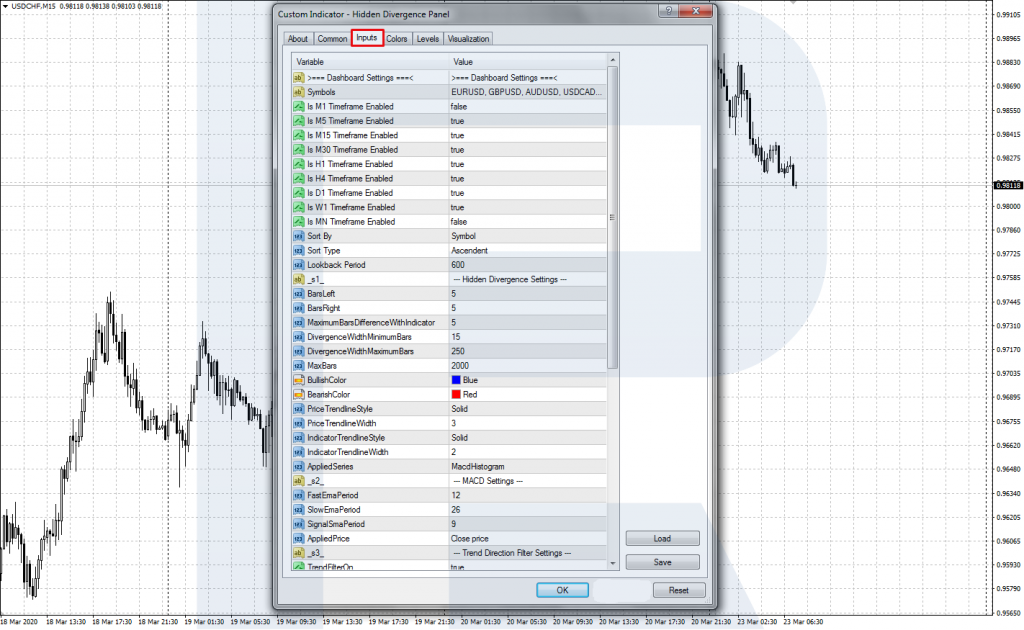
Then add the indicator to the price chart via the Main Menu of the terminal: Insert – Indicators – User – Hidden Divergence Panel. In the window with the indicator settings, you can change Input data. The settings are divided into several blocks.
Dashboard Settings
- Symbols is the field for currency pairs and other financial instruments, on which hidden divergences will be searched for. They must be written in the same way as in the terminal.
- Is (M1…WN) Timeframe Enabled sets the timeframes for searching for signals. “true” switches on the timeframes for searching for hidden divergences, “false” switches them off.
- Sort By and Sort Type are sorting principles; by default, they are sorting by currency pairs and timeframes in ascending order.
- Lookback Period sets the size of the period on which the indicator searches for trading signals.
Hidden Divergence Settings
- DivergenceWithMinimumBars is the minimal threshold of the search in bars.
- DivergenceWithMaximumBars is the maximal threshold of the search in bars.
- MaxBars is the depth of history in bars.
Other functions of this block are secondary, setting the placement of entries, their color and format.
MACD Settings
- FastEmaPeriod sets the period of the fast EMA.
- SlowEmaPeriod sets the period of the slow EMA.
- SignalSmaPeriod sets the period of the SMA.
- Applied Price sets the type of the price used.
SL and TP Inputs
- SL detection distance (bars) is the number of bars for placing the SL.
- ATR Period for SL shift is the period of the ATR indicator.
- SL shift coefficient (from ATR) is the coefficient for calculating the SL from the ATR value.
- TP coefficient (from SL) is the coefficient for calculating the rate of the TP and SL.
Alert Settings
In this block, various ways of notifying the trader about the emergence of trading signals are collected. “true” switches the chosen alert on, “false” switches it off.
Hidden Divergence Panel trading signals
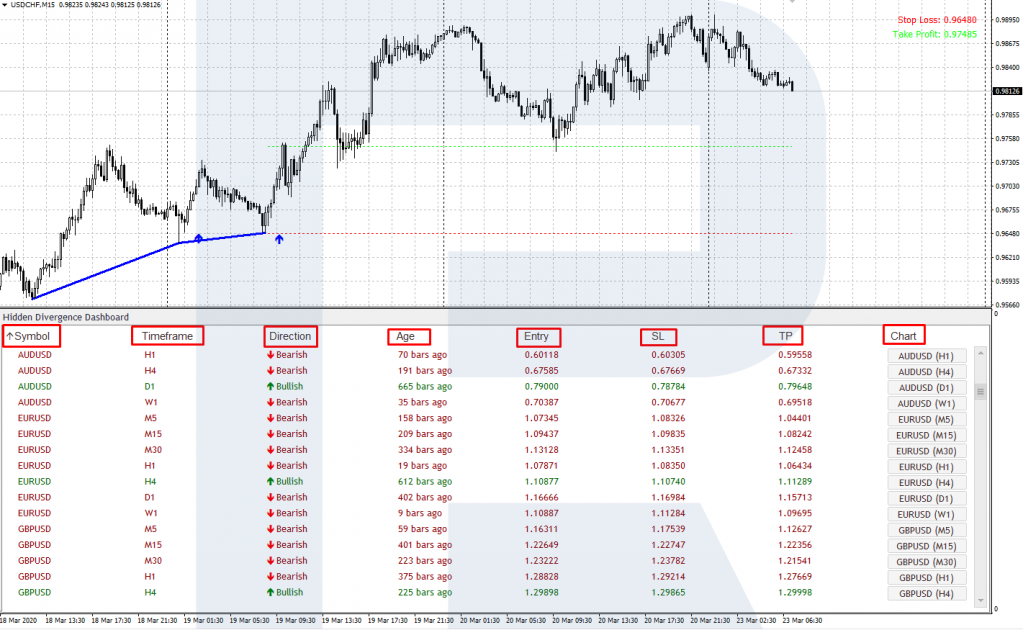
All trading signals of the indicator are displayed on the Dashboard. There are the following parameters on it:
- The Symbol of the currency pair
- The Timeframe on which the signal appeared
- The Directions of the trade
- Age: the parameter shows how many bars ago the signal appeared
- The Entry level
- The SL level
- The TP level
- Chart: switch to the chart with the trading signal
Example of a signal to buy
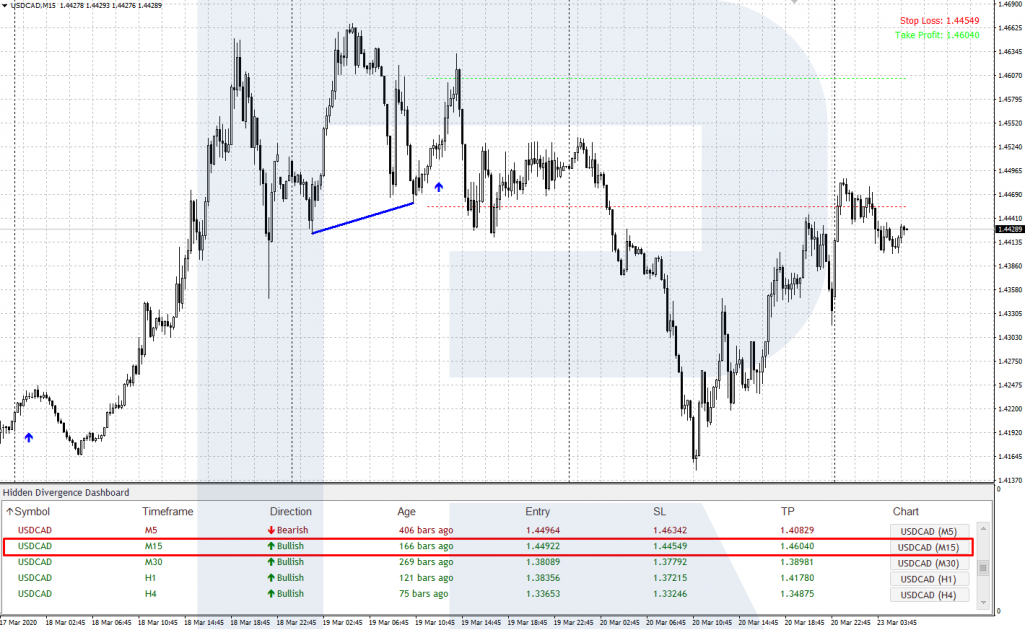
Let us have a look at a signal on the M15 of the USD/CAD chart. Click “Chart” to switch to the chart of the currency pair. A blue line indicates two lows on which the signal to buy has formed. A blue arrow indicates the entry point for a buy; the SL and TP are marked with dotted lines.
Example of a signal to sell
Let us have a look at a signal on the H4 of the AUD/USD chart. Switch to the chart with the signal by clicking “Chart”. A red line links two highs on which the hidden divergence signaling to sell has formed. A red arrow indicates the entry point; the SL and TP levels are marked with dotted lines.
Bottom line
The Hidden Divergence Panel indicator is an independent automatic trading system that generates trading signals based on hidden divergences. According to the settings, the indicator finds entry points and recommends SL and TP levels. However, the indicator is no Grail, so your trades will not always be profitable.
To make the signals of HDP more reliable, I recommend using the indicator alongside technical and fundamental analysis. I.e. you need to find out what trend is on the market now, where the important support and resistance levels are, when significant fundamental news are due. And based on this data, you may choose suitable trading signals.

