Trading with Ultimate Oscillator

5 minutes for reading
This overview is devoted to the working principles and trading signals of Ultimate Oscillator. It was created and used by a successful market trader Larry Williams.
How does Ultimate Oscillator work?
Ultimate Oscillator is a technical indicator belonging to the group of normalized oscillators. It was designed by the legendary market guru Larry Williams. Creating this indicator, he addressed the problem of false signals, which is the issue of many other oscillators. To calculate the indicator, he used the weighted average of three oscillators with different periods.
Hence, Ultimate Oscillator is calculated by not one but three different periods (original settings are 28, 14, and 7). Each one has its own “weight”. The largest one “weights” the most, as with the Exponential Moving Average (EMA). Williams claimed that because of using several periods of different “weights”, the indicator becomes more stable in the face of false signals.
Ultimate Oscillator assesses the current oversold/overbought state of the asset and in trading is used quite similarly to other well-known oscillators: the Relative Strength Index and the Stochastic Oscillator. The overbought area gives signals to sell, while the oversold area gives signals to buy. In a prominent trend, try to use the indicator by the trend only.
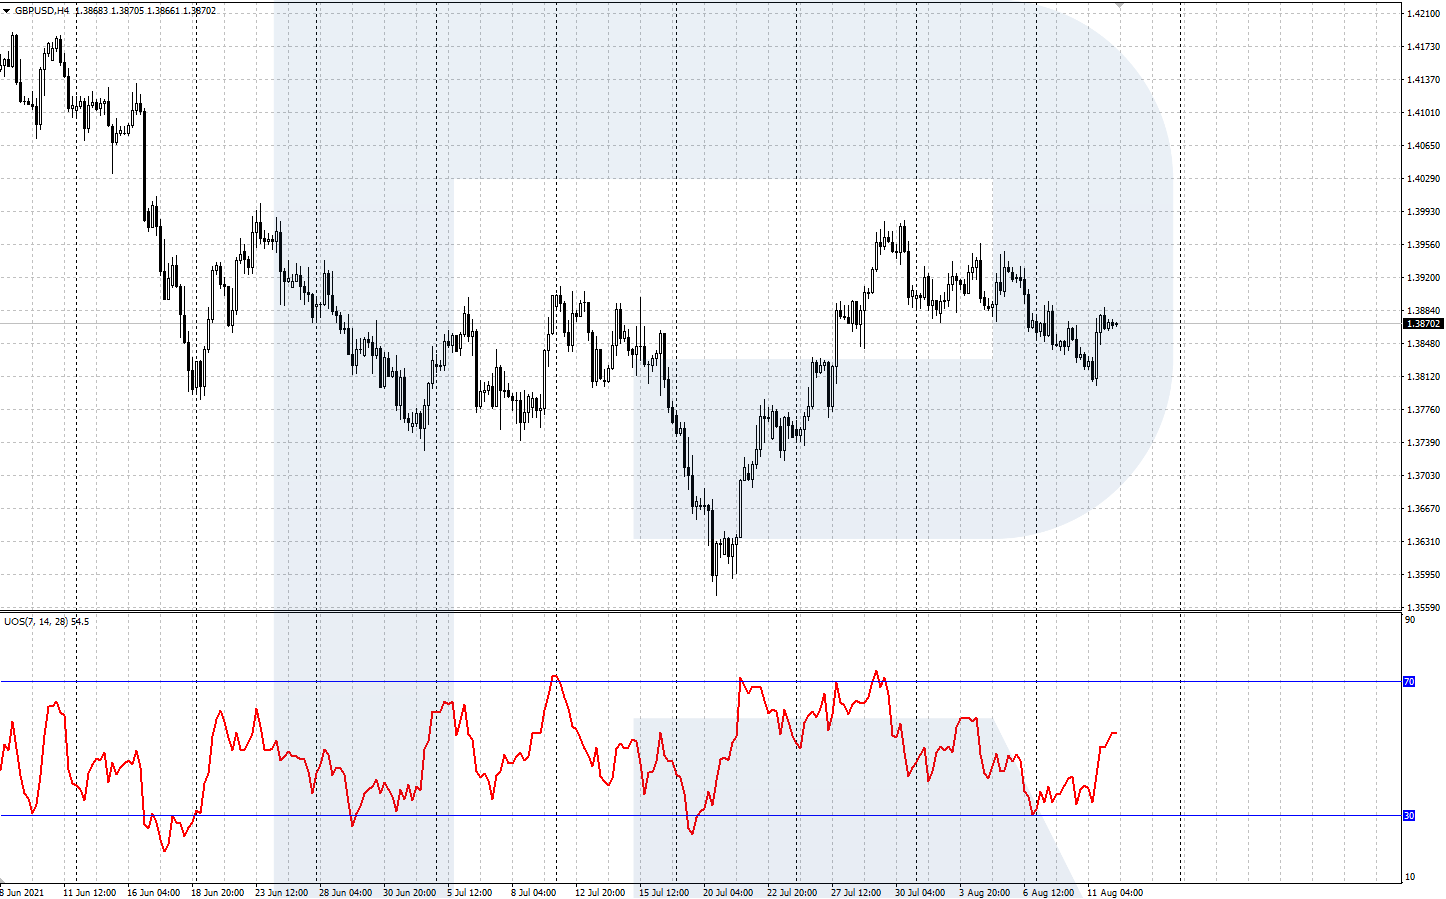
Ultimate Oscillator appears in a separate window under the price chart. The indicator looks like one main line fluctuating between 0 and 100. At 30 and 70, there are signal lines indicating the oversold (0 to 30) and overbought (70 to 100) areas.
Installing and setting up the indicator
To install the indicator to the MetaTrader 4 terminal, download the installation file by the link at the end of the article and copy it to the Indicators folder. Via the Main Menu, go to Files/Open Data Catalogue/MQL 4/Indicators. Copy the file o this folder and restart the terminal.
Then Ultimate Oscillator will appear on the list of User indicators, and you will be able to add it to the price chart via Insert/Indicators/User/Ultimate Oscillator. Or just left-click and drag it by the mouse from the Navigation window.
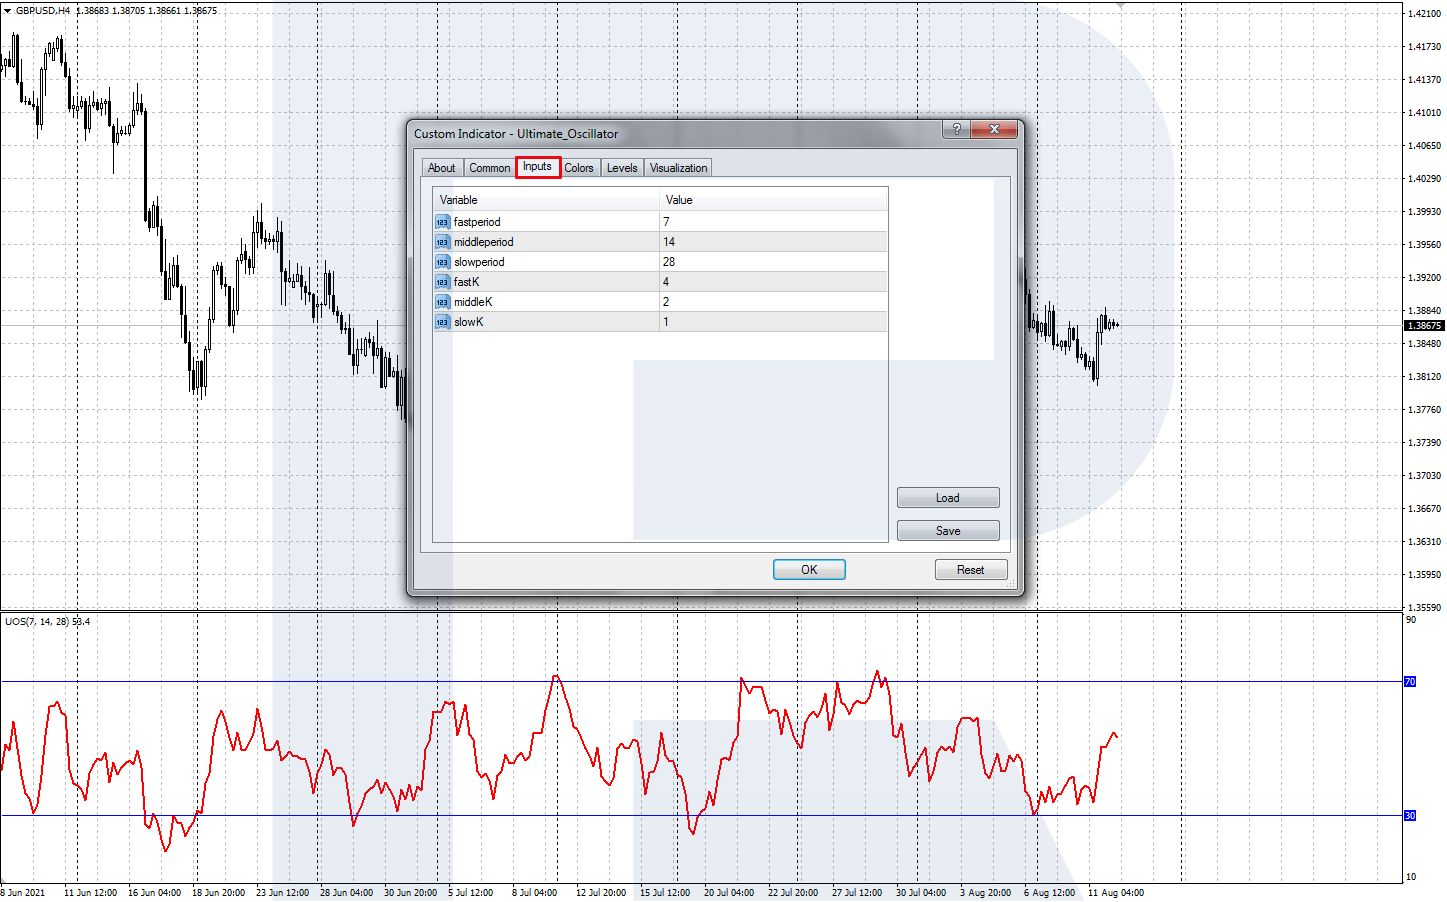
In the Entry Parameters, you can set up the following characteristics of the indicator:
- Fastperiod is the smallest and fastest period of the indicator. The default setting is 7.
- Middleperiod is the medium period of the indicator. The default setting is 14.
- Slowperiod is the longest and slowest period of the indicator. The default setting is 28.
- FastK is the coefficient (“weight”) of the smallest period. The default setting is 4.
- MiddleK is the coefficient (“weight”) of the medium period. The default setting is 2.
- SlowK is the coefficient (“weight”) of the longest period. The default setting is 1.
Normally, Ultimate Oscillator is used with the original default settings. With time, you may start experimenting with the parameters and compare the results.
Trading signals of Ultimate Oscillator
Let us have a look at the tow main signals of the oscillator: escaping the oversold/overbought area – and a divergence.
Exiting the overbought/oversold area
This is a classical trading signal (characteristic of many oscillators) that appears when the main line escapes the overbought or oversold area simultaneously with the price reversal.
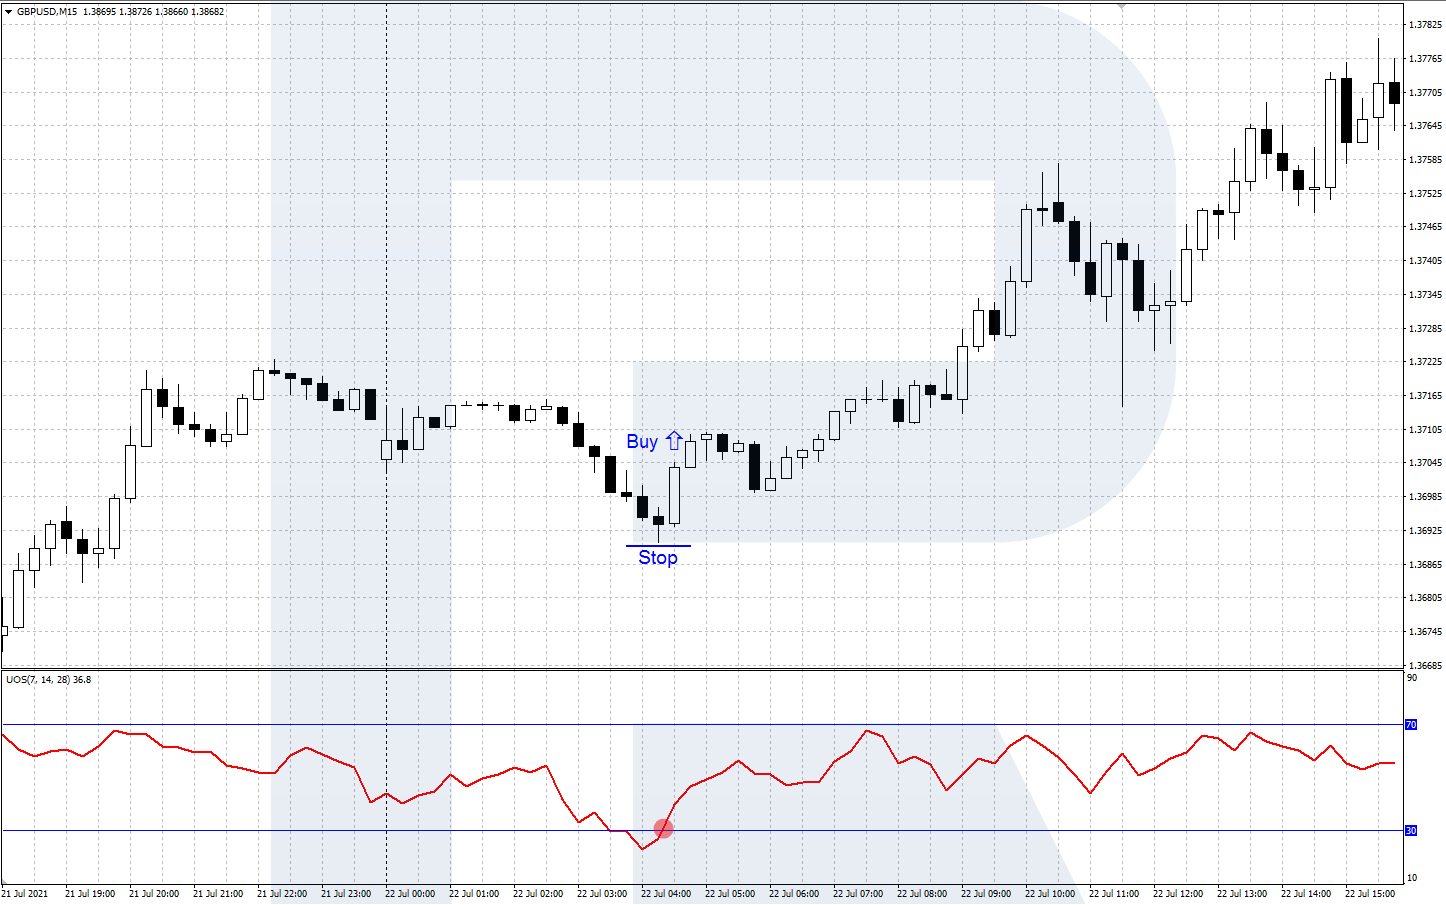
A signal to buy:
- In a descending price movement, the main line of the indicator descended into the oversold area (below 30);
- Then the price reversed, while the indicator line secured above 30;
- Open a buying position, placing a Stop Loss behind the local low at the price chart;
- You can take the profit when the price reaches an important resistance level, the overbought area, or when any evidence of a quotations reversal shows up.
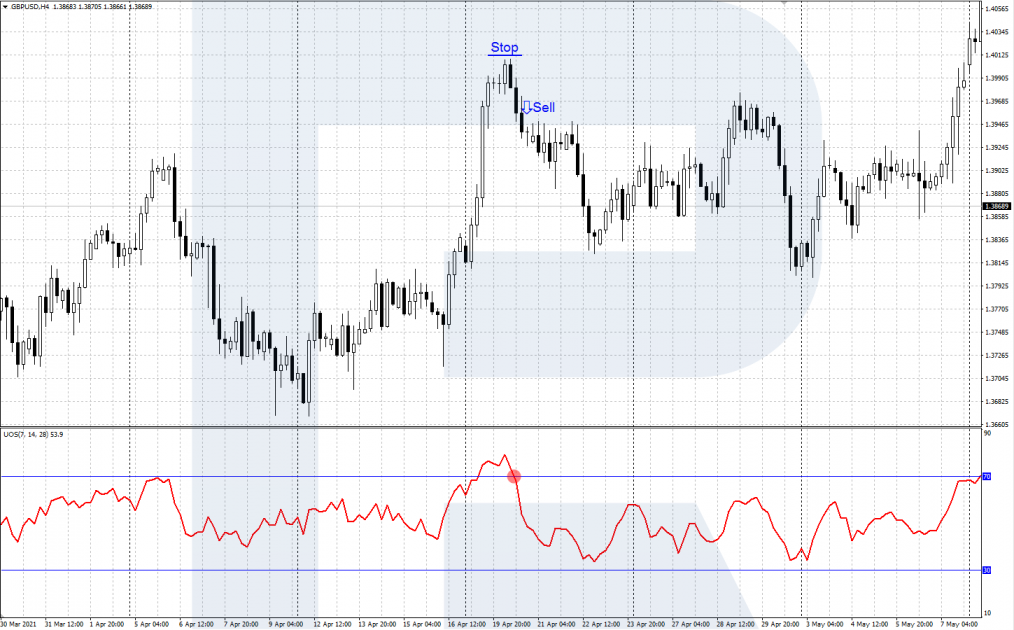
A signal to sell:
- In an ascending price movement, the main line of the indicator ascended into the overbought area (above 70);
- Then the price reversed downwards, while the indicator line descended below 70;
- Open a selling position, placing a Stop Loss behind the local high at the price chart;
- You can take the profit when the price reaches a strong support level, the oversold area, or when any evidence of a quotations reversal shows up.
A divergence of the indicator and the price chart
A divergence of the indicator and the price chart signals about a possible correction or even a reversal of the current trend.
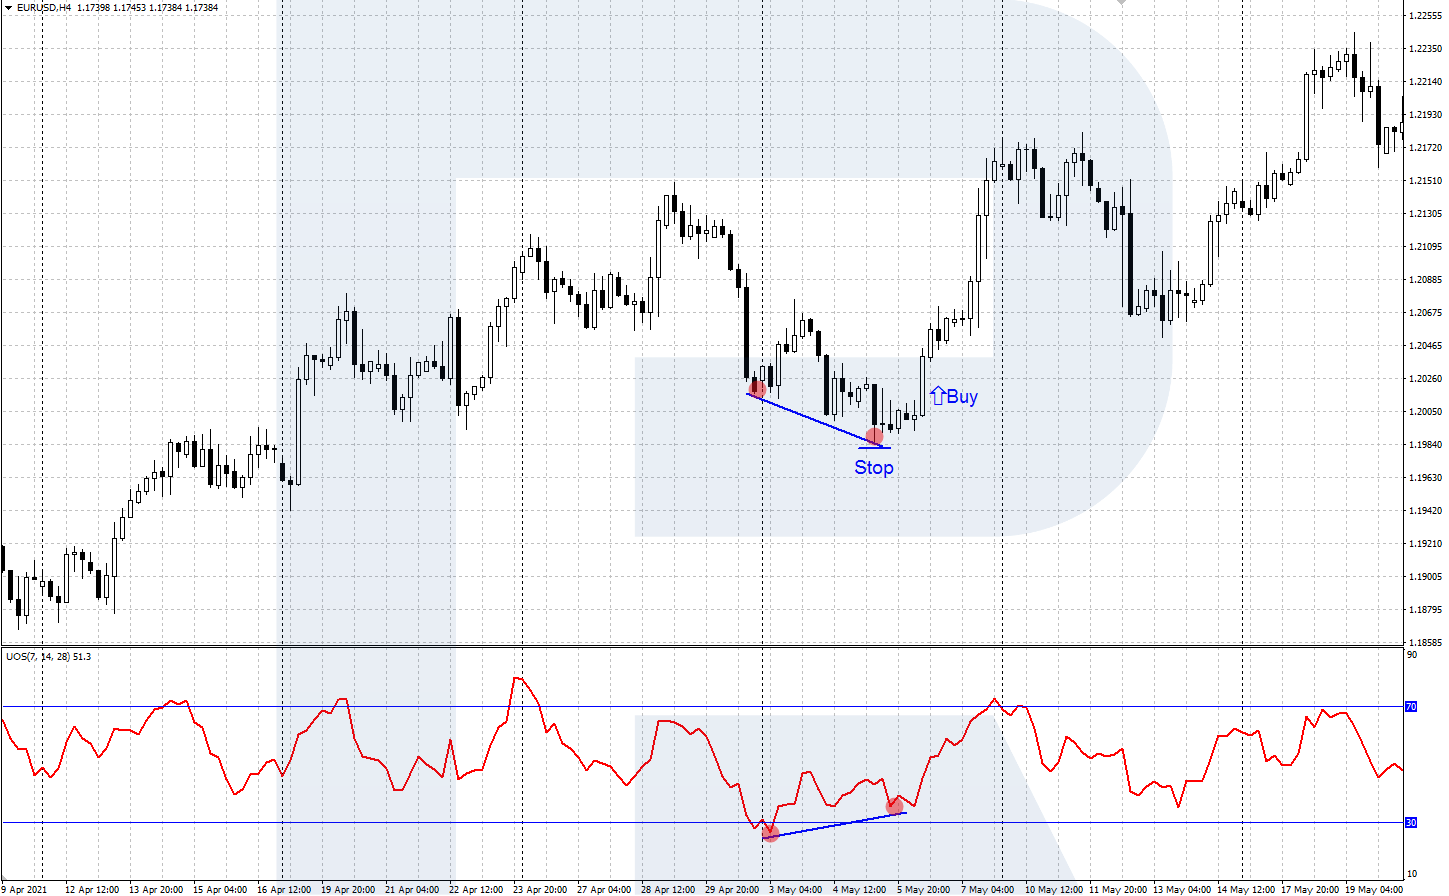
A signal to buy:
- The signal appears when the price chart has formed some lows, so that the last one is lower than the previous one. At the same time, the indicator line has also formed some lows, only its last low is higher than the previous one. This is the divergence we are looking for.
- Open a buying position with an SL behind the nearest price low.
- Take the profit when the indicator reaches the overbought area, or when the growth expires, and the price reverses.
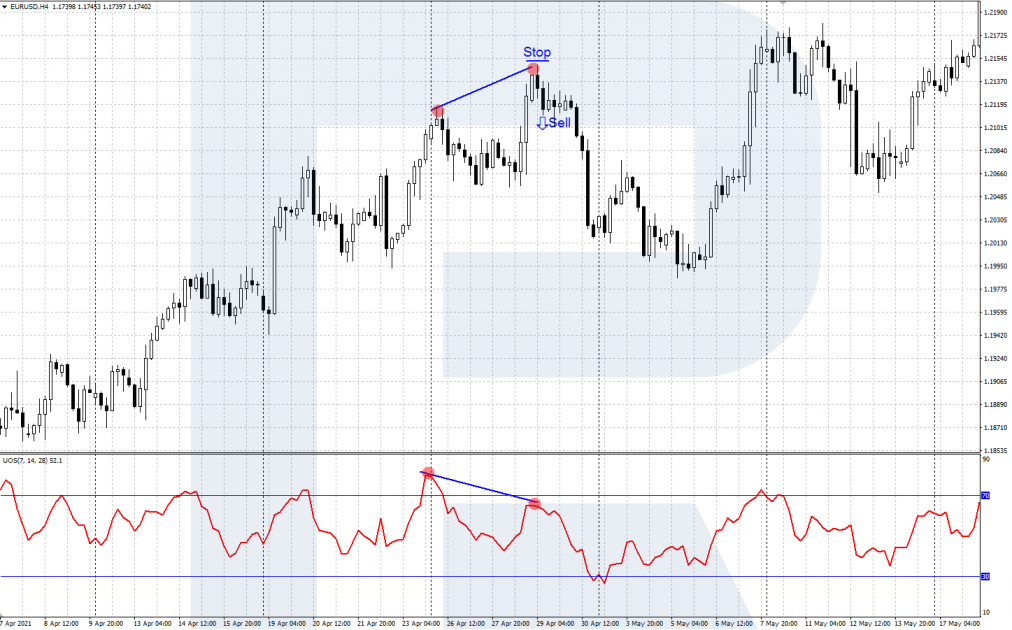
A signal to sell:
- The signal appears when the price chart has formed some highs, so that the last one is higher than the previous one. At the same time, the indicator line has also formed some highs, only its last high is lower than the previous one.
- Open a selling position with an SL behind the nearest price high.
- Take the profit when the indicator lowers itself into the oversold area, or when some evidence of a reversal upwards appears.
Bottom line
Ultimate Oscillator was designed by a famous market trader Larry Williams. It works similarly to other famous oscillators, but thanks to complicated calculations with three different periods Ultimate Oscillator is considered to give less false signals.
This indicator (as well as other oscillators) is recommended to be used alongside trend indicators and tech analysis instruments.


