Victory Trading Strategy: Real Scalping on Minute Frames

7 minutes for reading
Today, we will speak about an unusual strategy for fast trading or so-called scalping. The idea is to trade on small timeframes, entering the market quickly and exiting it with a small profit, opening several positions simultaneously. This type of work requires good reaction and little thinking about the current situation to be able to make decisions on the spot. The Victory trading strategy was first described in detail in 2012.
Victory trading strategy description
For trading, the EUR/USD pair is used, but you equally may try other ones. I remind you that the best way to use any strategy is to customize it. However, you should start with default settings to get acquainted with the strategy and find out whether this aggressive way of trading suits you.
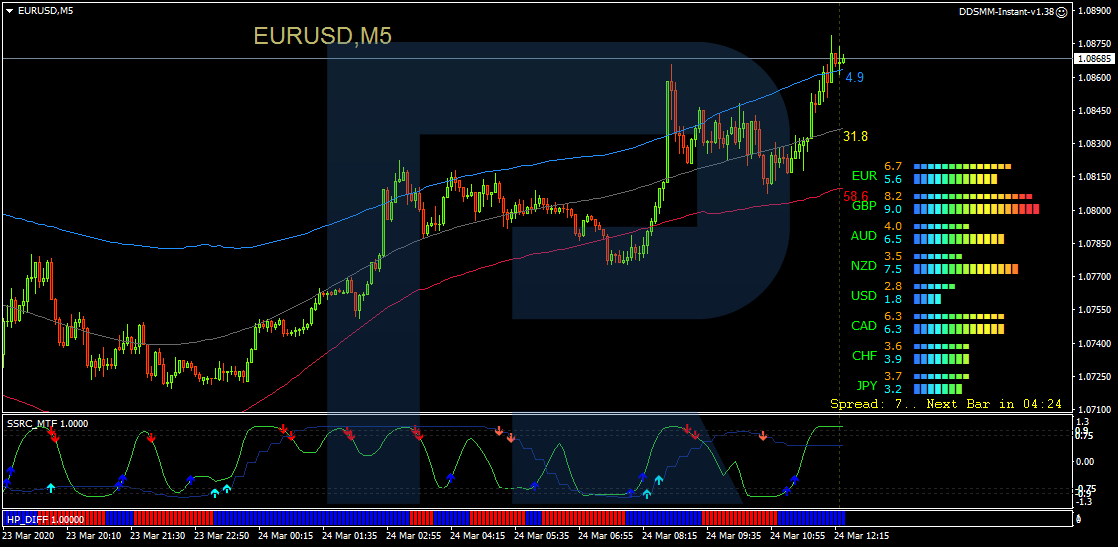
The timeframes for trading are M1 and M5. To enter the market use M5, while on M1, open trades.
The best time for work is sessions with high volatility, viz the American and European ones. Unfortunately, there is not much movement at night, so trading at this time will not be profitable.
What indicators does the Victory trading strategy require?
The strategy requires several unique indicators to show its best. After installation along with several templates, the trader opens to windows – M1 and M5 – not to waste time switching between them. And now, let us discuss the main instruments that the successful use of the Victory trading strategy requires.
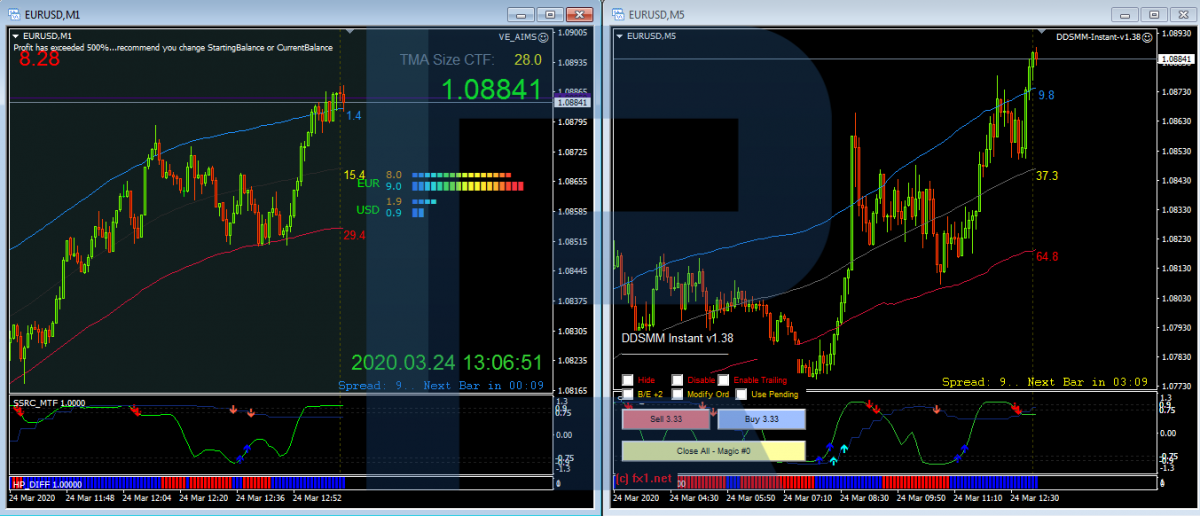
The TMA indicator
TMA stands for Triangular Moving Average. It is based on a Moving Average; on the chart, the indicator looks like lines one under the other. It is quite easy to use: when the lower border is touched, we may expect a bounce and reversal to the upper border. And if the prices test the upper border, a reversal to the lower border may follow.
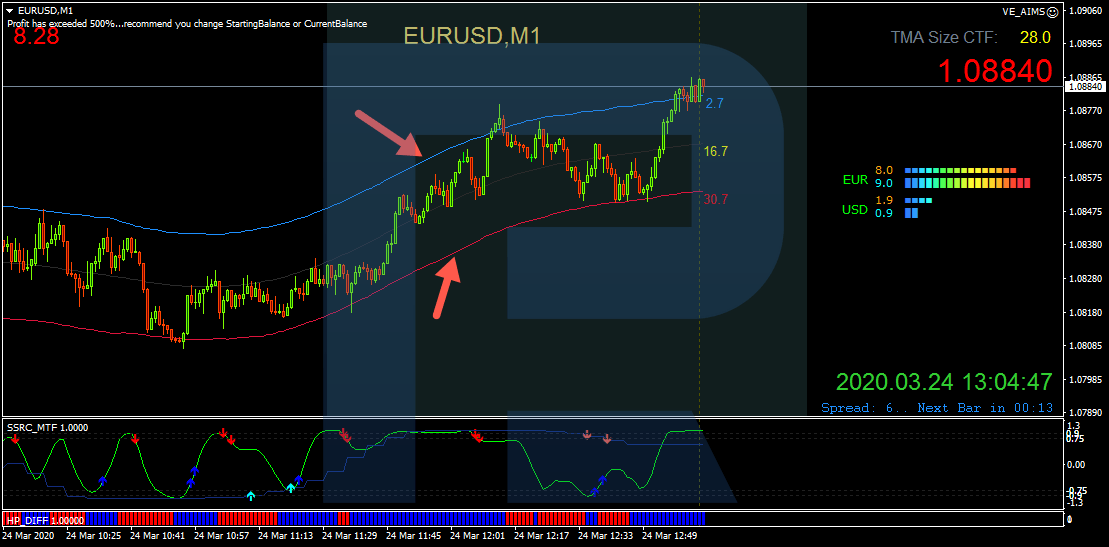
Many traders compare this indicator to Bollinger Bands; indeed, they have something in common. The strategy implies using a Take Profit of five points, so, if the price comes too close to the TMA border, such a trader should better be skipped. Similar approaches are used with Bollinger Bands: we buy at a bounce off the lower border and sell at a bounce off the upper one.
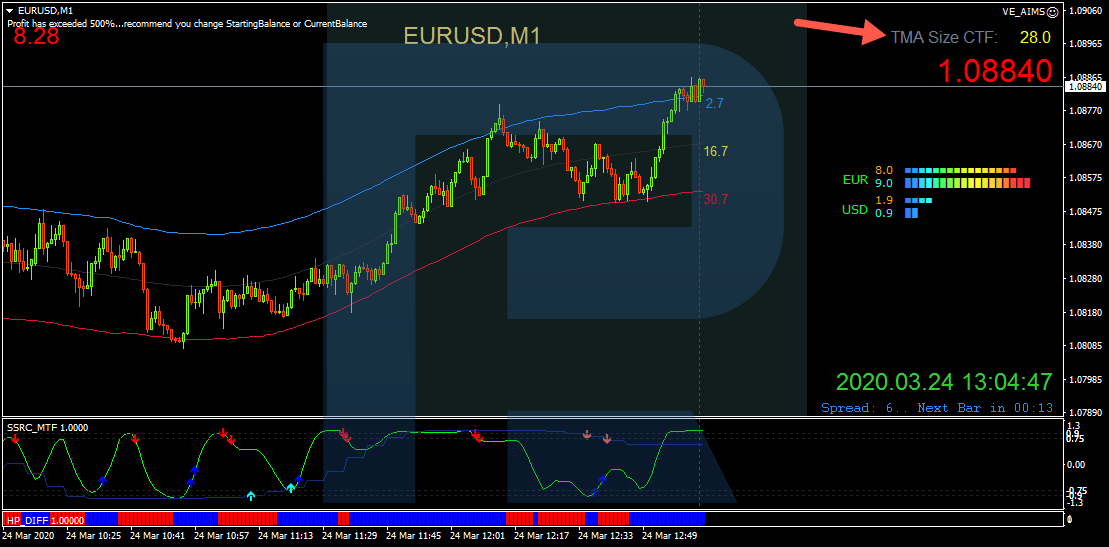
The TMA Size CTF indicator
This indicator defines the width of the channel. The system requires trading bounces off the borders of the floating channel, so if the channel narrows significantly, the prices will most probably try to break one of the borders forcefully. The rule of the system is to skip trades when the channel width is less than 10 points.
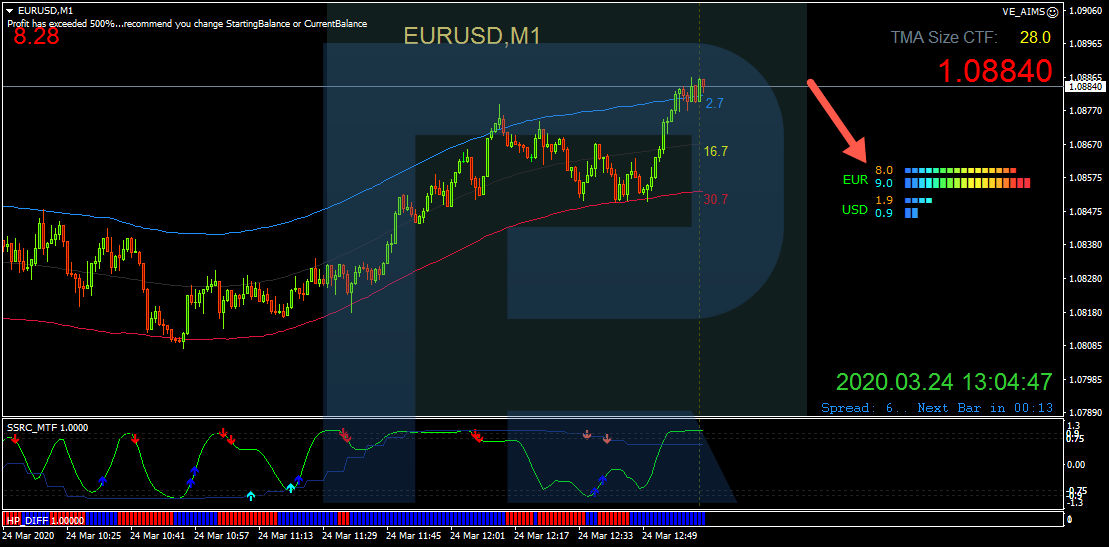
The Currency Power Meter indicator
The indicator demonstrates the power of a currency in a currency pair. If it indicates that the euro is more powerful than the dollar, we may expect the growth of EUR/USD. However, this is just one signal of the system; power assessment without other signals is not enough for entering the market.
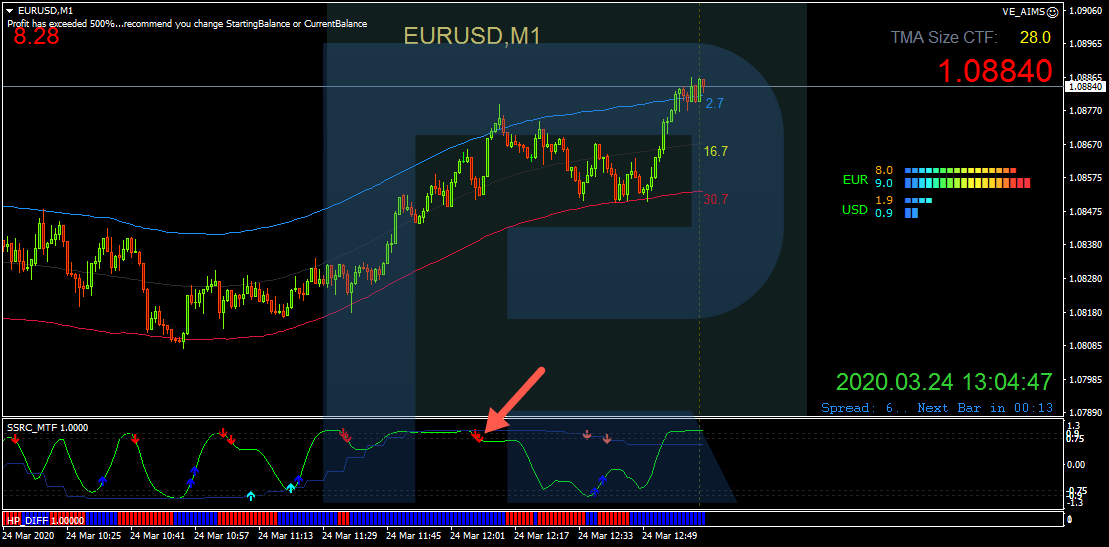
The SSRC indicator
The indicator signals about the current situation on the market. It forms ascending or descending arrows in a separate window. If there is an arrow upwards, we may expect growth, and an arrow downwards forecasts a decline. Two arrows in one direction formed on two charts simultaneously make the signal stronger.
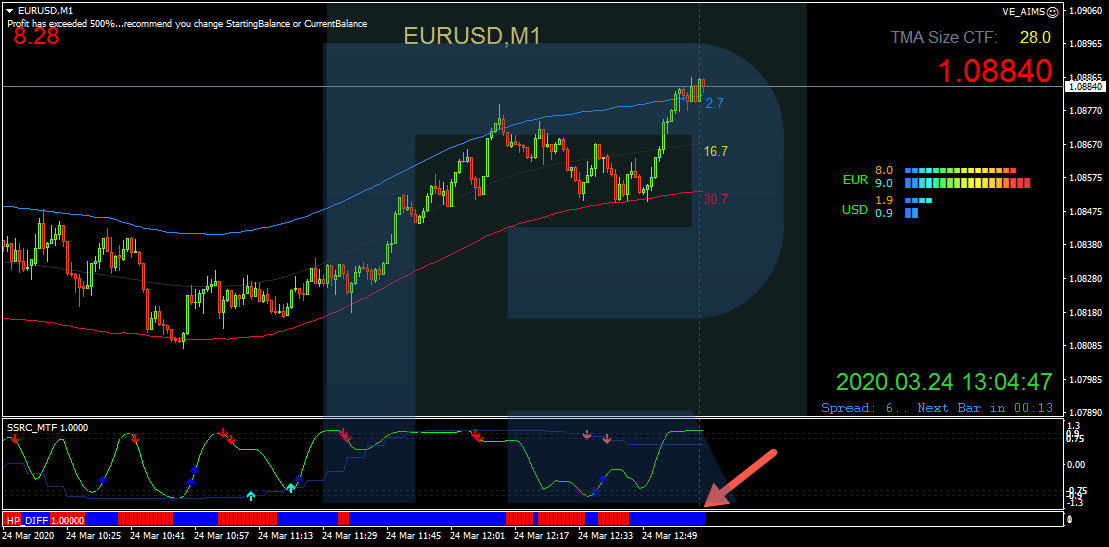
The HP DIFF indicator
This indicator is situated right at the bottom of the chart, looking like vertical bars colored blue or red. It is used as an additional signal to enter the market when the color of the indicator changes.
A buying trade with Victory trading strategy
To open a trade by this strategy, several rules are to be followed:
- The TMA channel on M1 must be horizontal or ascending. It must be noted that signals are executed better when the channel is directed upwards.
- The width of the TMA channel is 10 points or more. Thus we can assess the potential of the market movement. If the channel is narrower, the probability of a bounce is lower.
- The price tested the lower border of the TMA channel and started pushing off upwards.
- Currency Power Meter indicates that the euro is more powerful than the dollar or their power is equal.
- SSRC formed an arrow-shaped channel aimed upwards. The same arrow on M5 makes the signal stronger.
- On M5, the price is closer to the lower border of the channel or in its middle. However, an important condition is its proximity to the upper border: if the prices are too close to it, such a trade should be skipped.
- There is no important news on the economic calendar.
If the market complies with all these conditions, a buying trade may be opened with a Stop Loss 15 points below the entry point and a TP of 5 points. To exit the position, you can additionally look at the HP DIFF indicator and exit at the moment of the color change.
Let us look at the real example of opening a buying position. As we see, on M1 of EUR/USD, the price has pushed off the lower border of the TMA channel. The channel itself is ascending.
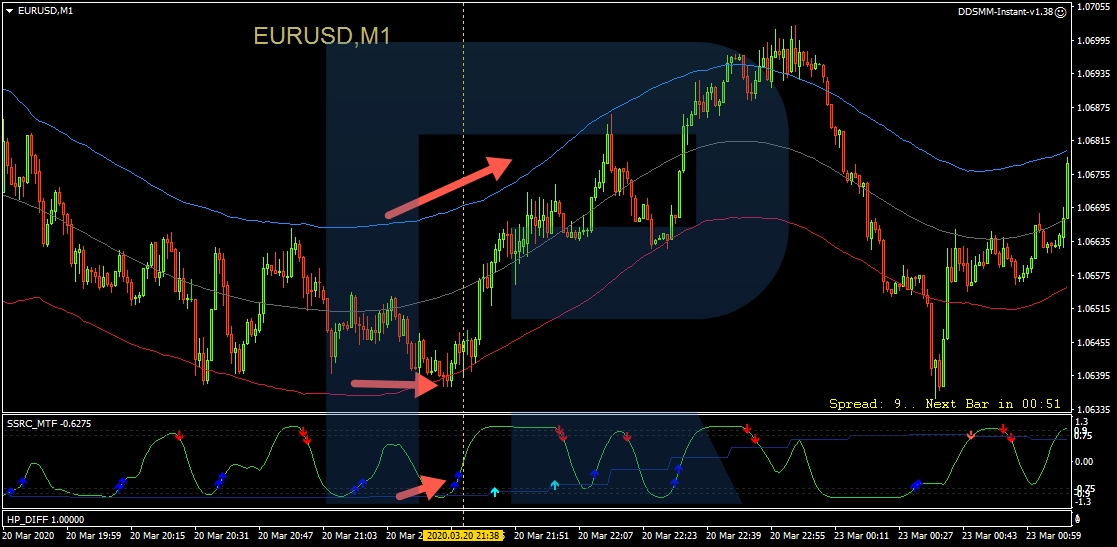
The width of the channel is about 30 points. Unfortunately, TMA Size CTF shows the current situation only, so we cannot assess it historically. Same with Currency Power Meter, it cannot show the power at that moment, but let us imagine it was by the rules.
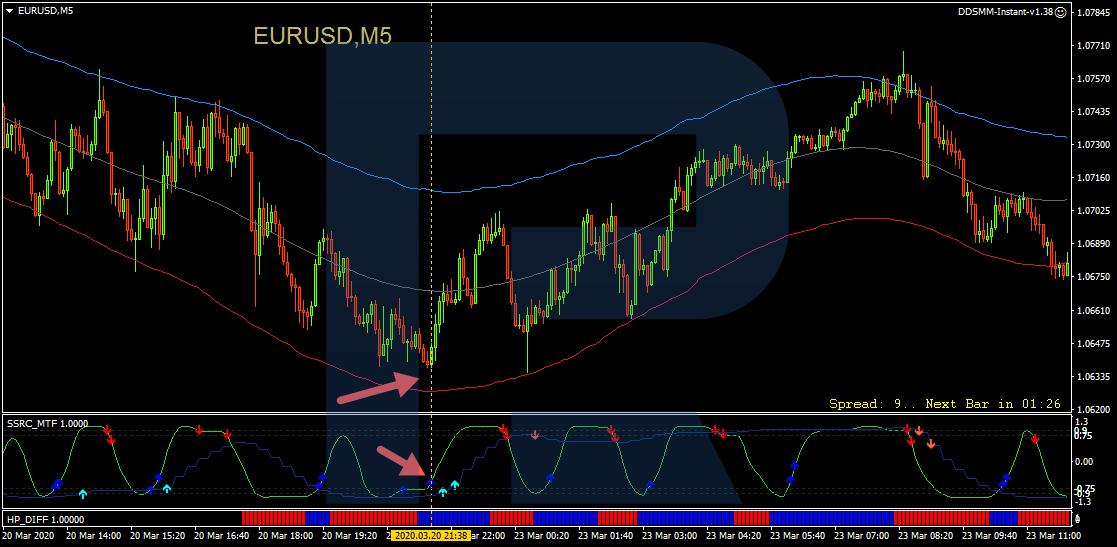
Then, there is an ascending arrow on SSRC. We switch to M5, here, the price is near the lower border of TMA, and there is also an arrow.
A selling trade by Victory trading strategy
To open a selling trade by this strategy, we need the same rules, only reversed:
- The TMA channel on M1 must be horizontal or aimed downwards. Here, again, the signal of the channel aimed downwards is executed better.
- The width of the TMA channel is 10 points or more. Thus we can assess the potential of the market movement.
- The price tested the upper border of the TMA channel and started headed downwards, signaling pressure from sellers.
- Currency Power Meter indicates that the euro is less powerful than the dollar or their power is equal.
- SSRC formed a descending arrow. The same arrow on M5 makes the signal stronger.
- On M5, the price is closer to the upper border of the channel or in its middle. However, an important condition is its proximity to the lower border: if the prices are too close to it, such a trade should be skipped because such a movement may provoke a bounce off the lower border to the upper one.
- There is no important news on the economic calendar.
If the market complies with all these conditions, a selling trade may be opened with an SL 15 points above the entry point and a TP of 5 points. To exit the position, you can additionally look at the HP DIFF indicator and exit at the moment of the color change.
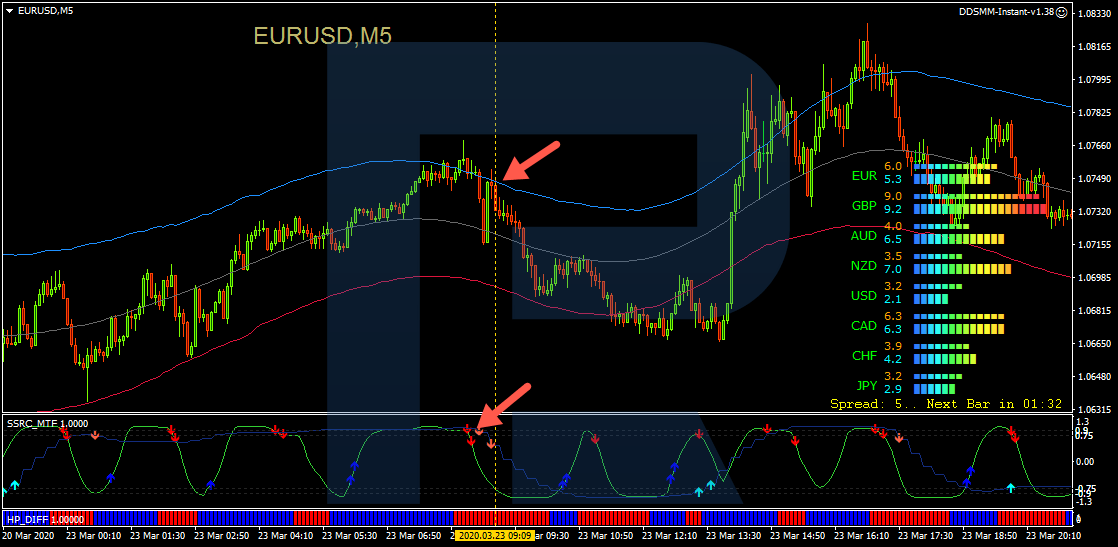
Let us discuss a real example of a selling trade. On M1, the price is bouncing off the upper border of the TMA channel. The channel is aimed downwards. SSRC formed a descending channel.
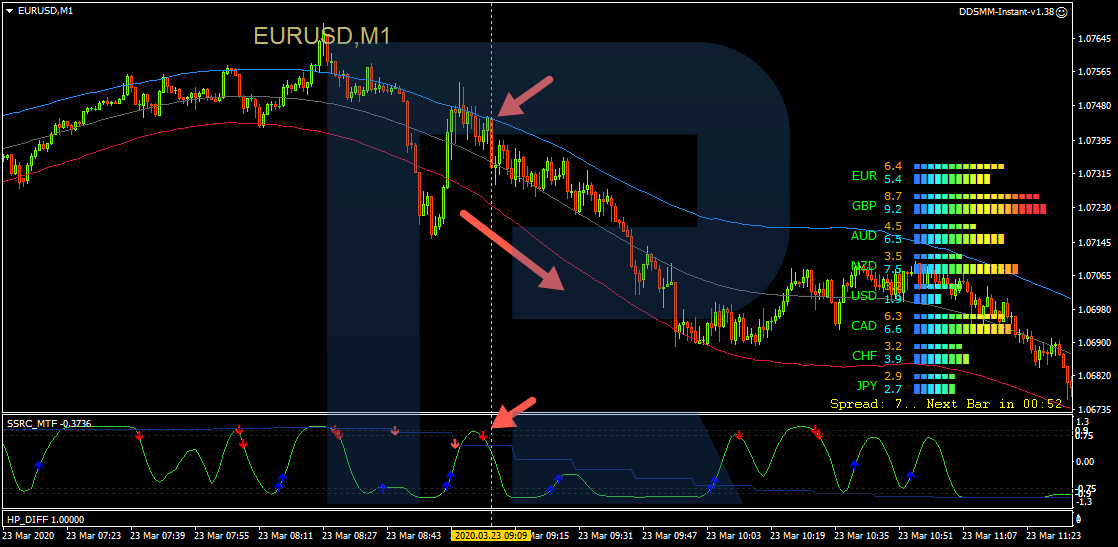
Then, switch to M5, where the price is near the upper border of the TMA channel, and there is also a descending arrow on SSRC.
Closing thoughts
This strategy is a unique example of scalping with clear rules of entering and exiting the market. So, if you prefer entering and exiting the market fast, you may try this strategy. However, keep in mind that this system suits experienced traders who can comply with the author’s rules and stay very attentive. Also, you should keep looking for unique signals not suggested by the system to bring it to a new level.


