Efficient Strategies Based on Stochastic Oscillator

7 minutes for reading
Almost all active traders are acquainted with the Stochastic Oscillator. It is included in almost all trading terminals and features a wide range of settings.
There exist a large number of strategies and systems based on this oscillator. Naturally, some will say that the indicator alone will suffice for trading. However, the Stochastic Oscillator, like many other indicators of this type, tends to give false signals that need filtering.
Practice shows that it is very hard to filter false signals "by eye"; using other indicators for this purpose is much easier. In this article, we will discuss several trading strategies using the Stochastic along with other indicators and single out their advantages and drawbacks.
Strategies using the Stochastic and MACD
As the first example, let us discuss the strategy using the Stochastic Oscillator and MACD. This strategy suits not only experienced traders but also beginners as it does not require any special knowledge or skills.
The MACD is reflected as a histogram and signal line in a separate window under the chart. This indicator belongs to the oscillator group and shows the direction of the trend. If the histogram and signal line both rise above (0), the trend is considered ascending; if they decline below zero, the trend is said to be descending.
The settings are standard for the MT4 and MT5 terminals:
- Fast EMA 12.
- SLow EMA 26.
- MACD SMA 9.
- Apply to Close.

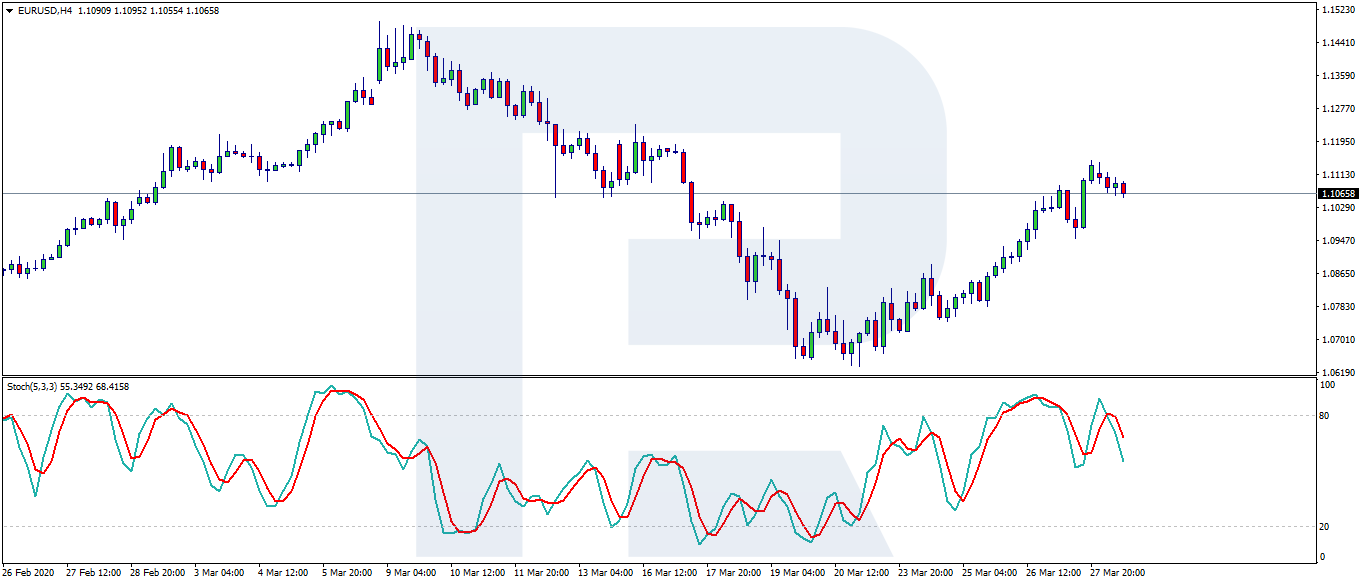
The Stochastic Oscillator opens in a separate window under the chart and looks like two crossing lines moving between the levels. The indicator demonstrates the current oversold and overbought state of the asset.
Thus, if the asset is overbought (there are more buys than sales), the buyers will soon be closing their trades, and the price might decrease. In the case of the oversold state of the market (when there are significantly more sales than buys), things go vice versa: the sellers, closing their positions, provoke the growth of the price, which we will use in trading.
The setting of the indicator are standard:
- %K period 5.
- %D period 3.
- Slowing 3.
- Low/High prices.
- MA Simple.
- Levels at 25 and 75.
- Color in booths indicators is customizable to your taste.
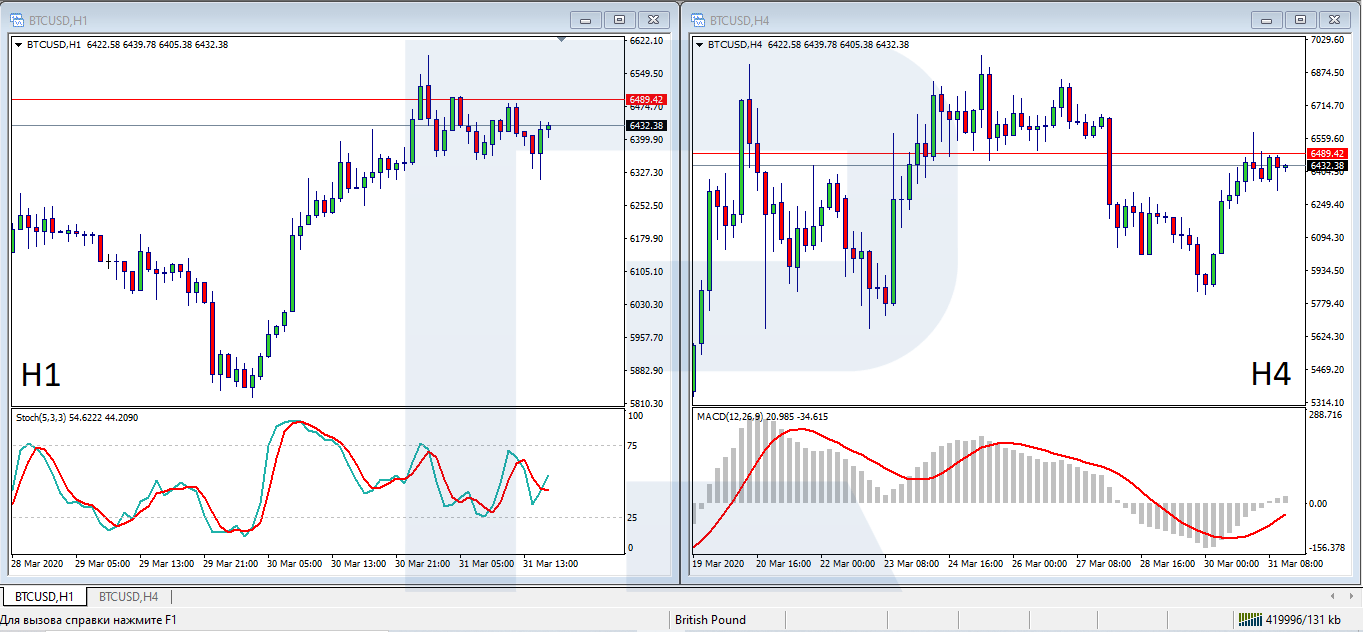
Then we set up the charts with the indicators:
- On H4, we add the MACD.
- On H1, we add the Stochastic Oscillator.
Opening positions by the strategy
A signal to buy and a trade
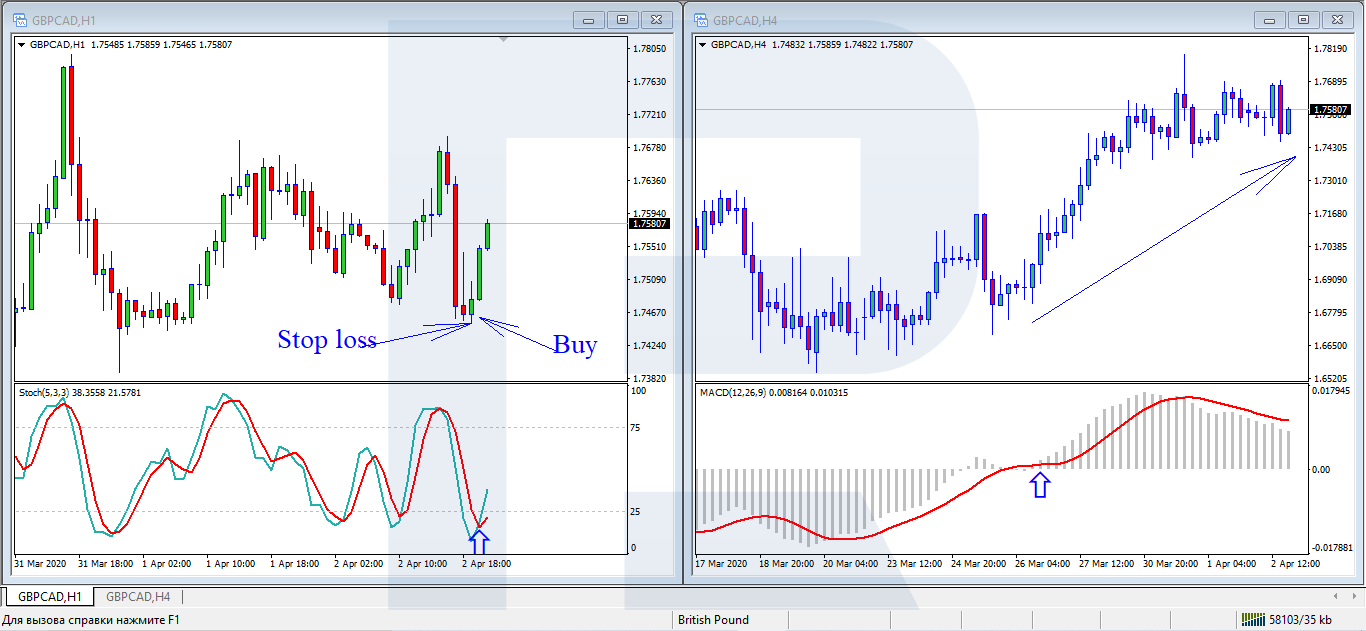
First, analyze the H4 chart with the MACD and define the direction of the current trade. We will open trades along with the trend. For buying, the trend must be ascending, the histogram and signal lines must cross the zero level from below.
Then, we switch to H1 with the Stochastic Oscillator and search for the entry point based on the values of the latter. The indicator must show the oversold state of the market. When the level 25 is crossed from below, open a buying trade. Then place a Stop Loss; there several ways to do it, the optimal one is, to my mind, placing it behind the nearest support level.
A signal to sell
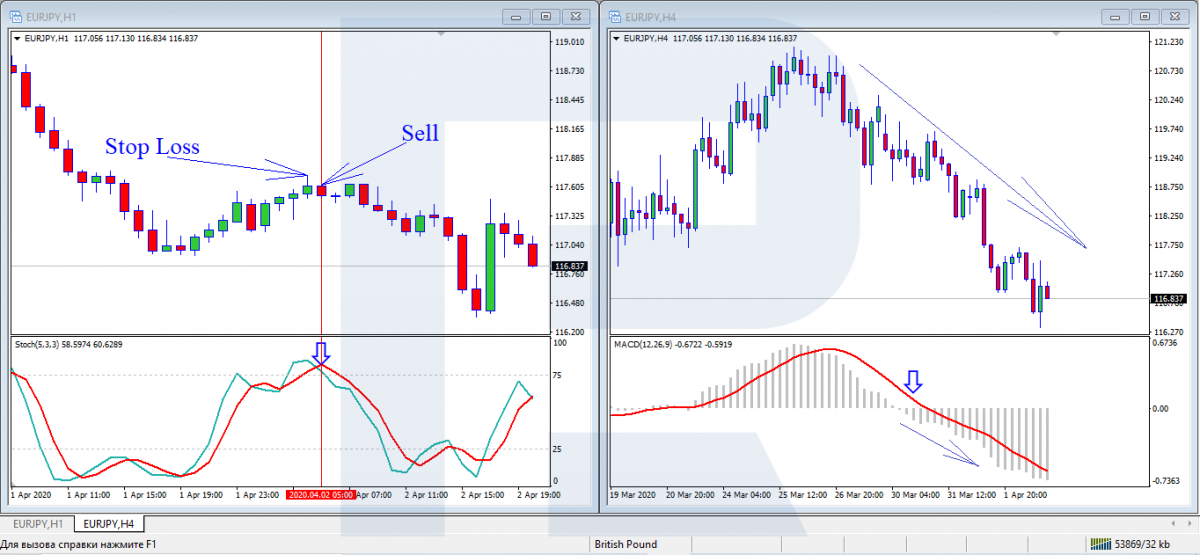
The MACD histogram on H4 is below zero, which means the market trend of this instrument is currently descending. Then we switch to H1 and look for a signal to sell. The Stochastic Oscillator is above 75 in the oversold area. Then we open a selling trade and place a Stop Loss behind the nearest resistance level.
In both trades, a Take Profit is placed at the trader's own discretion. One way to calculate the profitability of the trade is as follows: the TP to SL ratio must be no less than 3:1 (no less than 3 points of profit for 1 point of losses). Another way is monitoring the open position and closing it at the moment when the MACD histogram crosses back the zero line.
The strategy with the Stochastic and a divergence
As the second example, let us discuss the strategy "Stochastic+ divergence".
To put it simply, a divergence is a difference between the indicator and chart values. For example, the price on the chart may be renewing its highs (or lows), while the indicator values decline (or grow), on the contrary. In the pictures, you may see divergences in the overbought and oversold areas.
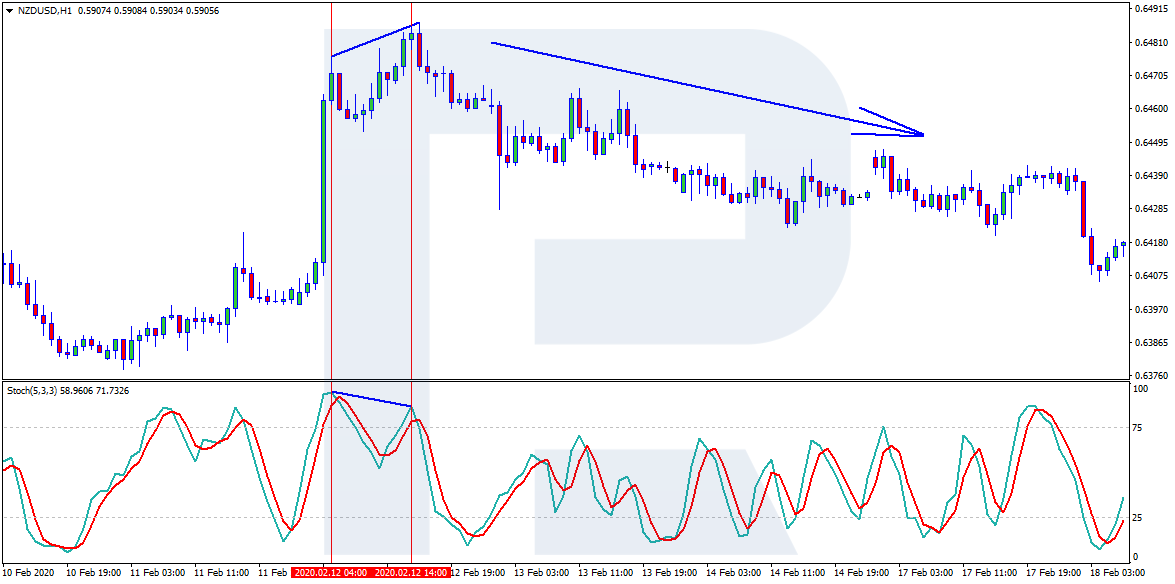
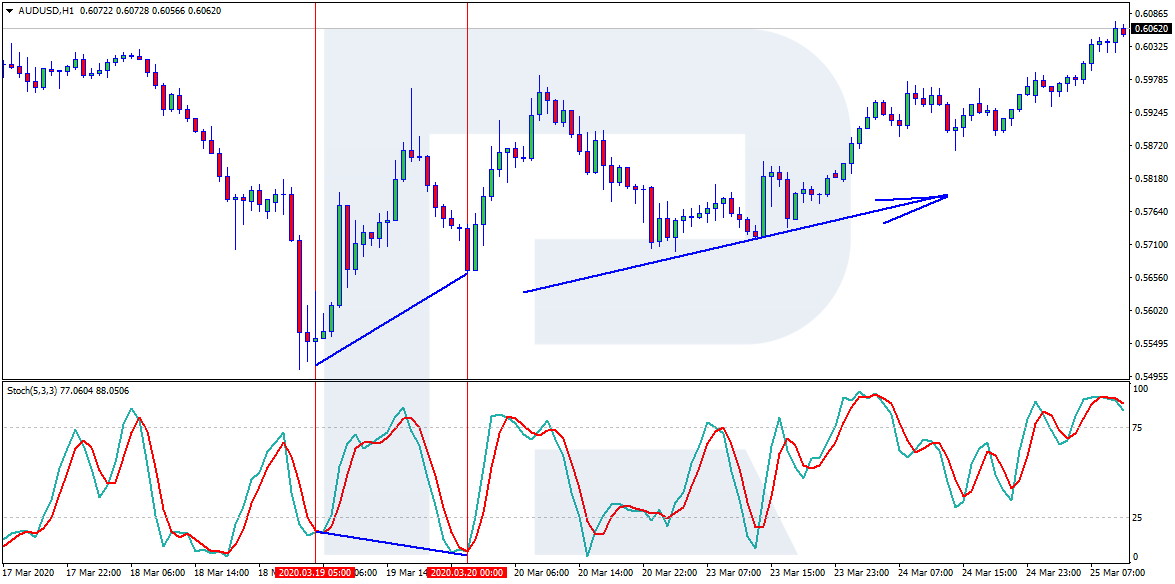
Apart from a divergence, there might appear a convergence. In this case, the highs on the chart decline, while on the indicator, they grow. In the pictures, you may see examples of convergences in the overbought and oversold areas.
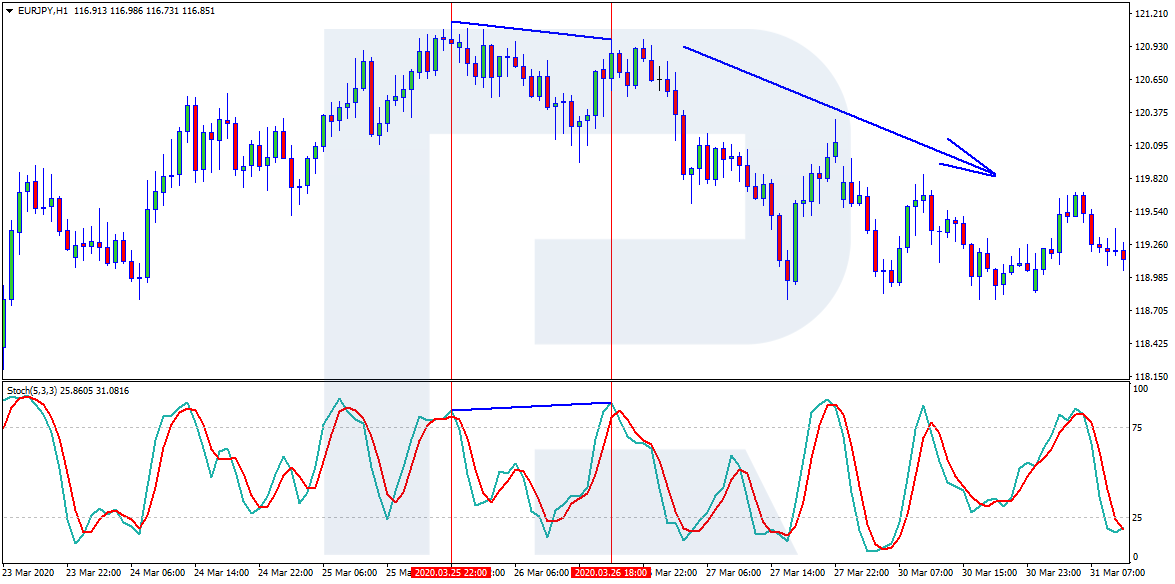
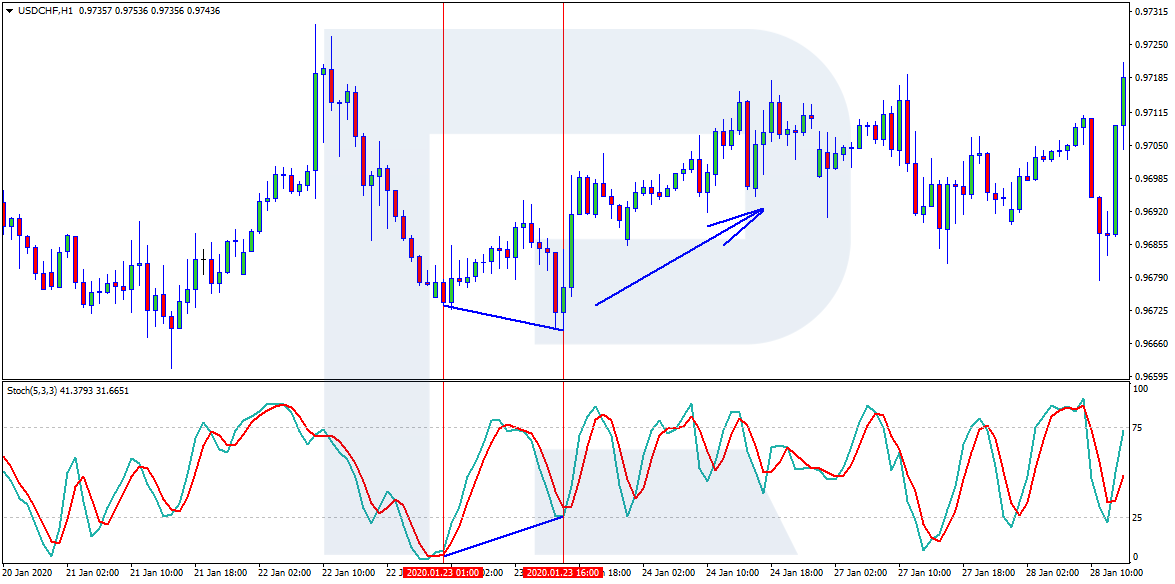
The divergence and convergence look different but the signals work off the same way. As a rule, they form on the chart's highs or lows and signal a trend reversal.
On minute timeframes, they might forecast price corrections. On larger timeframes, a divergence may mean a global change in the trend direction. Practice shows that convergences and divergences work off on all timeframes, so they are universal trading instruments.
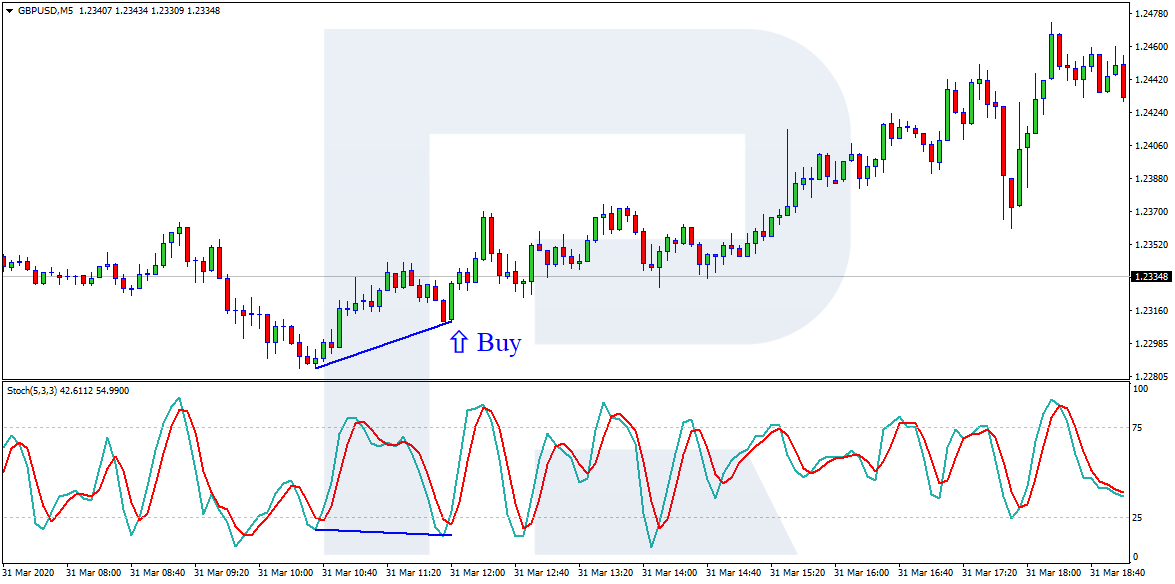
An example of a buying trade
There is a divergence in the oversold area on the Stochastic and the chart, which suggests opening a buying trade. An SL, in this case, is placed behind the closest low, and the potential profit is calculated as 1:3 or higher.
Selling trades are searched for the same way, only that divergences form in the overbought area.
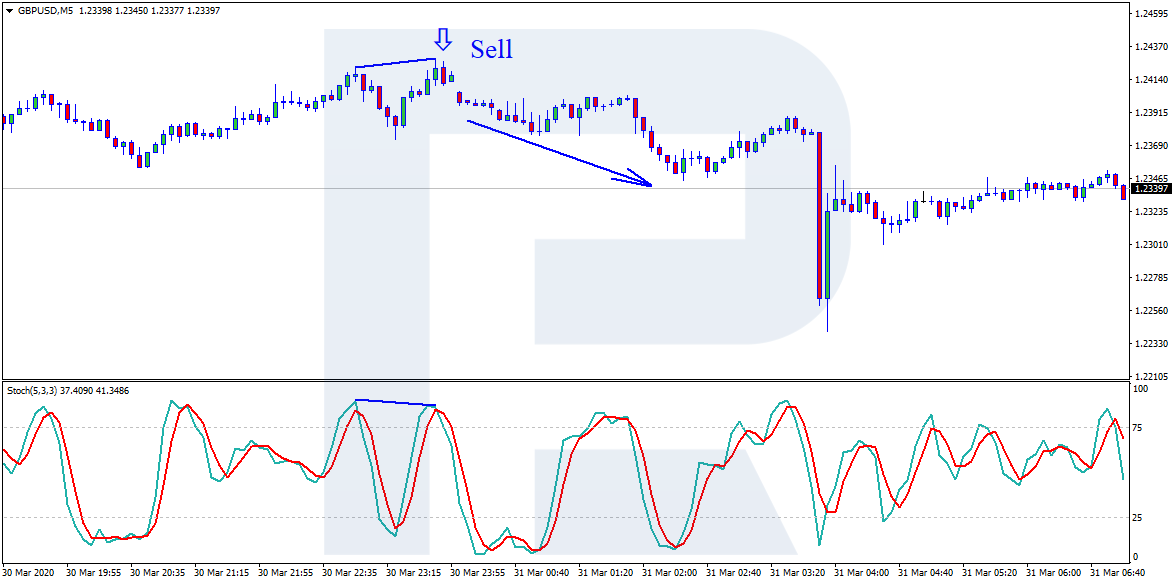
Judging by the examples in the pictures, divergences form quite rarely, and the opinions about how they work off and whether they are reliable are not uniform. However, many traders use this strategy successfully, perfecting and customizing it.


The “Stochastic + Bollinger Bands” strategy
The third example is the strategy uniting the Stochastic and Bollinger Bands (BB).
Strategy settings
- The Stochastic Oscillator with default settings.
- The MA also with default settings.
- Period 20.
- Shift 0.
- Deviation 2.
- Apply to Close.
- Colors at the trader's discretion.
As you know, the BB indicator may be used without additional filters, however, the quality of signals will be a bit worse. With this indicator, we normally trade bounces off the channel borders. To enhance the quality of signals, we use the Stochastic Oscillator.
Entry signals
The price has approached the border of the BB indicator and formed a reversal pattern. This may be a Hammer, Inverted Hammer, Dodji, Shooting Star, Hanged Man, Engulfing Pattern, or Harami. This is a signal to open a position, but for us, it is too weak, we need a confirmation from the Stochastic Oscillator. In its turn, it must be above 80 or below 20. If the signals coincide, we may open a position.
Signals to buy and sell in the pictures
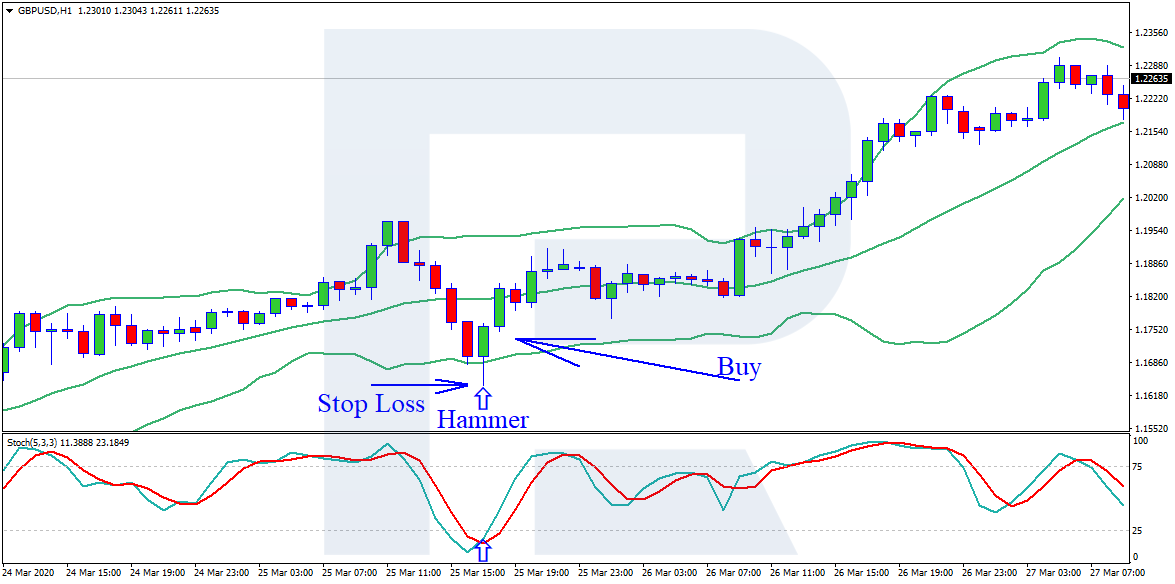
At the lower border of BB, a Hammer has formed; the Stochastic is in the oversold area. After the Hammer candlestick closes, we open a buying trade, putting an SL behind the low of the candlestick; we close the trade when the chart reaches the opposite border of BB.
If we place a TP, it must be, as earlier, in the ratio of 1:3 or more with the SL (no less than 3 points of potential profit for 1 point of the loss).
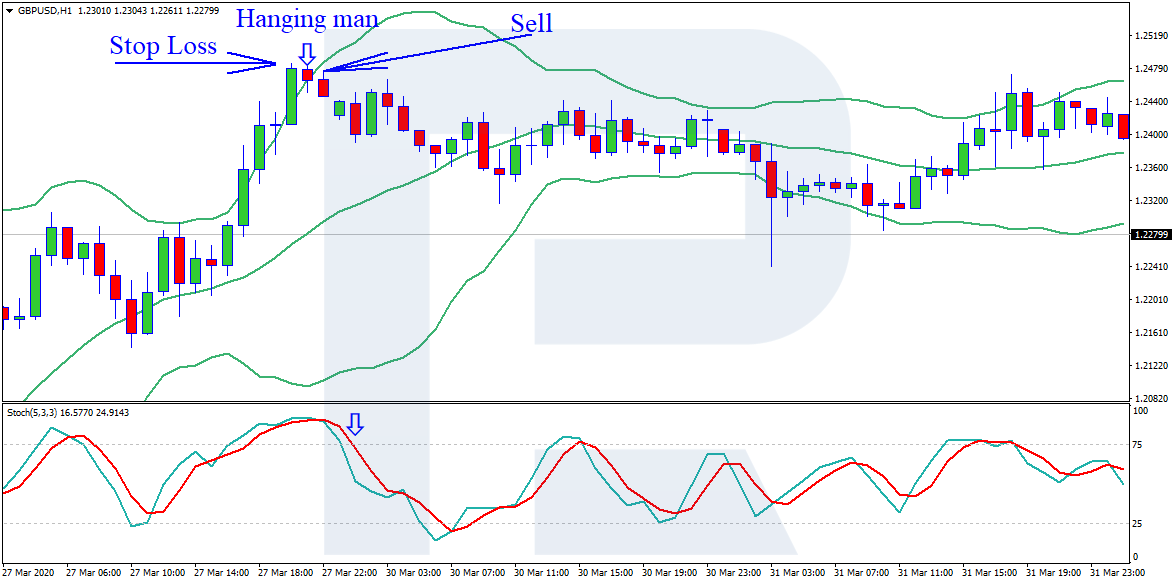
AT the upper border of BB, there has formed a Hanged Man, while the Stochastic is in the overbought area. After the Hanged Man candlestick closes, we open a selling trade. The SL is behind the high. We close the position after the price reaches the lower border of BB.
Closing thoughts
In this article, we have discussed several trading strategies based on the Stochastic Oscillator. Like other indicators, it has its advantages and drawbacks.
Anyway, the trader may try the indicator, change the settings or combine it with other indicators and trading strategies: there is no limit to perfection.


