How to Trade by Fishing Daily Strategy?

8 minutes for reading
Fishing strategy implies using larger timeframes. The strategy is meant for daily charts; you might try it, however, on H4 or H1. Of course, with such an approach, you will need to wait patiently for the signals to form, and Stop Losses will be larger.
On the other hand, signals will form less frequently and will be more clear and obvious than when trading on minute timeframes. Moreover, Fishing is a semi-automatized trading method, which makes looking for entry points much easier. The strategy will draw trendlines automatically; the trader will only have to filter the breakaways of such lines and open positions.
How does the Fishing strategy work?
The strategy works with almost any currency pair or cross-rate; you may even try it on gold. The preferred timeframe is D1: the method implies that the trader looks at the chart once a day and makes a decision about opening a trade. In case you do decide to work on smaller timeframes, you must choose only the European or American trading sessions, which are the most volatile ones.
The peculiarity of the strategy is the minimal number of indicators. Say, in the Victory system that we have already discussed, there are many indicators that the trader has to track in real-time. In Fishing, there are only two indicators that help to find the entry point.
One indicator draws trendlines, the breakaways of which means the breakaways of important levels, followed by further movement in the direction of the breakaway. The second indicator simply filters the signals and evaluates the potential of the movement.
What indicators are used in Fishing?
For normal work of the system, you need two indicators:
1. Fishingind: the indicator draws trendlines by Fractals; a breakaway of such lines will be the first signal to open a position. Here, several settings may be changed:
- Otstup: you may specify the distance between the price of the instrument and the line it has broken. The distance is specified in points.
- Kolshow: the period of Fractal calculation.
- Lineup and Linedwn: you may change the color of the lines; by default, the upper line is red and the lower line is blue.
2. Alex_Activity is an oscillator, represented as histogram bars. The indicator confirms the opening of the position.
If the histogram crosses the levels of 100 and -100, this will be the second signal (after the breakaway of the trendline) for opening a position. It is said that in such a case the values have deviated significantly from normal, and the probability of redevelopment of a strong movement in the direction of the breakaway is high. We may say that Alex_Activity helps to analyze the strength of the current momentum.
How to open a selling trade by Fishing?
Now, let us discuss in detail the algorithm of entering a short position by the strategy. Opening a trade is rather easy, it is only important to stick to the rules.
1. The price has broken through the ascending trendline (the blue one) from above. The breakaway may be evaluated by the closing prices of the candlestick: as soon the trading day is over, and the body of the candlestick is below the line, we may speak about a full-scale breakaway. Note that the shadow of the candlestick will not be a breakaway, and in this case, you should not hurry to open a trade.
2. The histogram of the Alex_Activity indicator is going down, breaking the level of -100 on its way. This means there is a strong momentum, and the chances of further falling are high.
So, we must receive two signals: the first one is the breakaway of the lower trendline by the closing prices, and the second one is the breakaway of the -100 level by the histogram bars. If all the requirements are fulfilled, we may seriously consider opening a selling trade.
Where to place a Stop Loss?
An SL is placed behind the nearest local extreme preceding the decline.
An SL may also be placed by the Alex_Activity indicator: if the bars have closed at 102, the SL will amount to 204, i.e. the indicator value is doubled.
Where to place a Take Profit?
The minimal TP is of the same size as the SL. For example, if we have opened a selling trade with an SL of 200 points, the TP will also be 200 points.
How else may we close selling trades by Fishing?
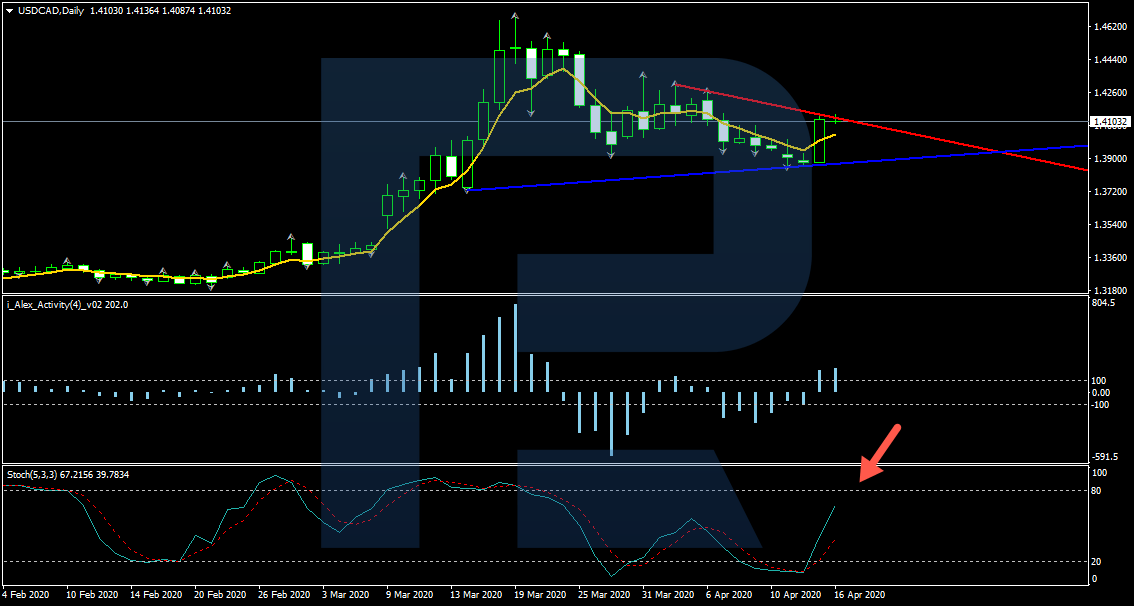
Exiting the position may be supplemented by the Moving Average indicator. The signal is simple" if the MA is broken away from below, you should escape the market.
Some traders use Trailing Stop. In this case, the trade will be closed when the market starts to grow.
You may add any oscillator and exit the market when it gives a signal of a reversal.
However, all these ways of diversifying the exit from the position are not included in the standard set of strategy rules. Note that you can always change any system or method if the changes help you to make more money.
An example of a selling trade by the system
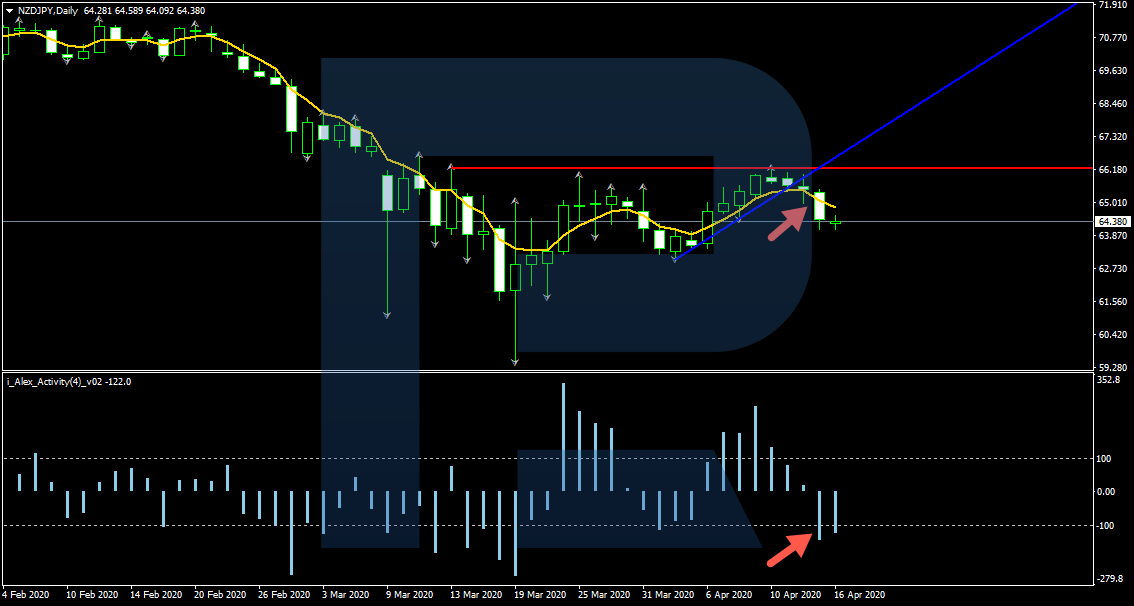
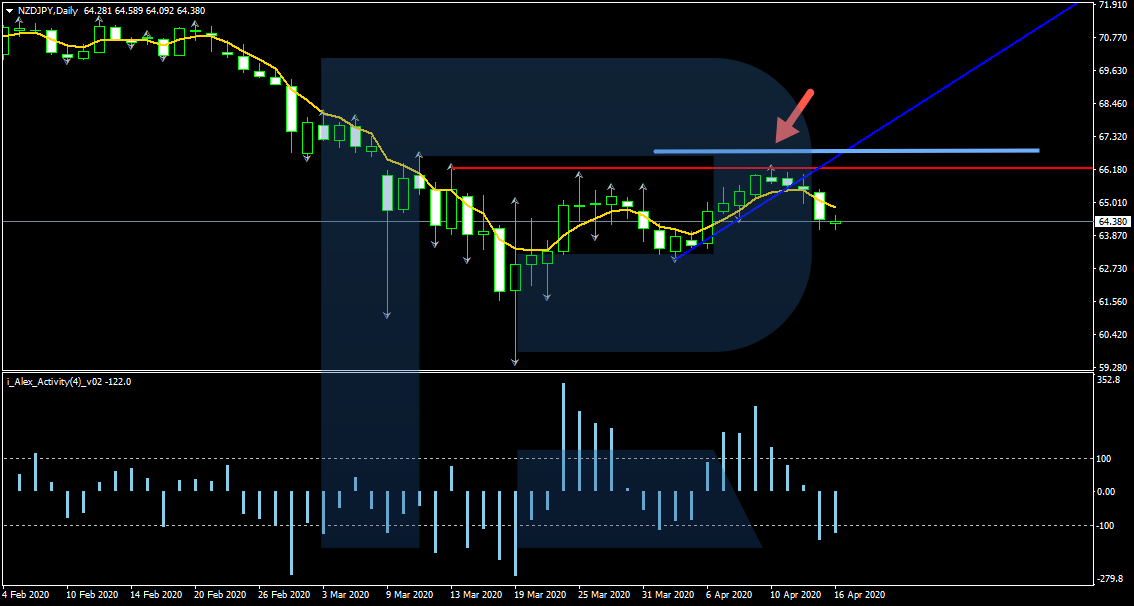
Keep in mind that the strategy keeps re-drawing the lines, i.e. you will not be able to evaluate the work of the strategy historically, only in real-time. Let us have a look at the example of opening a selling trade with NZD/JPY. As we see, the ascending trendline (drawn blue) has been broken away. Note that you may only enter at the opening of the next candlestick after you evaluated the breakaway.
Next, we evaluate the signal from Alex_Activity: the values have reached -102, which means there are a strong momentum and a deviation from the average.
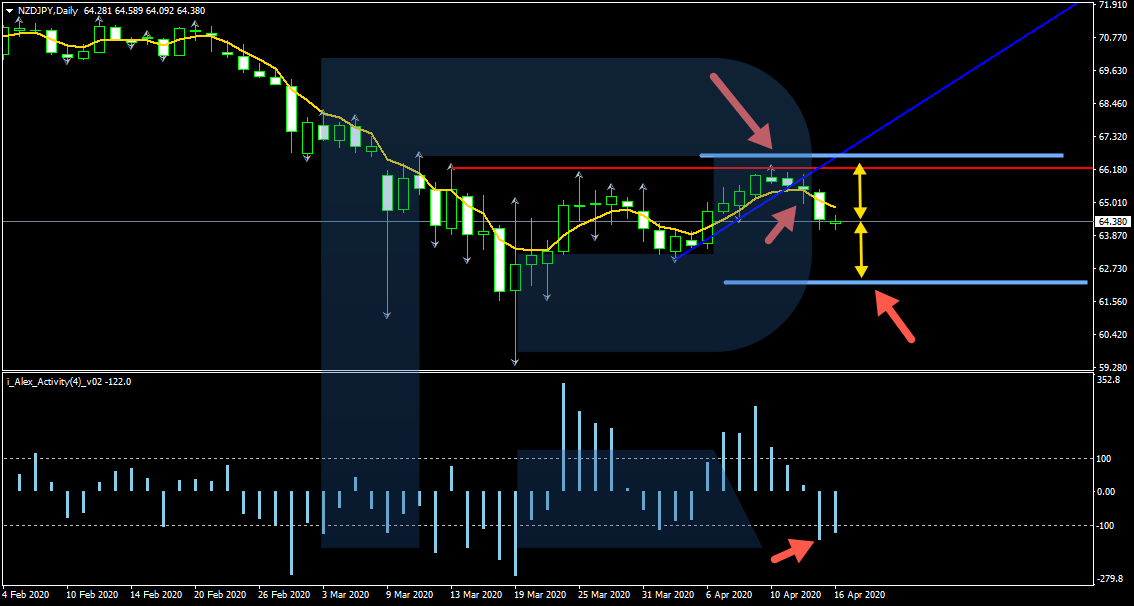
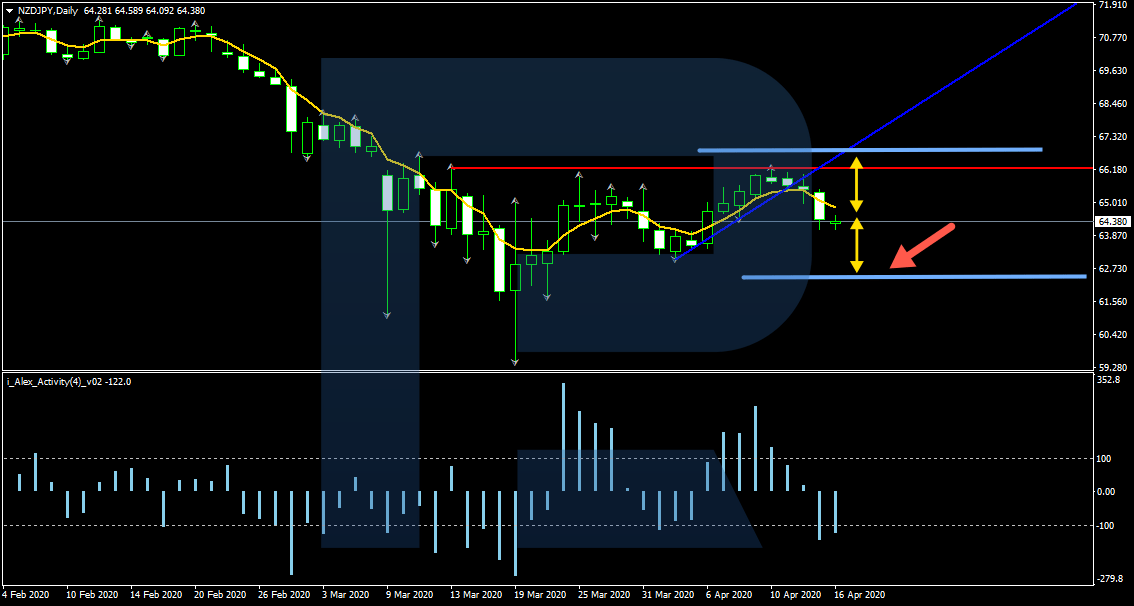
You may open a selling trade at the price of 65.55. An SL is placed at 66.80, where the nearest local high is. A TP is placed at 62.45.
How to open a buying trade by Fishing?
Let us have a look at the signals for entering a long position. As a rule, we open such a trade similar to a selling one but vice versa:
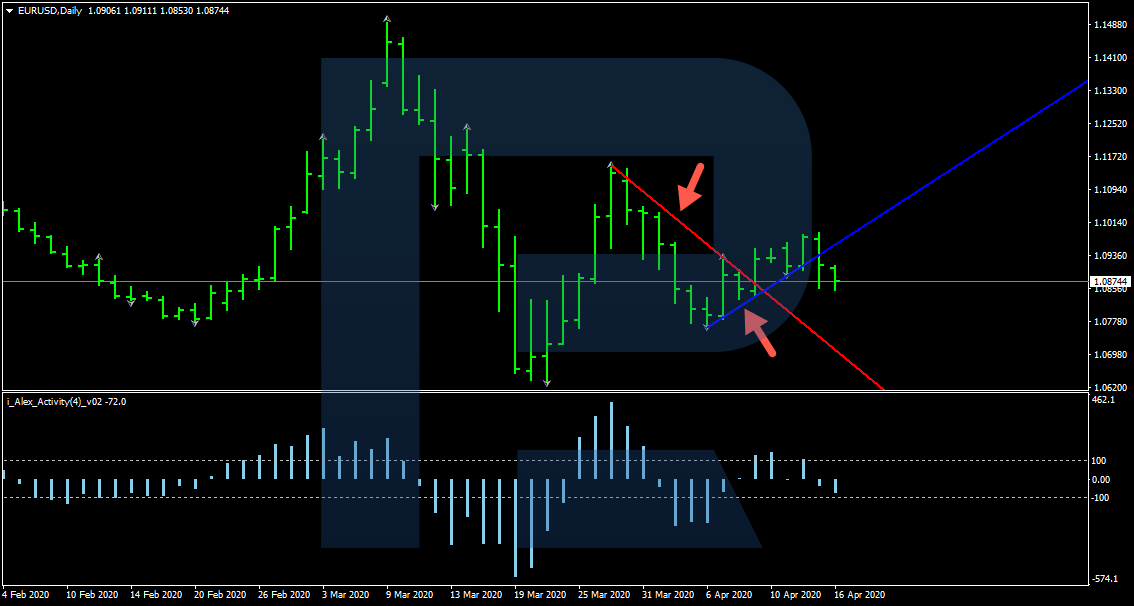
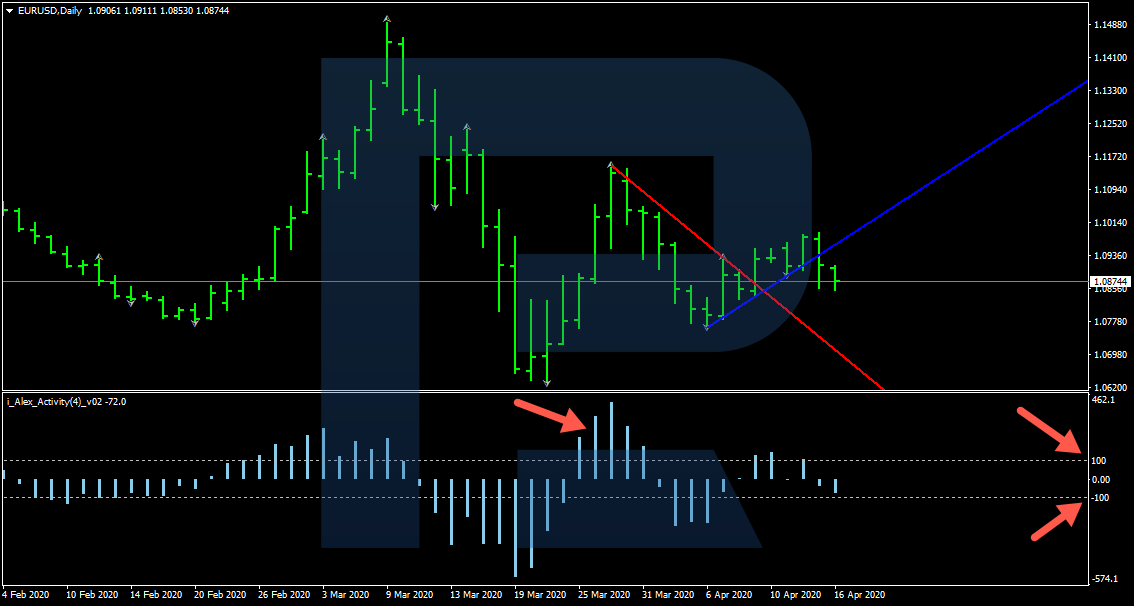
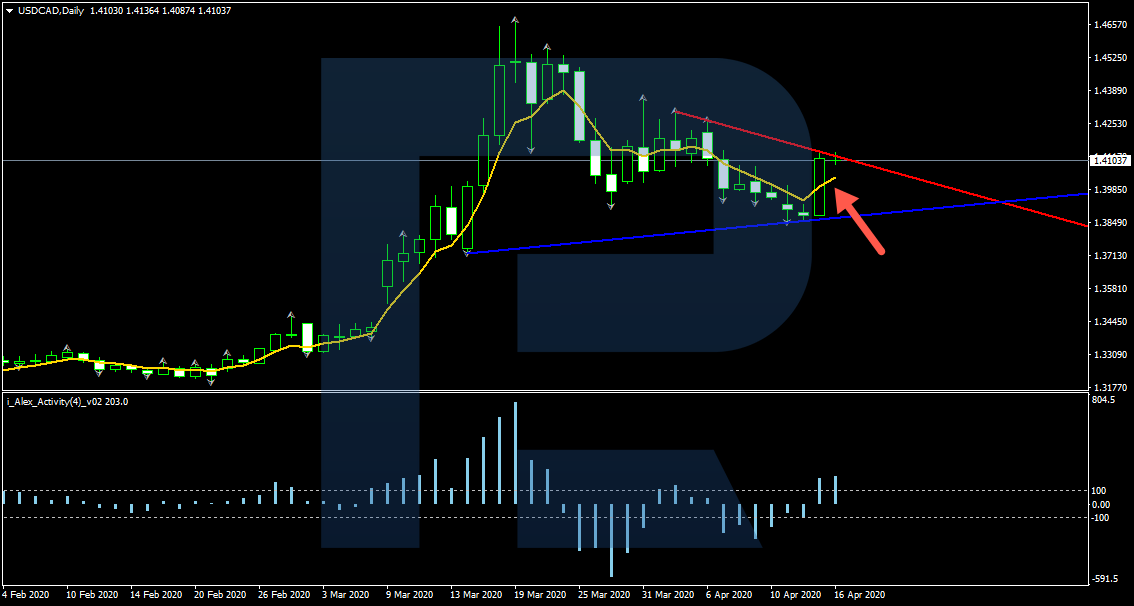
1. The closing price has broken away the descending trendline (drawn red) upwards. Here as well, note that the breakaway may be assessed only after the trading day is over.
2. The Alex-Activity histogram is growing and has broken the level of 100, which means the deviation from the average is significant, and the probability of a movement in the direction of the breakaway is high. We may say that the Alex_Activity signal supports the current breakaway.
Thus, we get two signals: the first one is the breakaway of the upper trendline by the closing price (the candlestick has closed the day obviously above the line), and the second one is breaking the level of 100 by the bars of the Alex_Activity histogram. If all the conditions are met, we may open a buying trade.
An example of a buying trade by the system
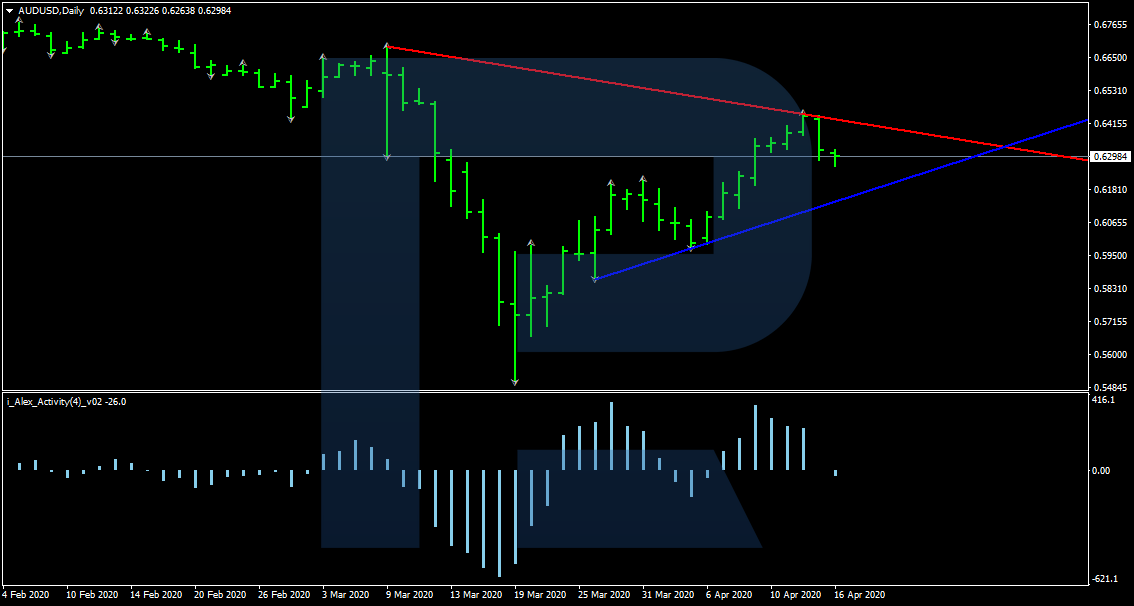
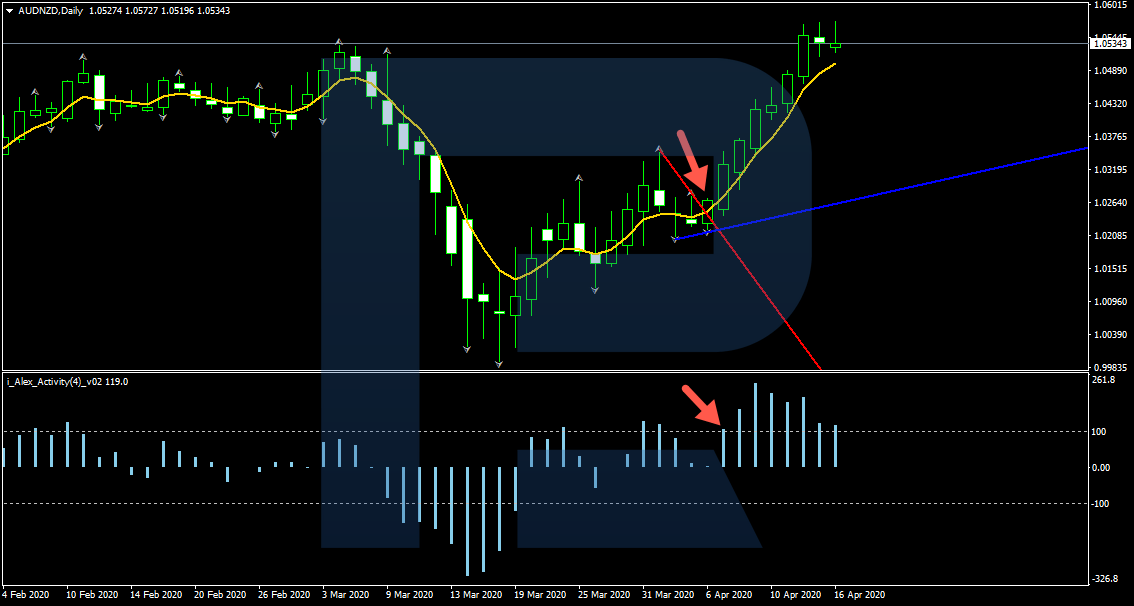
Let us have a look at an example of opening such a trade with AUD/NZD. We use D1. As we see, the closing price has broken away the descending trendline (drawn red).
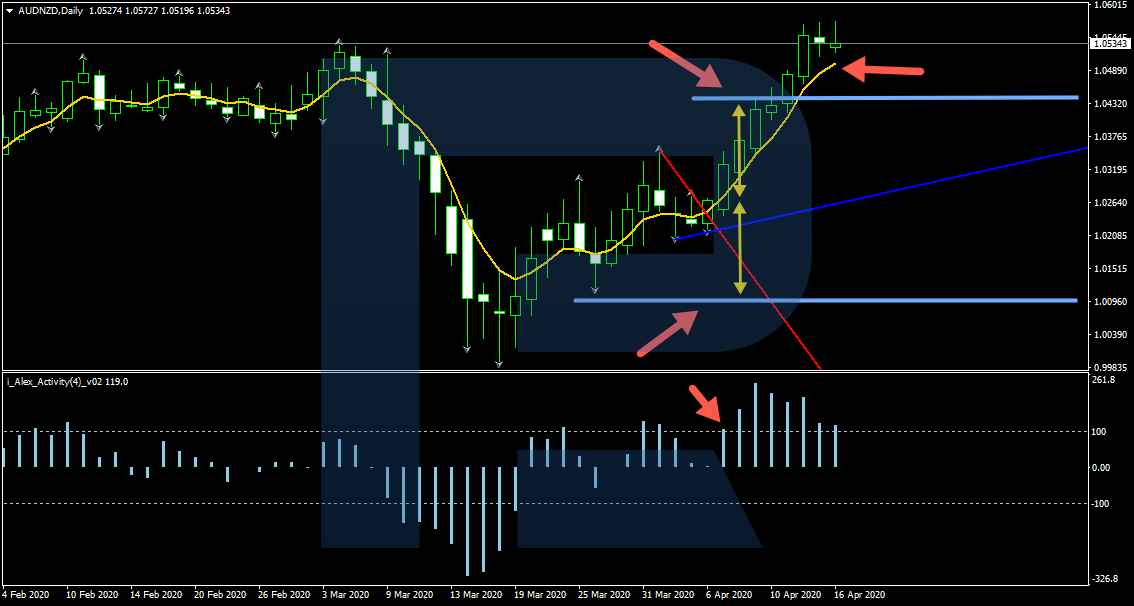
Next, we look at Alex_Activity to evaluate the current momentum. The values have reached 101, which indicates a deviation from the average and thus confirms the breakaway of the trendline.
We may open a buying trade at the price of 1.0245. An SL is placed at 1.0095, which is the nearest local low and the support area. A TP is at 1.0435. Note that if we exited by a breakaway of an MA, we would still be holding the position.
Summary
The Fishing trading strategy is a simple method of work on the daily timeframe with the most simple rules of entering and exiting the market. There is a simple connection between the trendlines and the oscillator signals that confirm the breakaways of the trendlines. The method is meant for the daily chart, which allows looking at the chart just once a day.
Moreover, the trader does not need to draw trendlines as the indicator does it automatically. You only need to follow the two rules and place SLs and TPs right. The method suits both beginners and experts.


