How to Trade the Harami Cross?

5 minutes for reading
This overview is devoted to the peculiarities and trading method of the candlestick pattern called Harami Cross. This reversal pattern is not frequent but rather strong.
How does a Harami Cross form?
The Harami Cross belongs to reversal candlestick patterns and forms on local highs and lows of the price chart. It consists of two candlesticks: the first one has a chunky body while the second one is a Doji (it has no body at all, because opening and closing prices coincide). As a rule, the Doji opens with a gap against the direction of the first candlestick and must rest fully inside its price range.
The Harami Cross is a special case of the Harami pattern that has its second candlestick small, with a modest body. The Harami Cross is thought to give a stronger reversal signal compared to the normal Harami because a Doji means that market players are doubting, which might entail a correction or a reversal of the current trend.
As a candlestick analysis guru Steve Nison noted, a Doji appearing after a relatively large white candlestick indicates the overbought state of the financial instrument. And vice versa, is a Doji emerges after a large black candlestick, the asset is oversold. Some sources call the Harami Cross a "petrifying pattern".
Harami Cross types
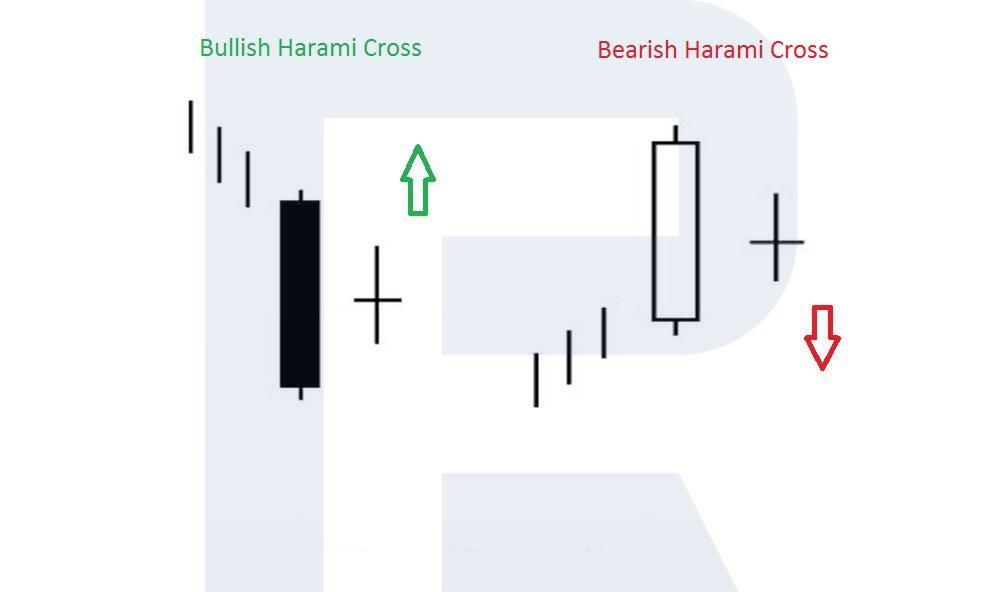
The pattern has the bullish and bearish types that form after a downtrend and an uptrend, respectively.
- The bullish Harami Cross forms in a downtrend on the local lows of the price chart. The first large bearish candlestick of the pattern indicates that bears are advancing vigorously. But then a Doji forms, meaning that the bears are almost out of strength and in need of a pause. This entails an ascending correction that might later turn into a trend reversal. The beginning of the correction is confirmed by the growth of the quotations above the high of the first candlestick.
- A bearish Harami Cross appears on the top of an uptrend. The first large bullish trend demonstrates that bulls are actively pushing the market upwards. Then, however, a Doji appears meaning that buyers are already out of force, and bears have a chance to grab the initiative. When the quotations drop below the low of the first candlestick of the pattern, a descending correction starts or even a reversal becomes possible.
Trading the Harami Cross
Let us get into the details of trading bullish and bearish Harami Crosses.

The bullish Harami Cross — buying
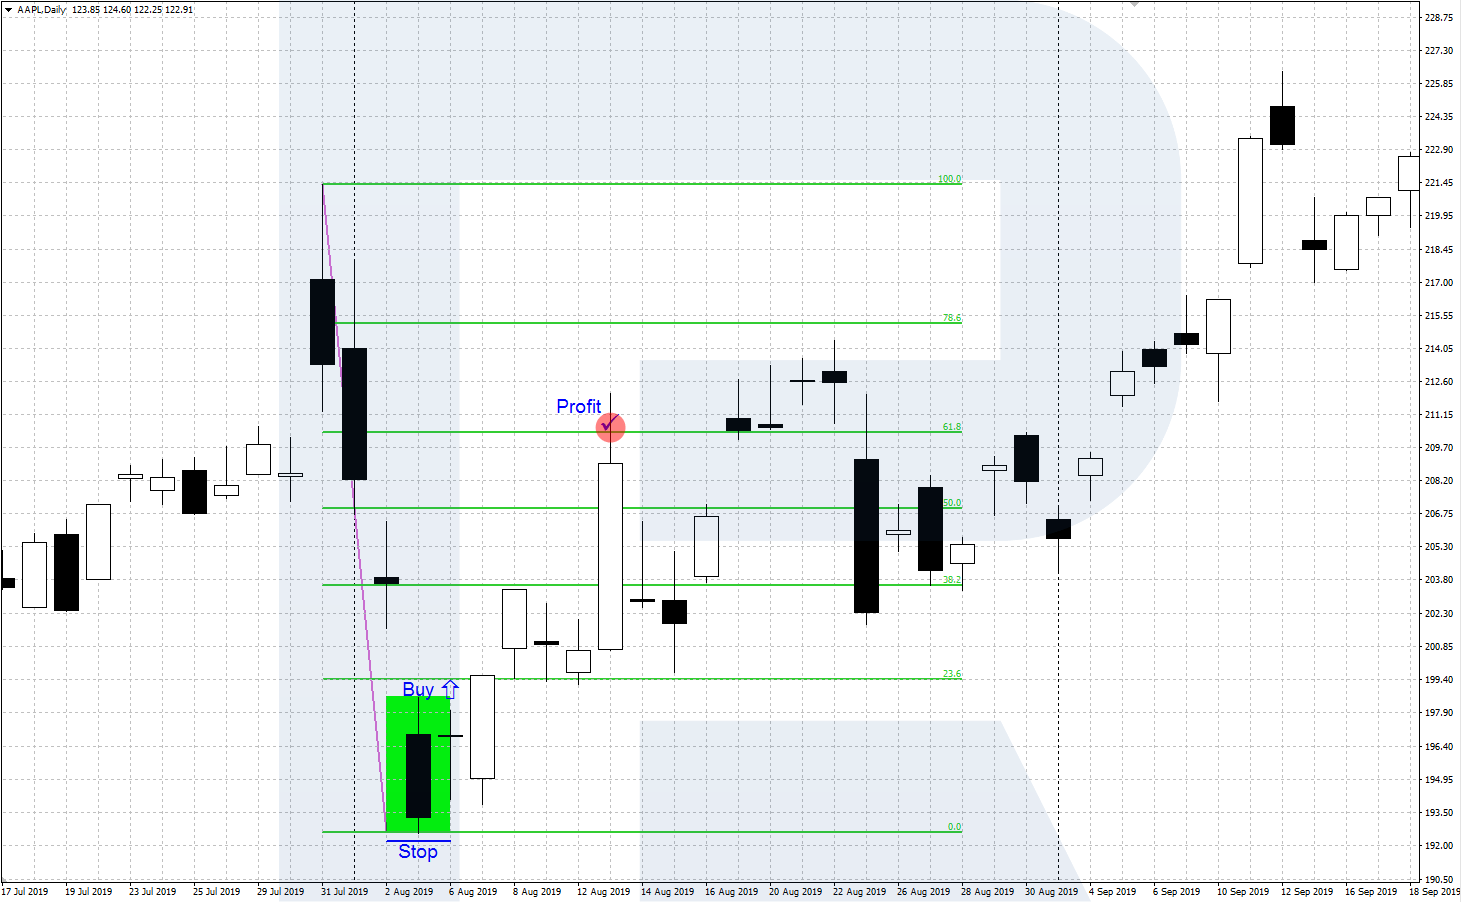
The algorithm of trading a bullish Harami Cross looks as follows.
- In a downtrend, on the local low of the chart, the price forms a bullish Harami Cross.
- You can start aggressive buying when the price rises above the high of the Doji (the second candlestick of the pattern). Place a Stop Loss behind the low of the first large bearish candlestick. In this case, the probability that the pattern will work slightly decreases but the Stop-to-Profit ratio becomes more profitable.
- Buy conservatively when the quotations rise above the high of the first large candlestick, placing an SL behind its low. In this case, the pattern is more likely to work but the Stop-to-Profit ratio is worse.
- To take the profit, check the Fibo correction levels based on the previous descending movement.
The bearish Harami Cross — selling
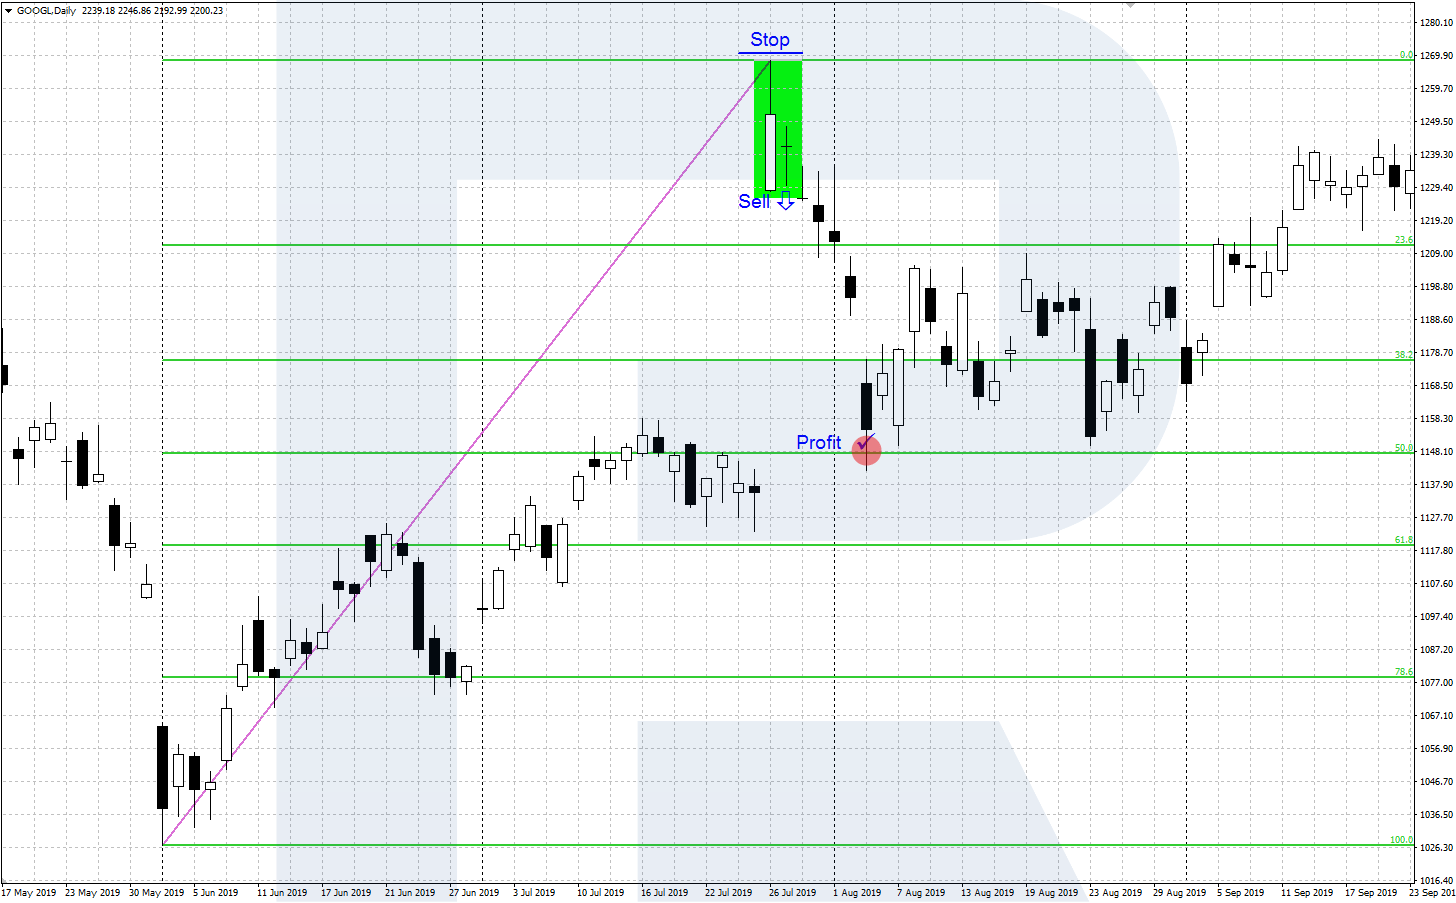
The algorithm of trading a bearish pattern looks as follows.
- In a downtrend, on the local high of the chart, a bearish Harami Cross forms.
- Trade aggressively when the price declines below the low of the Doji (the second candlestick of the pattern). Place an SL behind the high of the first large bullish candlestick. The pattern will work less probably but the Stop-to-Profit ratio is better.
- Sell conservatively when the quotations decline below the low of the first large candlestick, placing an SL behind its high. The pattern will work out more likely but the Stop-to-Profit ratio will be worse.
- To take the profit, check the Fibo correction levels based on the previous ascending movement.
Recommendations on the pattern use
To use the Harami Cross successfully, check the following issues.
- The pattern must be preceded by a pronounced uptrend or downtrend; flat is useless here.
- Use larger timeframes: from H4 and higher.
- Trade liquid assets (currency pairs, gold, oil, liquid stocks, stock indices).
- Always place protective orders (Stop Losses) and stick to your money management rules.
- The second candlestick of the pattern — Doji — can be imperfect, i.e. its opening and closing prices can slightly differ.
Closing thoughts
The Harami Cross reversal pattern forms on the local extremes of the price chart in an ascending or descending trend (bearish or bullish Harami Cross, respectively). The probability that the pattern will work increases when it is used alongside tech analysis patterns, support/resistance levels, and trading indicators. Before trading for real, backtest the pattern and practice on a demo account.
Get acquainted with other candlestick patterns in the article below:


