MACD – Trading the Trend Strategy

5 minutes for reading
This trading method using Moving Averages works well with strong market movements. You must have already heard that trading the trend usually yields brilliant results; and if you add an oscillator, you get a full-scale trading strategy.
An indicator-based strategy is attractive because it has strict entry and exit rules. And if the trader uses graphic analysis, they usually have to analyze charts looking for price patterns, as well as subjectively evaluate the market situation.
Today, I will be telling you about a strategy used on M30 and H1. It allows placing close Stop Losses and trading intraday.
About the strategy MACD – Trading the Trend
The strategy is based on three Moving Averages, and MAs are the best indicator showing the market trend. Knowing the trend, you will know the direction of your work. As an additional signal source, the MACD is used. The strategy suits GBP/USD, AUD/USD, EUR/USD.
Parameters of the trading strategy
The strategy demonstrates the best results on H1 and M30. To get started, prepare the chart and add some indicators with certain parameters.
- MA (85) is a Linear Weighted MA with period 85, apply to: Low, color: blue.
- MA (75) is a Linear Weighted MA with period 75, apply to: Low, color: dark-blue.
- MA (5) is a Linear Weighted MA with period 5, apply to: Low, color: yellow.
- MACD (15, 26, 1) is the MACD with fast EMA (15), slow EMA (26), MACD SMA – 1.

A signal to buy by the strategy
The main signal to open a trade is a breakaway of the two slow MAs by the fast one, while the MACD will be used as an extra filter. The crossing of two MAs is a simple signal for a change of the trend. In this case, we expect a downtrend to come to an end and an uptrend to start, which means it is time to buy.
The parameters for entering a buying trend are as follows:
- The MA (5) crosses the MA (85) and (75) from below, signifying a change of the trend.
- The MACD values are above zero, indicating the presence of an uptrend.
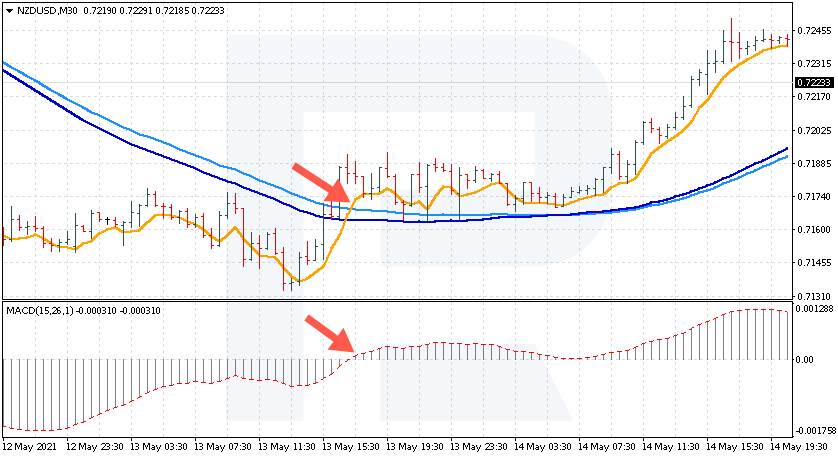
Let us study an example with the currency pair NZD/USD. We see that the price was resting below the slow MAs, indicating a downtrend, but at some point it broke through the MAs, then the fast MA did the same, aiming upwards, indicating a change of a downtrend for an uptrend.

Wait for the candlestick to close and the indicator – to secure above the lines not to catch a false breakaway. Next, check the MACD values. They are above zero, and this is the second signal for opening a long position. Hence, you may open a buying trade.
A signal to sell by the strategy
In case of selling, signals form in a vice versa manner. In details, things look as follows.
Parameters of a trade:
- The MA (5) crosses the MA (85) and (75) from above. Wait for the candlestick to close for the signal to be confirmed.
- The MACD values are below zero, indicating a downtrend.
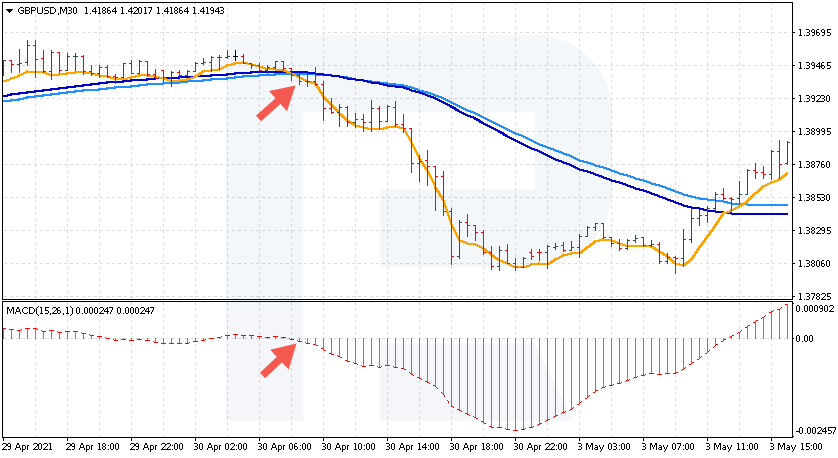
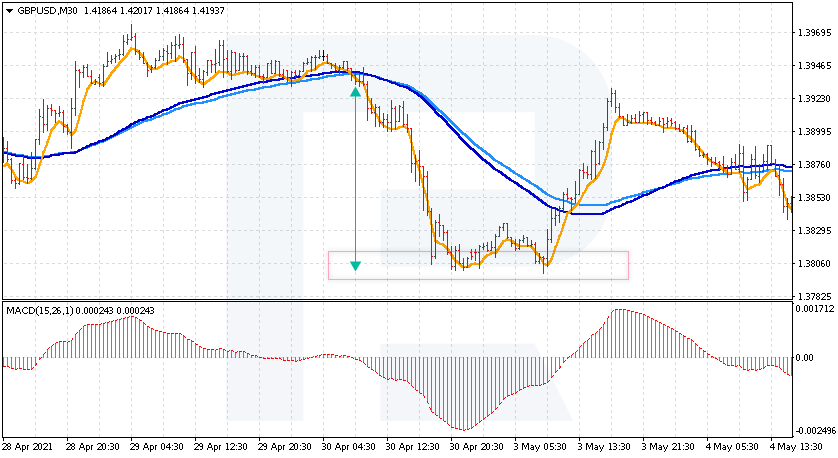
Let us discuss an example with GBP/USD. This currency pair is more volatile than NZD/USD. Price remained above the slow MAs for some time, signifying a bullish trend. Buyers tried to break through the resistance level but failed, and the price started falling. At some point, it broke through those MAs, as well as the fast MA did. This signal indicates an upcoming change of the trend for a descending one.

Wait for the candlestick to close, so that the fast MA (5) secured under other lines. Then check the position of the MACD values; when they fall below zero, this signals to open a position as all the conditions for the trade are present. You can open a selling trade.
Closing trades by the strategy
By the strategy, place your Stop Loss no farther then 10 points away from the entry point. Quite often, after a breakaway of the slow MAs by the fast one, quite a strong movement in the direction of the breakaway happens, hence such an SL is enough. The rules of the strategy also give us the size of the Take Profit depending on the timeframe and the currency pair used.
- GBP/USD: Take Profit for M30 is 20 points, H1 – 28 points.
- AUD/USD: M30 – 10 points, H1 – 15 points.
- EUR/USD: M30 – 15 points, H1 – 20 points.
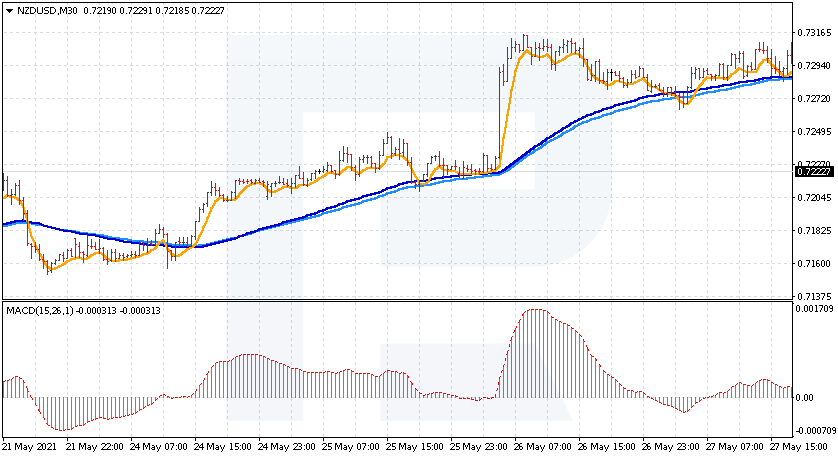
However, in the last two trades, note a strong price movement after the trades were open. In GBP/USD, the decline amounted to over 120 points, and in NZD/USD the growth was over 70 points. Based on these phenomena, you can alter the rules of the SL and TP.

First of all, you can try Trailing Stop that will be moving after the market, and if the price reverses, the trade will close with a profit. The second option is closing the trades when an opposing signal forms. For example, if your trade is buying, close it when you get a signal to sell.
Closing thought
The trading strategy called MACD – Trading the Trend is an easily understood option of trading the beginning trend. The strategy uses MAs with different periods and the MACD for confirming the signal.
Signals given by the method most often push the price far away from the entry point. Hence, do not limit yourself by a small TP. A good option will be using the Trailing Stop method to get the maximum from the market movement.


