How to Filter Stochastic Signals?

6 minutes for reading
We already have two articles about the Stochastic Oscillator describing in detail the indicator itself and the ways of trading by it. This is an oscillator, i.e. it demonstrates how much the price has fluctuated from the average; it works great in flats.
If there is a strong, directed trend, such an indicator will give a lot of reversal signals, making the trader buy in the falling market and sell in the growing one. Hence, traders do not normally use Stochastic by itself: instead, they add other signals to it, enhancing the work of the indicator significantly.
Today, I will try to step beyond the boundaries of normal trading by the instrument and show you how to filter its signals in order to make money on lengthy trends.
Moving Average
I guess, the best way to improve signals from Stochastic is to add a Moving Average to it or several such lines. This combination lets the trader work by the current trend.
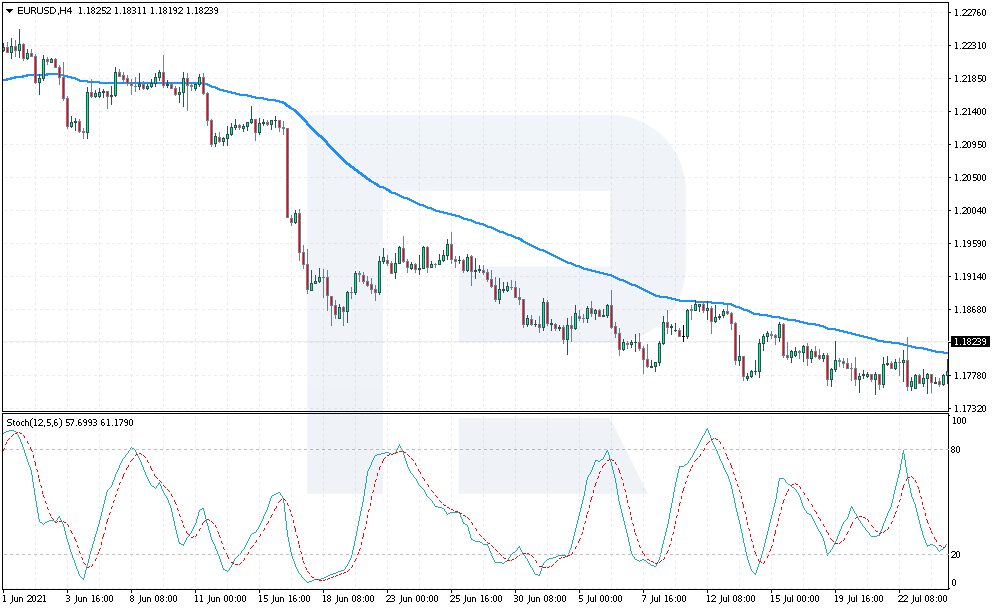
For trading, an H4 or H1 chart of any currency pair will be good. Add an MA with period 75: if the price is above the line, we look for a signal to buy from Stochastic. If the price breaks through the MA downwards, the trader needs a signal to sell from Stochastic.
A signal to buy
Let us have a look at an example with EUR/JPY. We see the price go above the MA(75), indicating an uptrend. In this case, we are not interested in signals to sell, because the Stochastic values may stay above 80 for a long time and quite often perform crossings for sale. Such signals must be ignored.
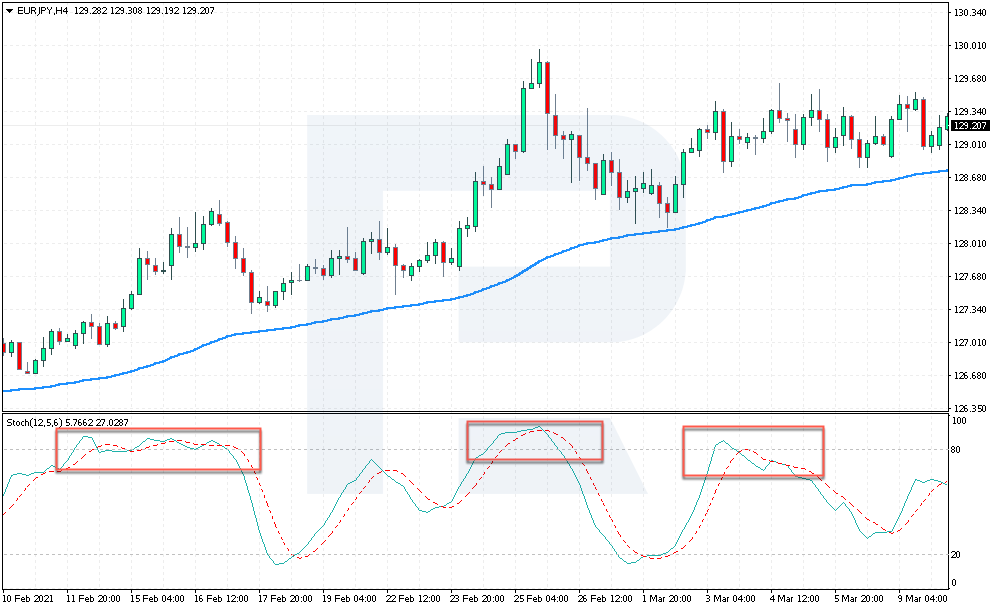
Wait for a downward correction to develop as close to the MA as possible, then wait for the crossing of the Stochastic signal lines for buying.
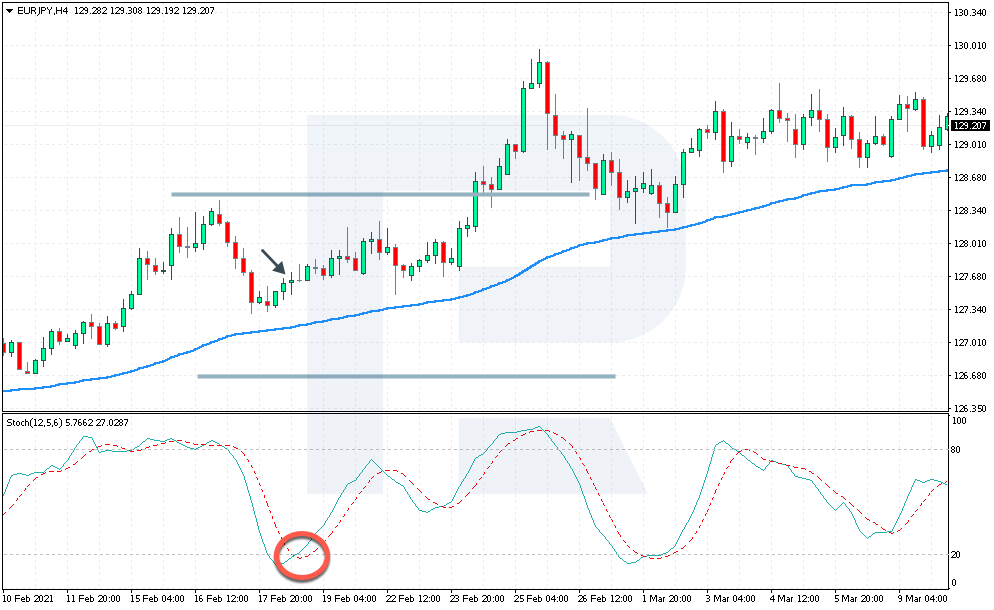
The best signal will be a decline of the Stochastic values below 20 and crossing of this area. In the marked area, there were two such signals, and both times the market kept growing.
A Stop Loss in such a case must be placed 35-55 points away from the MA. As for a Take Profit, place it at least at the local high because the trend is ascending, and the price will easily renew it.
However, if the price breaks through the MA downwards and the signal lines of Stochastic cross in favor of buying, wait for the price to get above the MA again and buy with the same risk of 35-55 points away from the MA.
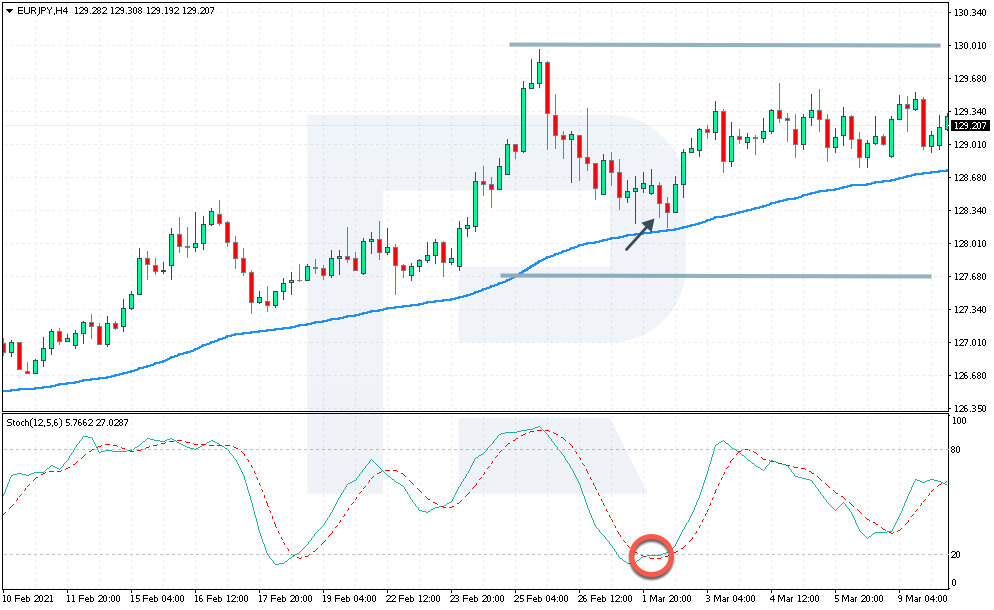
In our case, you can buy at 127.65, placing an SL at 126.88 and a TP at 128.50. We see the price go by both signals and proceed upwards.
A signal to sell
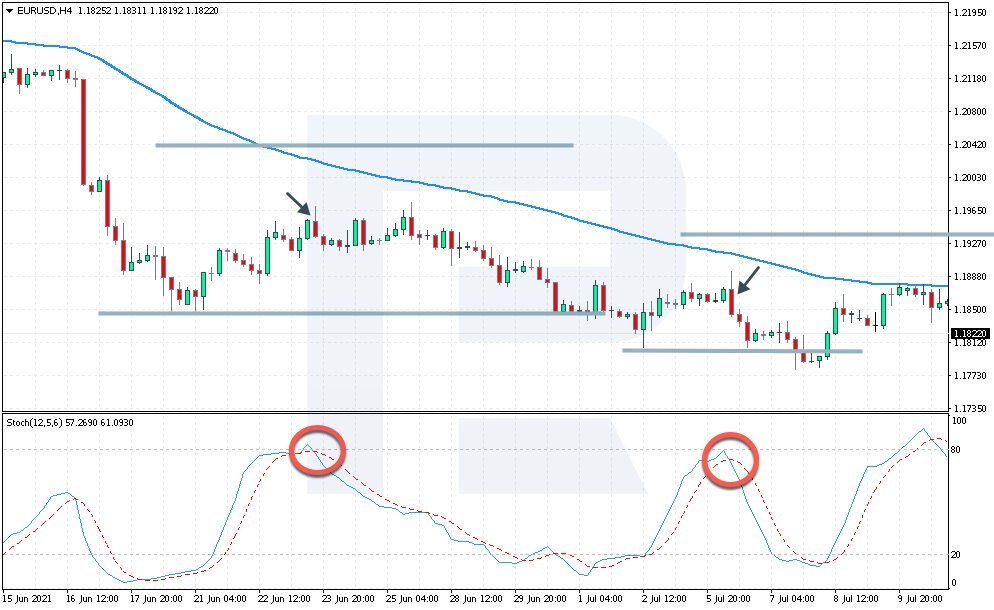
Take a look at an example with EUR/USD. The price is deeply below the MA, which means the trend is descending. AT a certain point, a correction develops, and the price approaches the MA. At that point, the Stochastic lines crossed near 80.
For us, this is a great selling signal at the price of 1.1934. Place an SL at 1.2035 and a TP at 1.1840. In our example, the market went not only by this but by the next signal as well.
Graphic patterns
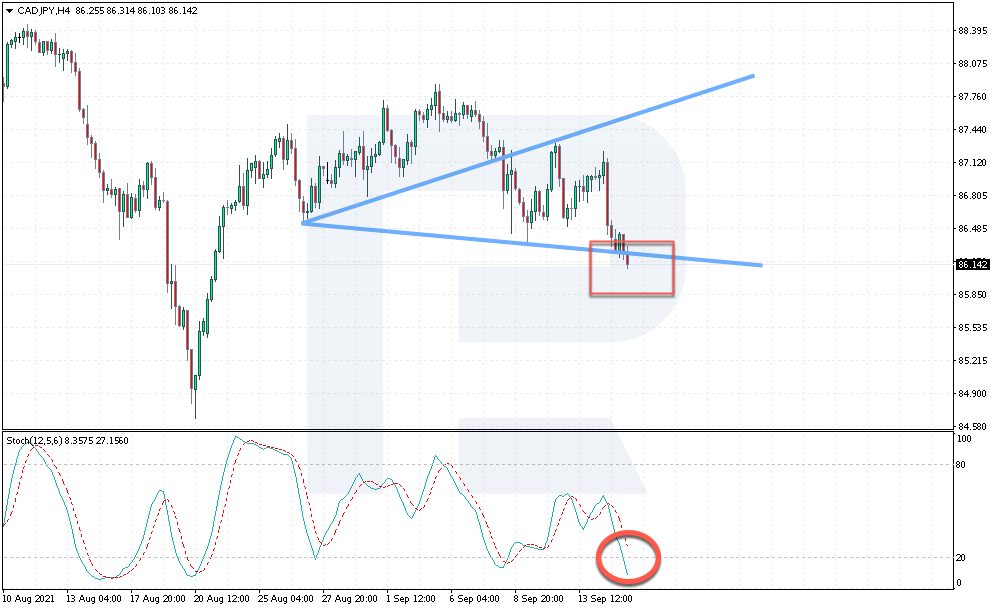
Any graphic pattern can improve signals from Stochastic as well: in this case, the reliability of the pattern itself also increases thanks to a filter added. For example, the trader does no enter the market by a Triangle or Wolfe Wave until they see the signal lines of the Stochastic cross in the direction of the pattern.
In the CAD/JPY pair, there is a Wolfe Wave forming. However, the Stochastic lines have not crossed in the direction of buying yet, so wait for another signal and open a position after one more crossing only.
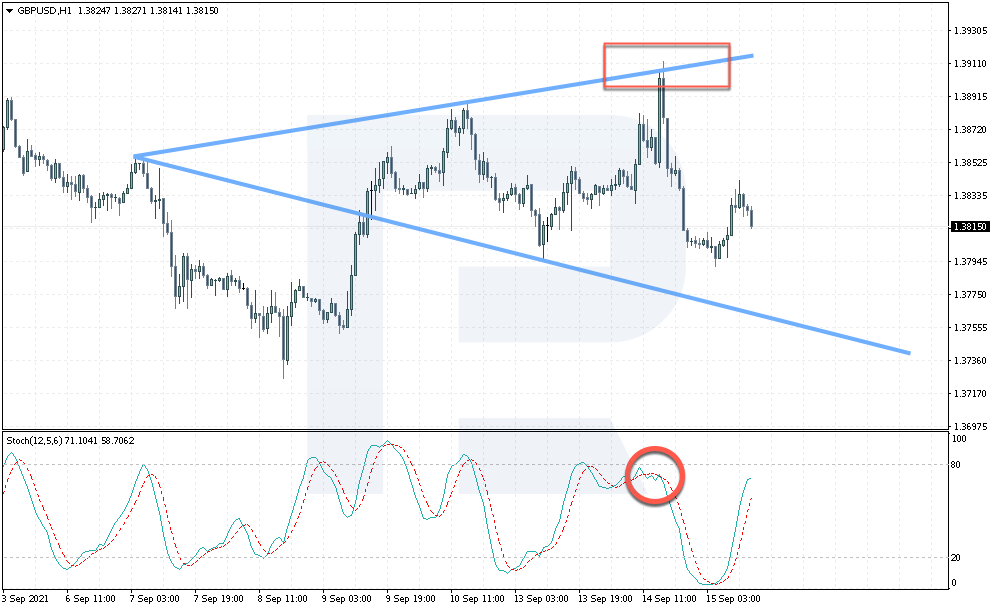
In GBP/USD, there was also a descending Wolfe Wave forming. When the upper border of the pattern was tested, the Stochastic signal lines crossed in favor of selling, which created an opportunity of a good selling trade. We can see the market react by a mighty downward move.
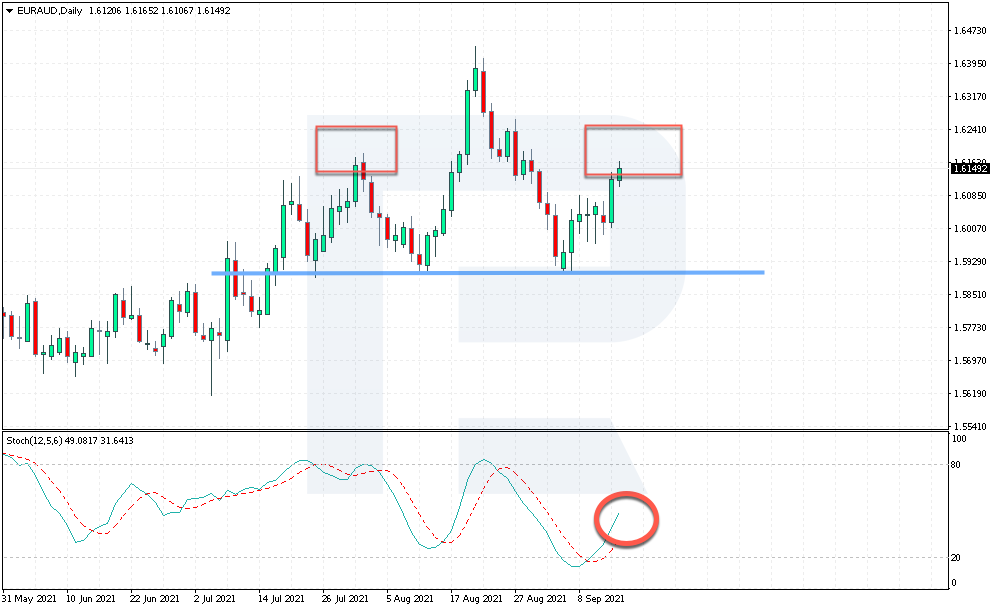
In the third example, there is a reversal Head and Shoulders pattern forming in EUR/AUD. However, the indicator does not signal to sell yet, so do not rush at selling until the signal lines cross. If this never happens, just skip the signal and wait for the next pattern to form.
Signals on different timeframes
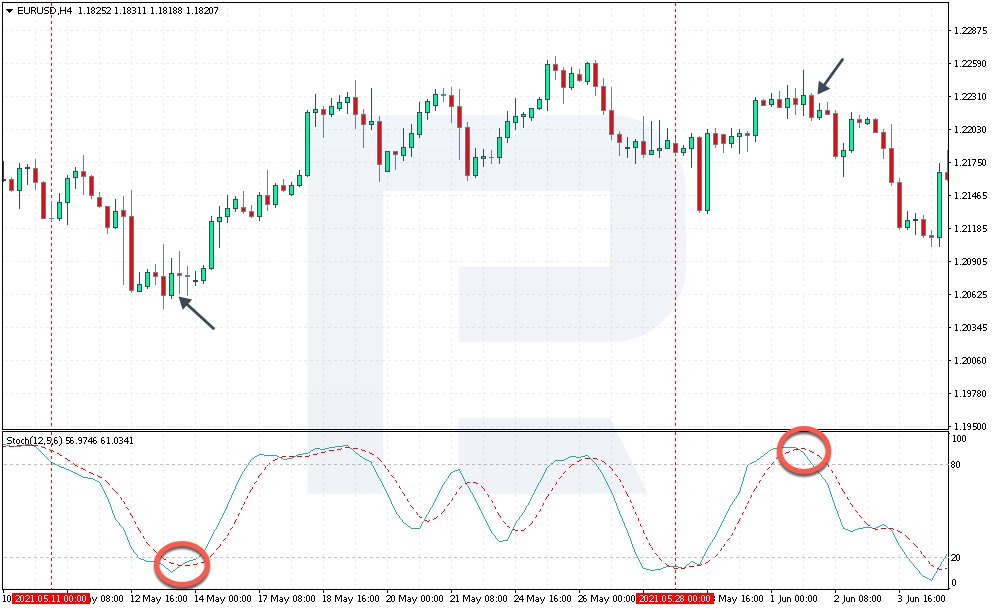
George Lane, the author of the indicator itself, suggested filtering the indicator signals by checking them on various TFs. For example, getting a signal on a D1, you can switch to a smaller TF to get a confirmation. Quite often, the indicator gives different signals on different TFs, scaring off beginners. Experts always check for signals to be in the same direction.
Let us look at an example of using this method on EUR/USD. On D1, the first signal indicates growth, but on H4 we can only see signals to sell. The trader’s task is to wait for a signal to buy on H4 and open a long position only then. This will give us a signal from a larger and smaller TFs in the same direction.
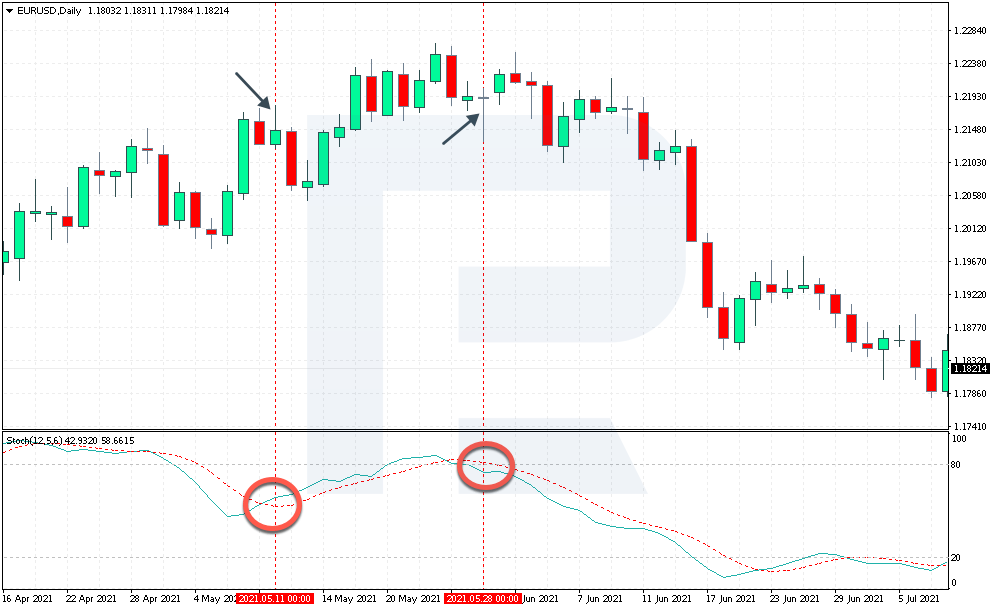
The second signal on D1 was a signal to sell. We want it to be confirmed by a signal on H4, and we can see there is one. After the Stochastic lines crossed, the price went down.
Bottom line
The Stochastic Oscillator gives too frequent entry and exit signals by the crossings of its signal lines. To improve those signals, you can add other indicators, combine Stochastic with graphic patterns, or check for the confirmation of signals on different timeframes.
Adding a Moving Average to the chart alongside Stochastic will let you trade the trend only. If you add a graphic pattern, you will avoid preliminary signals from the pattern itself. Combining various TFs gives you an extra Stochastic signal from a smaller TF.
As you see, there are plenty of trading options with Stochastic. Just test them all on a demo account and always follow your money management rules, especially when you trade real money.


