How to Trade Marubozu Candlestick Pattern?

6 minutes for reading
This article is devoted to a universal candlestick pattern Marubozu: what it looks like on the chart and in which cases it can be used for trading.
What Marubozu candlestick is
The pattern is named after the only candlestick that it includes – Marubozu. From Japanese, the name is translated as “bald”, “with shaved head”. The candlestick has a large body and almost no shadows, so it looks as if its shadows have been “cut off”, leaving the candlestick with just a “bald” body.
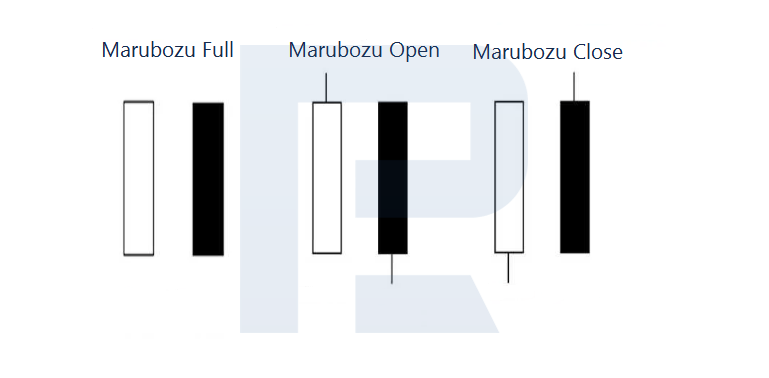
There are three Marubozu types:
- Marubozu Full almost lacks both shadows;
- Marubozu Open lacks the shadow at the side of the opening price and has a small shadow at the side of the closing price.
- Marubozu Close, on the contrary, lacks the shadow at the closing side and a small one at the opening side.
The pattern can consist of any Marubozu, the type does not matter. As for the strength of the candlestick, it is considered quite strong and does not appear too often. When it does appear, however, this means bulls or bears are going to take action.
Types of Marubozu pattern
Depending on the color of Marubozu body, traders single out two types of the pattern: Bearish Marubozu and Bullish Marubozu. Sometimes you can hear about Marubozu Brothers, which means there are both types of the candlestick: a white bullish and a black bearish candlestick. I would say, one brother tries to push the market upwards (the Bullish Marubozu), while the second brother, on the contrary, plans to send the market down (the Bearish Marubozu).
Bullish Marubozu
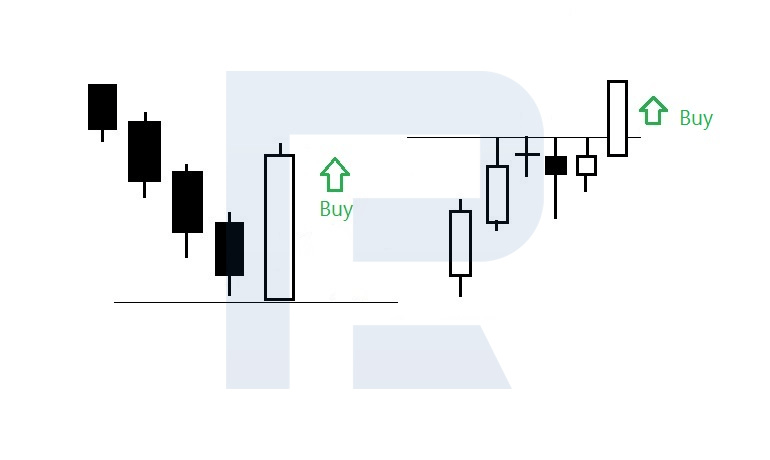
The pattern consists of a large white candlestick and demonstrates that bulls are ready to attack. The place on the chart where the pattern forms, indeed, matters. There are two main trading scenarios.
- A reversal after a decline: the pattern forms at the lows of the chart in a downtrend, in which case the pattern is considered reversal. A Marubozu shows that bears have reached a strong support level, and bulls are gathering powers to counter-attack from the level, provoking an ascending correction or even a reversal.
- A breakaway of the resistance level: the pattern appears in an uptrend or an upward escape from a range. Here, Marubozu is a trend continuation pattern. Bulls have reached a strong resistance level and after some consolidation break through it confidently. As a result, we can count on further growth of the quotations.
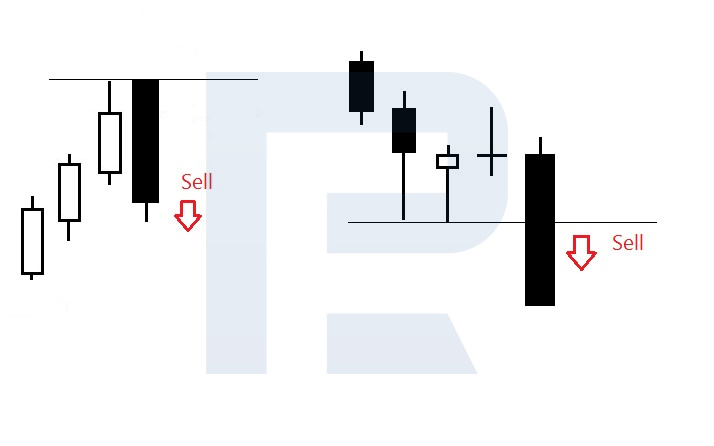
Bearish Marubozu
The pattern consists of a large black candlestick and means that bears are capturing initiative. As with the bullish pattern, there are two trading scenarios:
- A reversal after growth: the pattern appears at the highs of the chart after an uptrend and works as a reversal pattern. A Marubozu at the highs means that bulls have encountered a strong resistance level, and bears are trying to reverse the market downwards. If they are strong enough, a descending correction or even a reversal can follow.
- A breakaway of the support level: a Bearish Marubozu forms in a downtrend or when the quotations escape a consolidation range downwards. Here, it works as a downtrend continuation pattern. Bears have reached a strong support level and, upon regaining strength, breaks through it, possibly continuing the decline.
Trading by the Marubozu pattern
To trade the pattern, you can use any timeframe and almost any asset provided that it is liquid and volatile enough.
Bullish Marubozu: buying
The bullish pattern is traded as follows:
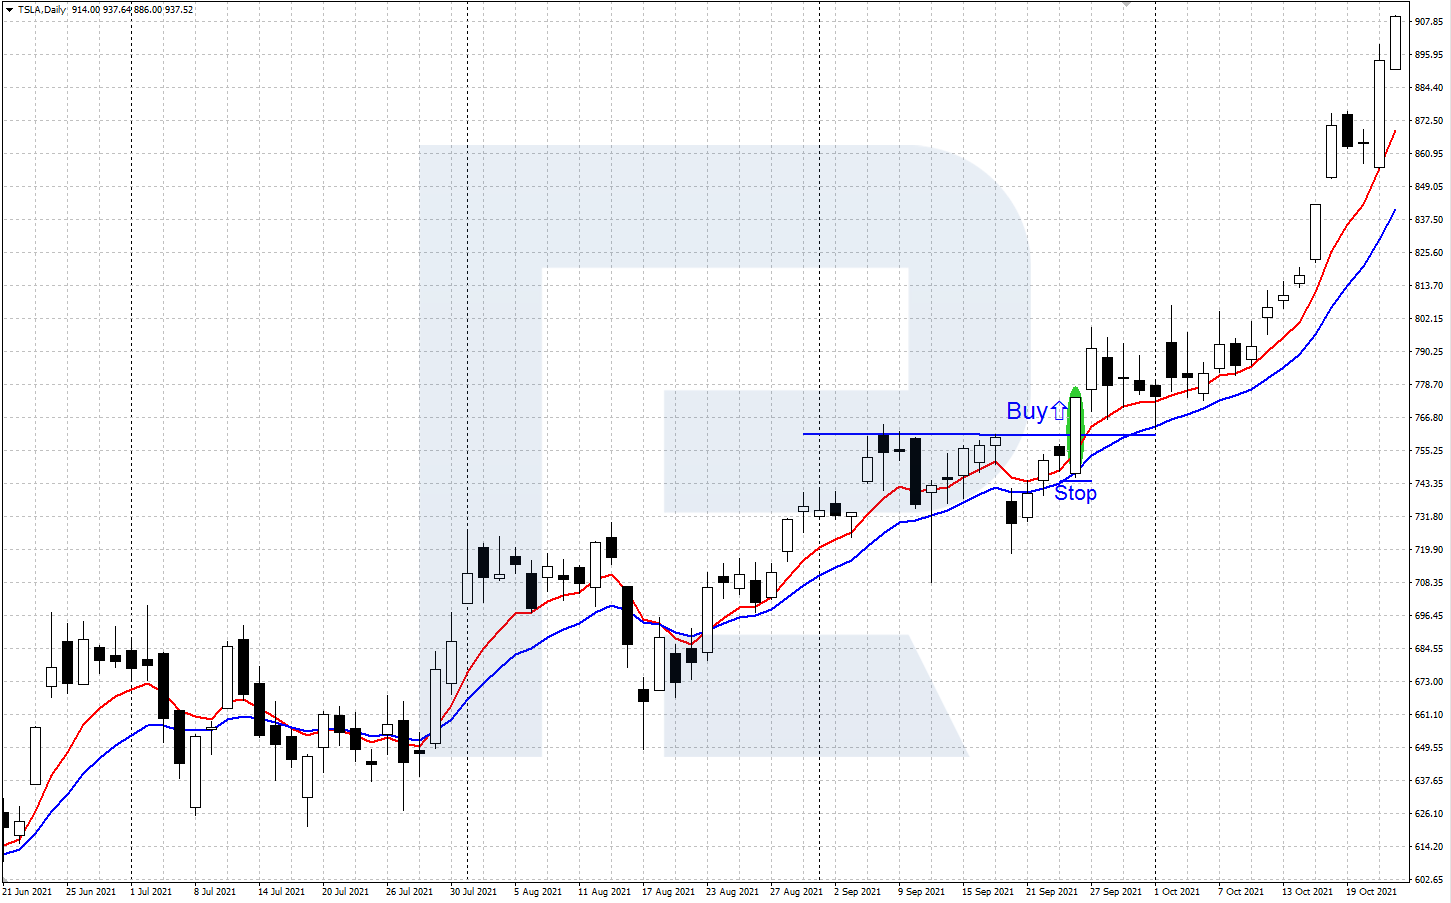
- A Bullish Marubozu forms at the price chart. The price bounces off the lows after a market decline or breaks through the resistance level in an uptrend.
- You can buy after a small downward correction or when the quotations rise above the highs of the white candlestick. Place your Stop Loss behind the low of the pattern.
- Take your profit when a strong resistance level is reached or when some hints on a downward reversal appear.
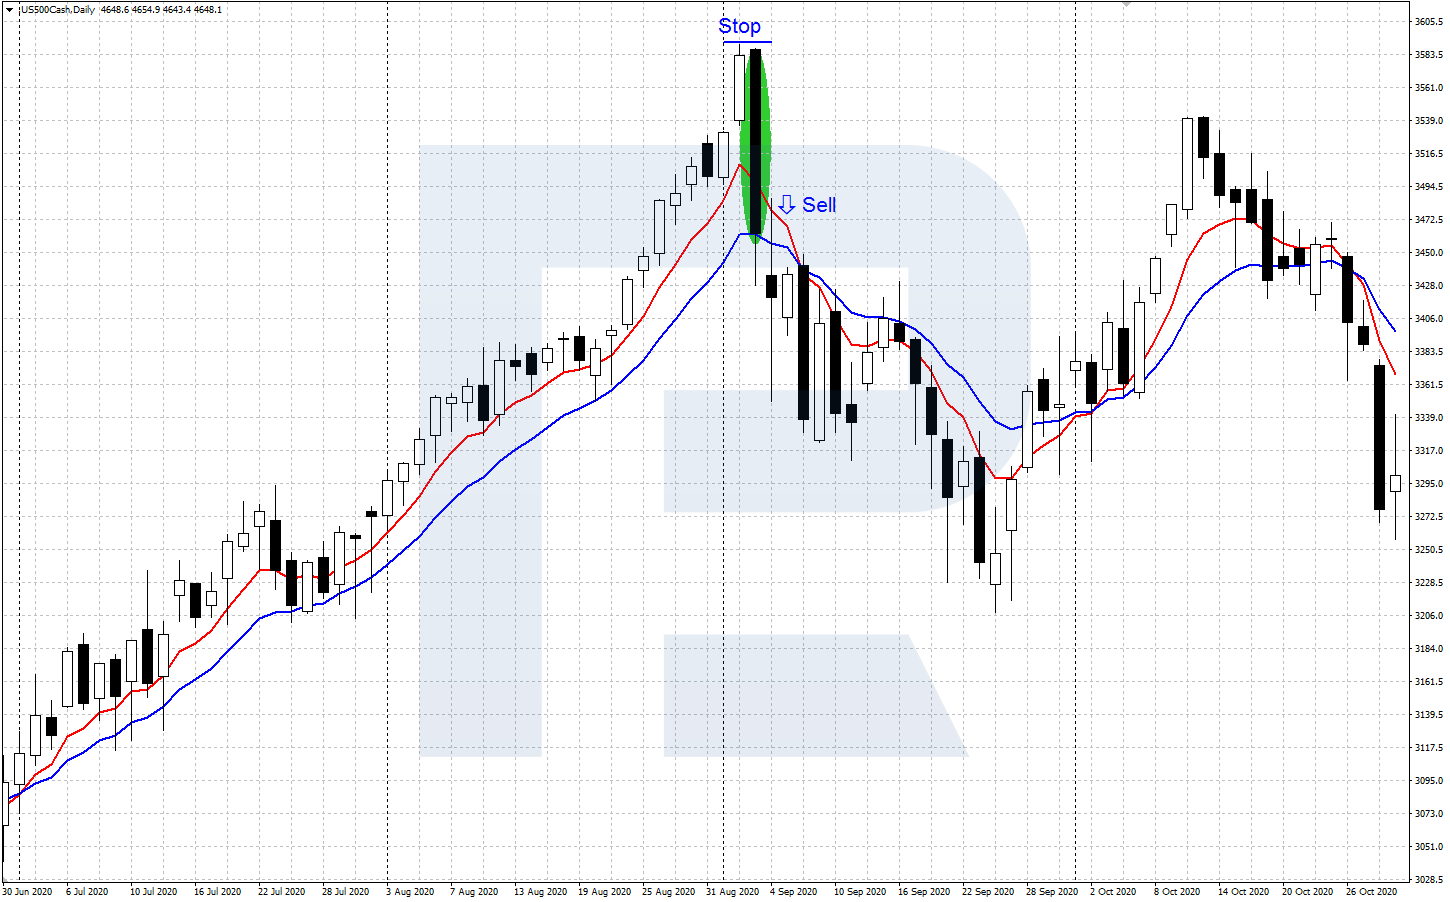
Bearish Marubozu: selling
For the bearish pattern, the scheme looks as follows:
- A Bearish Marubozu appears on the chart. The price bounces off the highs in an uptrend or breaks through the support level in a downtrend.
- Open a selling trade after a minor upward correction or a decline below the low of the black candlestick. Place your SL behind the high of the pattern.
- Take your profit after a decline to a strong support level or when any signs of a reversal upwards appear.
Advice on trading Marubozu
Using the pattern for trading, pay attention to the following details:
- The body of the candlestick must be large, standing out on the chart compared to preceding candlesticks.
- Marubozu may have small shadows, up to several points.
- This is a universal pattern that can be traded as a reversal or trend continuation pattern depending on its position on the chart.
- Use the pattern alongside support and resistance levels from classic tech analysis.
- Control your risks when using leverage, placing protective Stop Loss orders.
Bottom line
The Marubozu candlestick pattern is universal: depending on the place where it forms, it can predict a reversal or trend continuation. It is quite a rare guest on charts but a strong one.
Use the pattern alongside support/resistance levels and tech indicators. Before you get started, practice on a demo account.
Read more about other candlestick patterns on our blog:


