How to Trade the Right Moment Strategy

6 minutes for reading
In this review we will look at the "Right Moment" indicator strategy. It is based on identifying and using overbought and oversold zones in trading. How to set up the indicators, and buy and sell using the strategy – find the answers to these questions and examples in our article.
Description of the “Right Moment” strategy
The "Right Moment" strategy is mainly designed to be used in a flat, sideways market movement. It requires the price to be in a limited sideways range for at least a week.
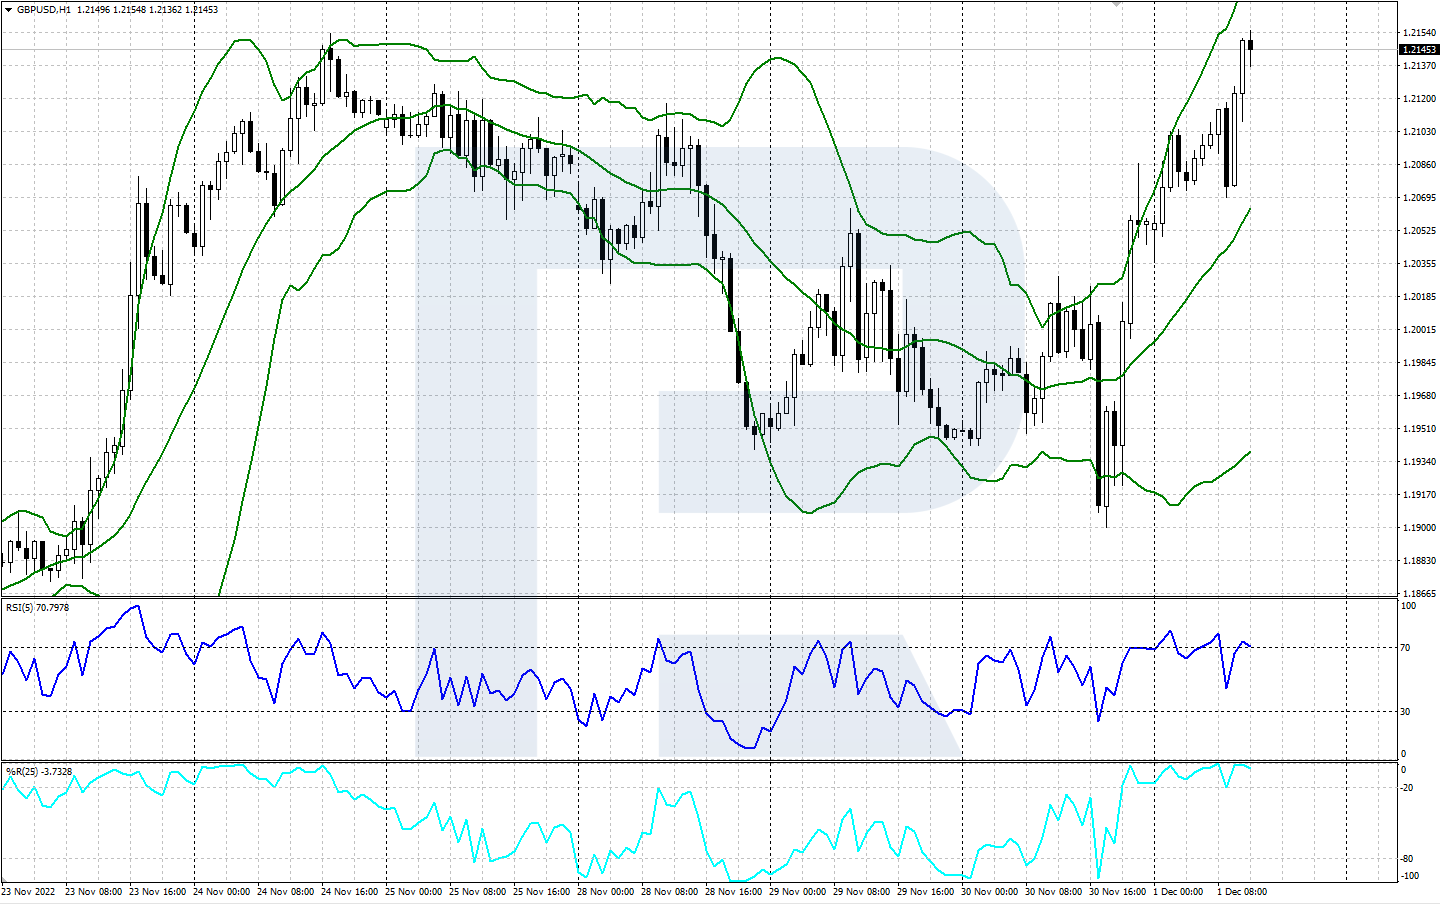
The strategy is based on signals from the Bollinger Bands trend indicator and two oscillators - Williams' Percent Range and Relative Strength Index (RSI). It can be used for trading different financial instruments. The recommended time frames are M15 and H1.
The "Right Moment" uses overbought and oversold zones to search for trading signals. They describe short-term extreme deviations of market instrument prices from average values: overbought - too high, oversold - too low. These zones are identified by the Williams' Percent Range and RSI oscillators.
Complementing the strategy is the use of the rebound of quotations from the outer limits of the Bollinger Bands indicator channel, which act as dynamic support or resistance levels. These boundaries serve as a reference point for opening and closing positions according to the strategy. The combined use of the signals of the three indicators is designed to help find promising trades in the market.
How to set up indicators for trading the “Right Moment” strategy
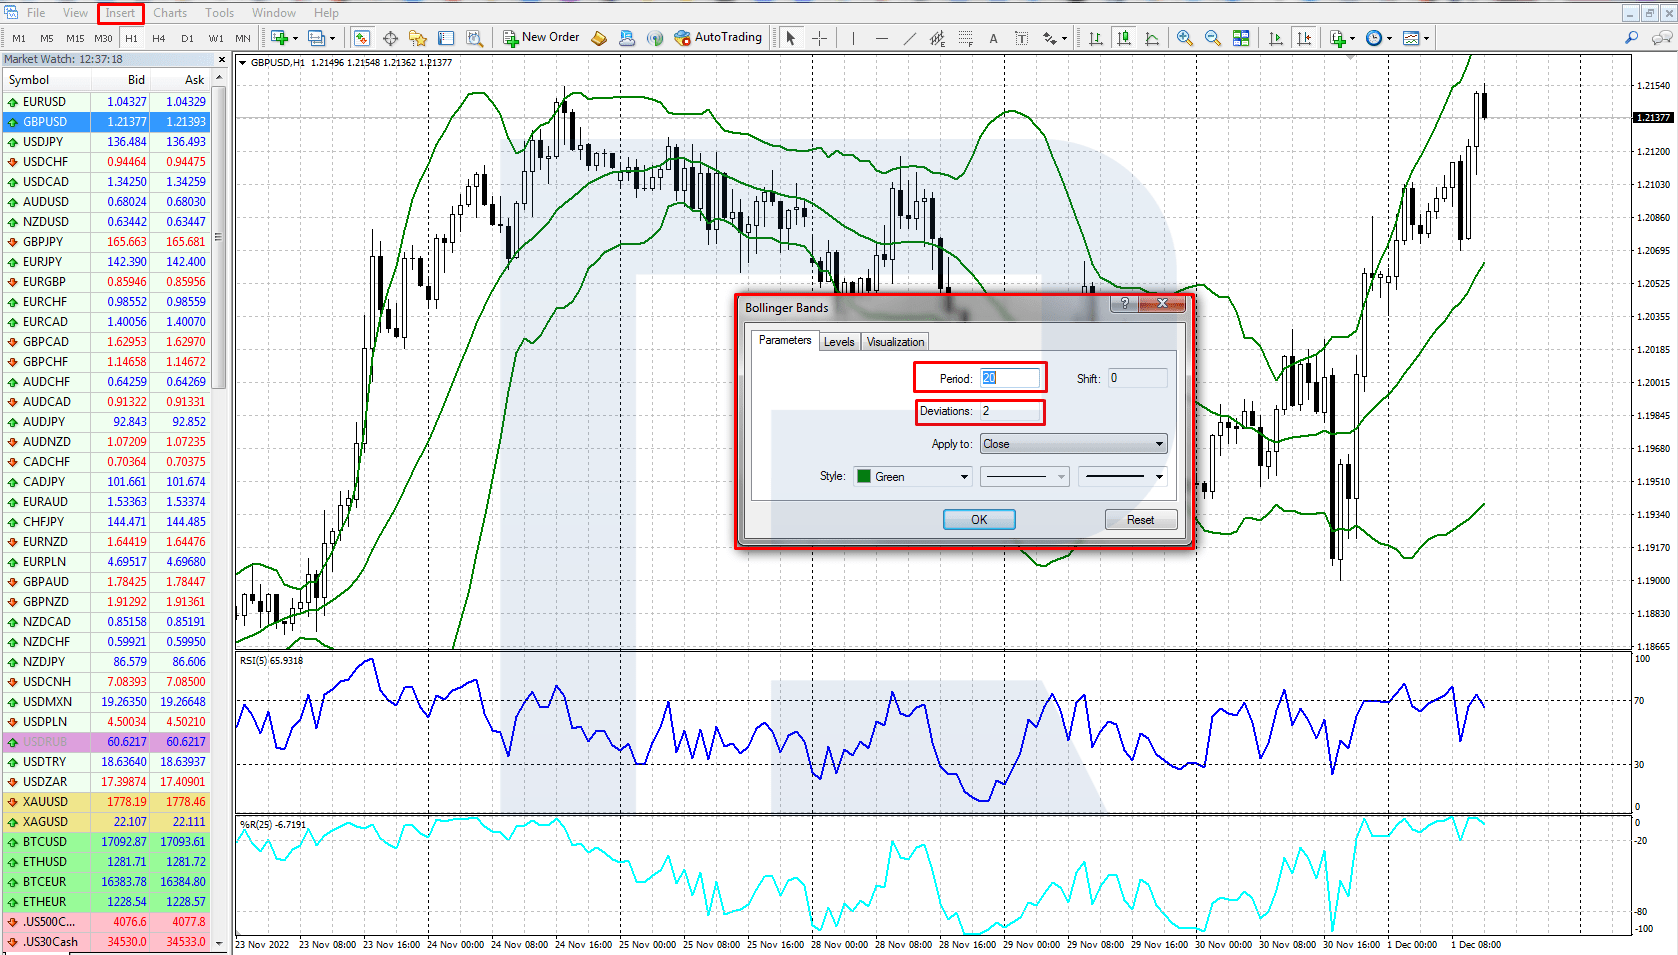
To search for trading signals using the "Right Moment" strategy, you need to install three indicators - Williams' Percent Range, Relative Strength Index and Bollinger Bands - on the chart of a financial instrument. In popular MT4 and MT5 trading platforms, you can install indicators on the chart through the main menu: Insert / Indicators.
In their settings window, select the following options
- Bollinger Bands: period 20, deviation 2.
- Williams' Percent Range: period 25. The overbought and oversold zones are set at -20 and -80, respectively.
- Relative Strength Index (RSI): period 5. The overbought and oversold zones are set at 70 and 30, respectively.
How to buy with the “Right Moment” strategy
The conditions for opening a buy position:
- The Williams' Percent Range and RSI indicators should fall into oversold territory, below -80 and 30 levels respectively.
- When the RSI crosses the 30 line upwards, there should be a confirmation from Williams: the indicator line crosses the -80 line upwards. At this point the price should be near the bottom of the Bollinger Bands channel.
- A buy position is opened and the Stop Loss is set at the local low on the price chart.
- Minimum Take Profit can be fixed when the price reaches the middle Bollinger Bands line, if the price stops and shows a downward reversal. If there is a strong upward movement and price quickly passes upwards the middle line, Take Profit is closed near the upper boundary of Bollinger Bands. The Williams' Percent Range indicator can be used as a guide: when the price rebounds into the overbought zone, it reverses and crosses the -20 line downwards, which is a signal to close the position.


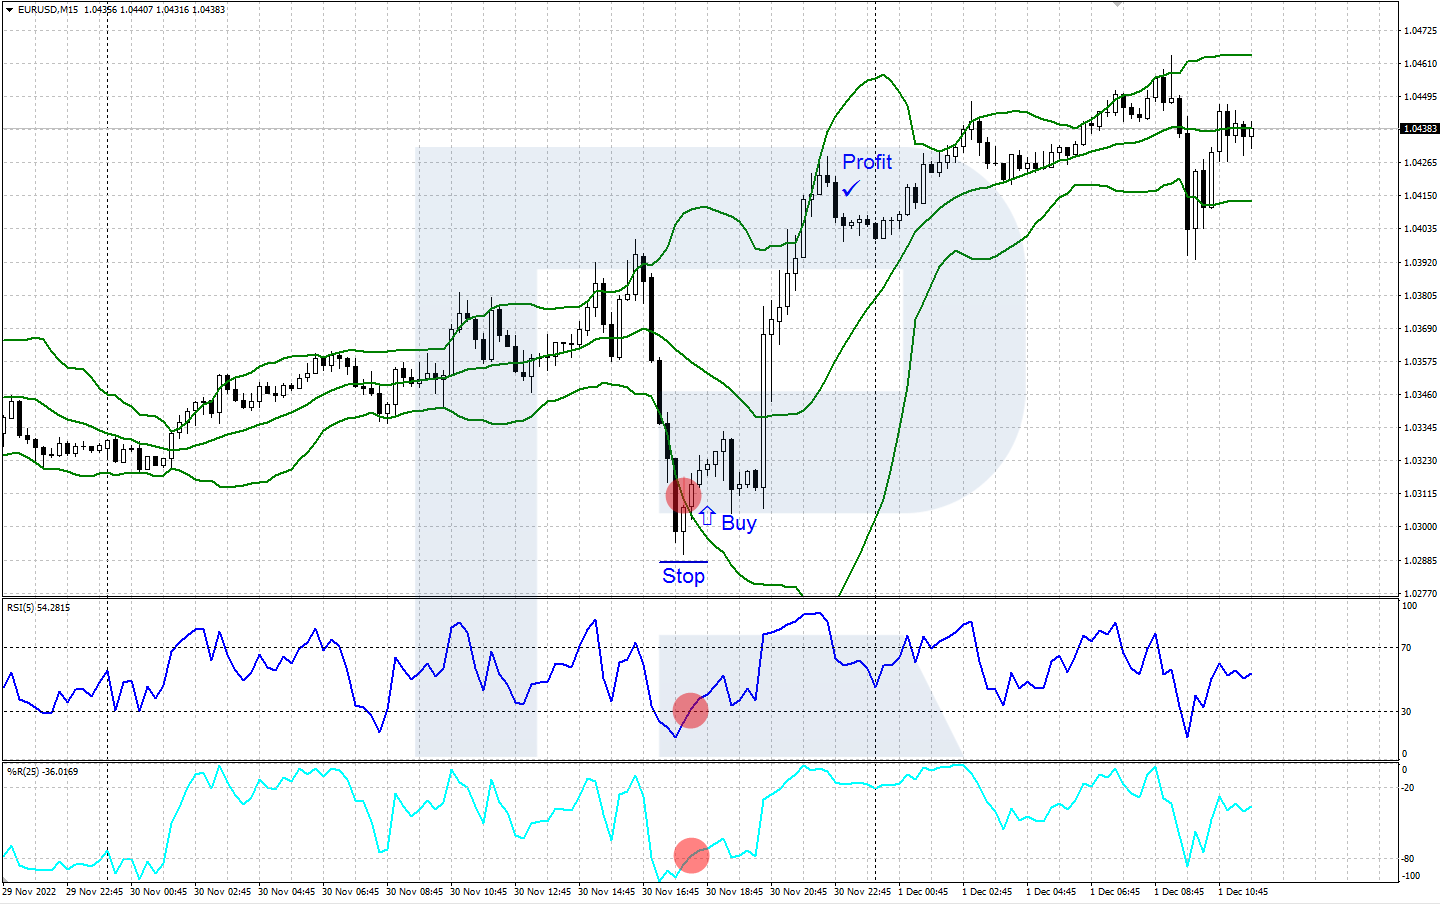
An example of buying with the “Right Moment” strategy
- On the M15 timeframe of the EUR/USD currency pair, the Williams' Percent Range and RSI indicators have dipped into oversold territory.
- Buy opens when the price rebounds from the lower boundary of the Bollinger Bands channel and the Williams' Percent Range and RSI exit the oversold area upwards.
- Stop Loss is set at the local low, Take Profit is taken at the upper boundary of the Bollinger Bands or following an upwards reversal and exit of the Williams' Percent Range from the overbought zone.
How to sell using the “Right Moment” strategy
The conditions for opening a sell position:
- The Williams' Percent Range and RSI indicators should move into overbought territory: above -20 and 70 levels respectively.
- When the RSI crosses line 70 downwards, there must be confirmation from Williams: the indicator line crosses line -20 downwards. At this point price should be near the upper boundary of the Bollinger Bands channel.
- A sell position is opened and the Stop Loss is set at the local maximum on the price chart.
- A small Take Profit can be fixed near the middle line of the Bollinger Bands if price stops and bounces up from it. If there is a strong downward movement and the price quickly passes down the middle line, Take Profit is closed near the lower boundary of Bollinger Bands. The Williams' Percent Range indicator may be used as a guide: when the price declines into an oversold area, the indicator reverses and crosses the -80 line downwards, which is a signal to close the position.


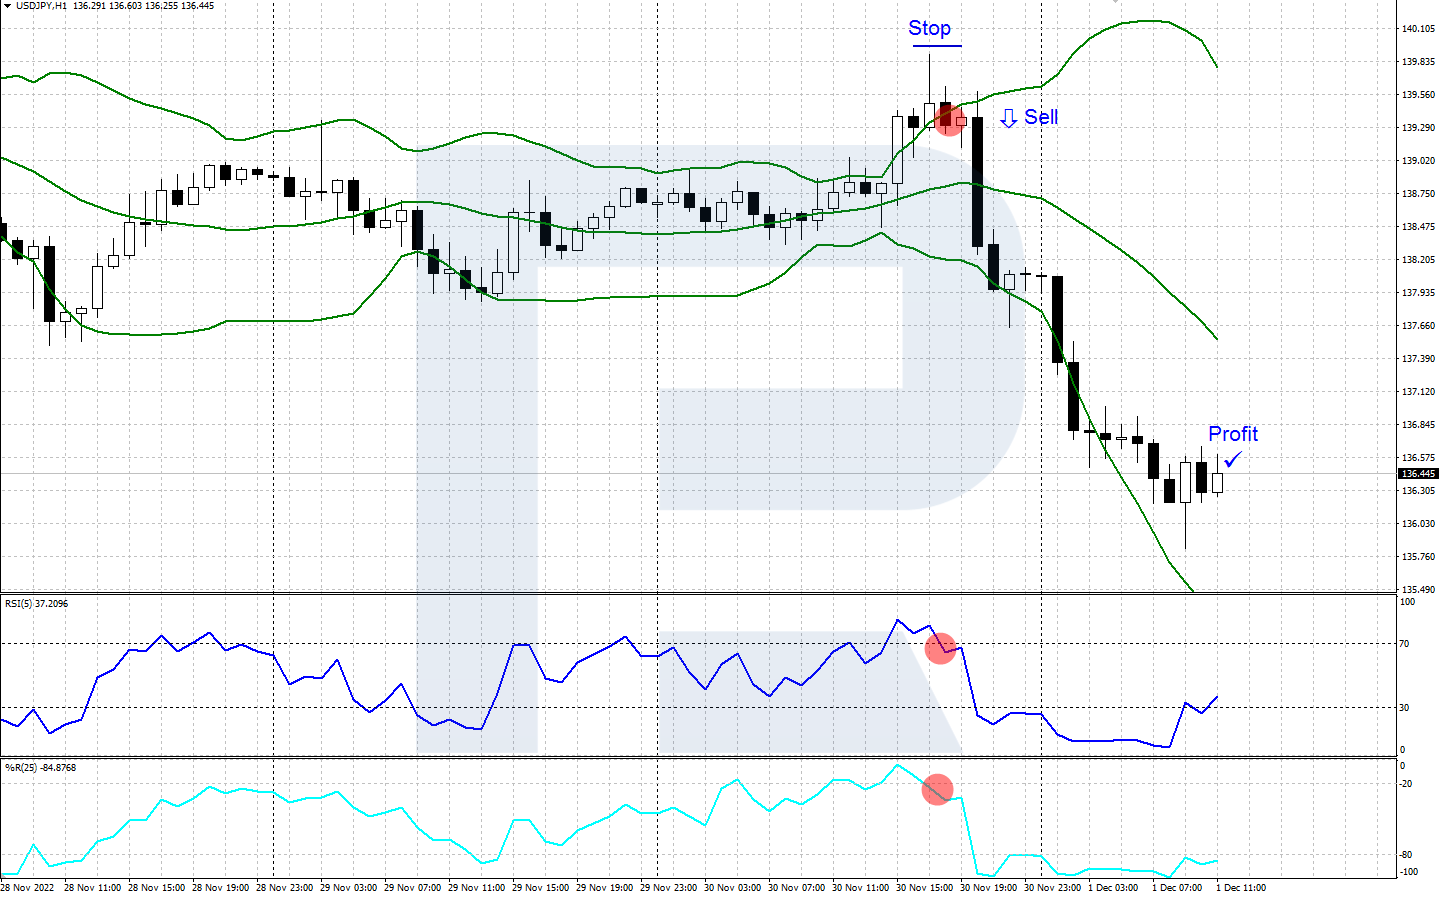
An example of the “Right Moment” sales strategy
- On the H1 timeframe of the USD/JPY currency pair, the Williams' Percent Range and RSI indicators have moved into an overbought zone.
- A Sell position is opened when the price rebounds from the upper boundary of the Bollinger Bands channel and the Williams' Percent Range and RSI move out of the overbought zone downwards.
- Stop Loss is set at the local maximum, Take Profit is taken at the lower boundary of the Bollinger Bands or following a downwards reversal and exit of the Williams' Percent Range from the oversold area.
Conclusion
The "Right Moment" trading strategy is based on the signals of three popular indicators - Bollinger Bands, Williams' Percent Range and Relative Strength Index (RSI). The transactions are based on the use of overbought and oversold zones of the oscillators, as well as the reversal of quotes from the borders of the Bollinger Bands price channel.
This strategy is versatile enough to be used on a variety of trading instruments and time frames. Before using it in real trading, it is advisable to test the performance of this strategy on historical data using a demo account.


