How to Trade the Three Moving Averages + MACD Strategy

5 minutes for reading
In this article, we will look at a medium-term indicator trading strategy based on using three Moving Averages and MACD. We will learn how to set these indicators on the chart and apply them in trading.
You can visit the RoboForex Market Analysis webpage for the latest forex forecasts.
How the Three Moving Averages + MACD strategy works
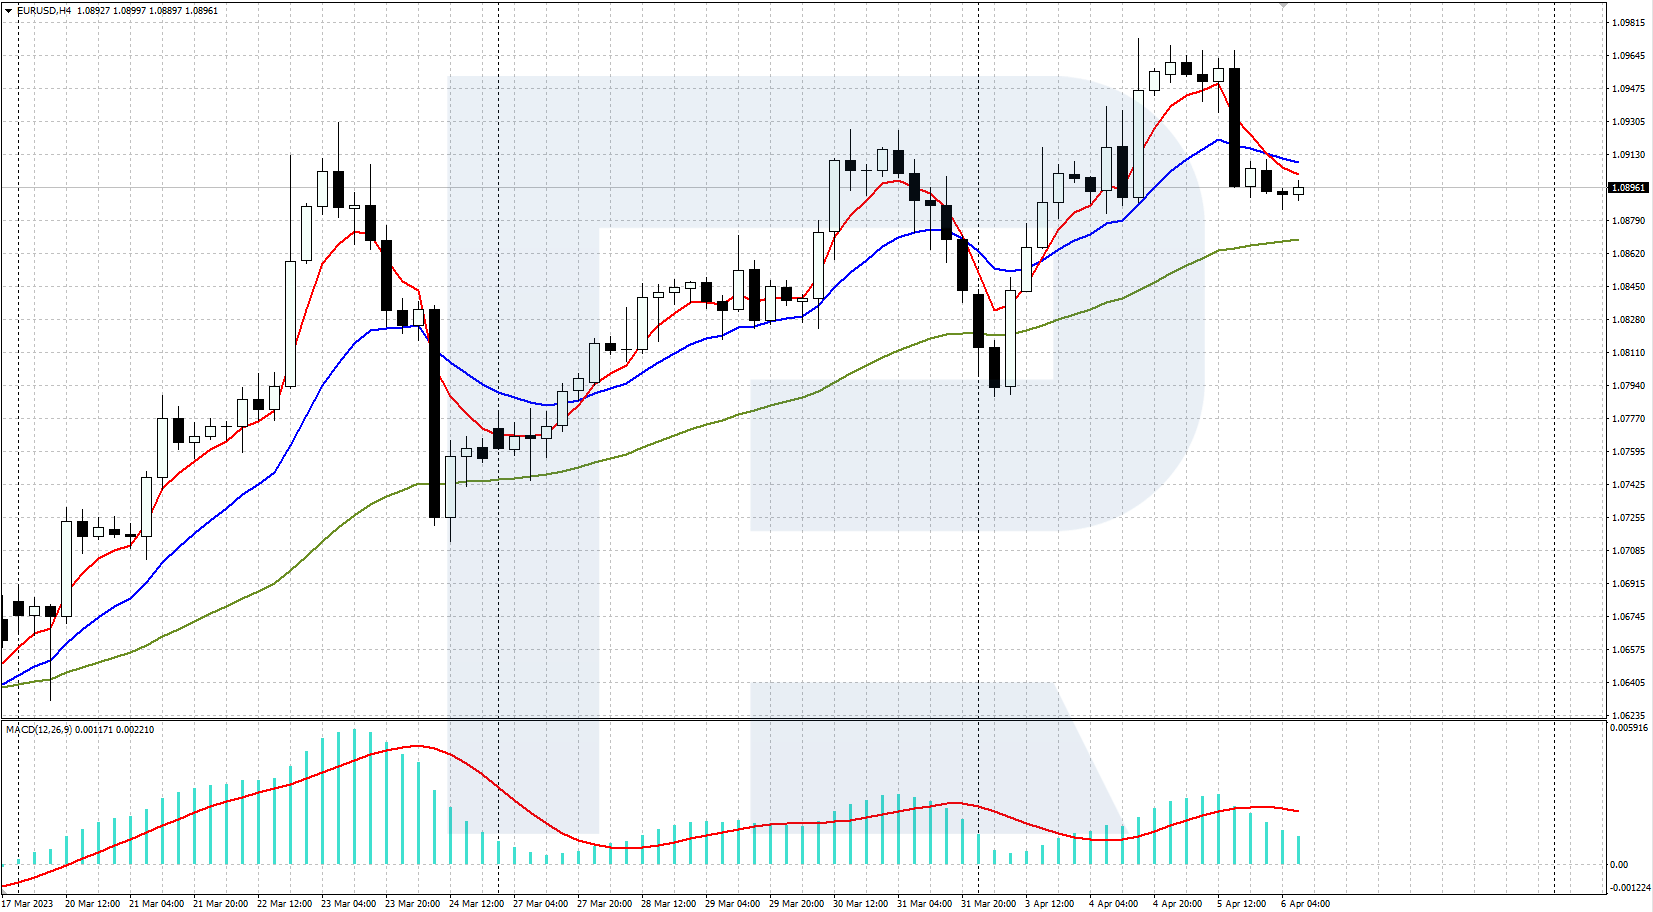
The "Three Moving Averages + MACD" strategy, as the name implies, is a trading system based on the combined use of trend indicators’ Moving Average (MA) and MACD (Moving Average Convergence/Divergence) oscillator signals. These are popular and in-demand tools, which are often used in various trading systems. To trade on the strategy, three exponential Moving Averages (EMA) with periods of 5, 15, and 50, and the MACD with parameters 12, 26, and 9 are applied to the chart.
The Moving Average has long been proven to be a simple and effective tool for trend following. In this strategy, the slow EMA (50) is used to identify the direction of the current trend and acts as a guide to limit risk, while the faster EMA (5) and EMA (15) are used to identify points to enter the market.
The MACD indicator belongs to the oscillator group. It helps to determine the trend direction, strength and duration, price range, and reversal levels and to receive trading signals. The MACD is used in this strategy to confirm the priority trading direction.
How this strategy works:
- When the EMA (5) crosses the EMA (15) from bottom to top, there is a buy signal. The price chart should be above the EMA (50), and the MACD histogram should be in the positive zone (above 0)
- When the EMA (5) crosses the EMA (15) from top to bottom, there is a signal to sell. The price chart should be below the EMA (50), and the MACD histogram should be in the negative zone (below 0)


How to set the Moving Average and MACD indicators
To set the Moving Average and MACD in the popular MetaTrader 4 and MetaTrader 5 trading platforms, follow these steps:
- Open the terminal and log in to your account.
- Select the chart of the desired currency pair.
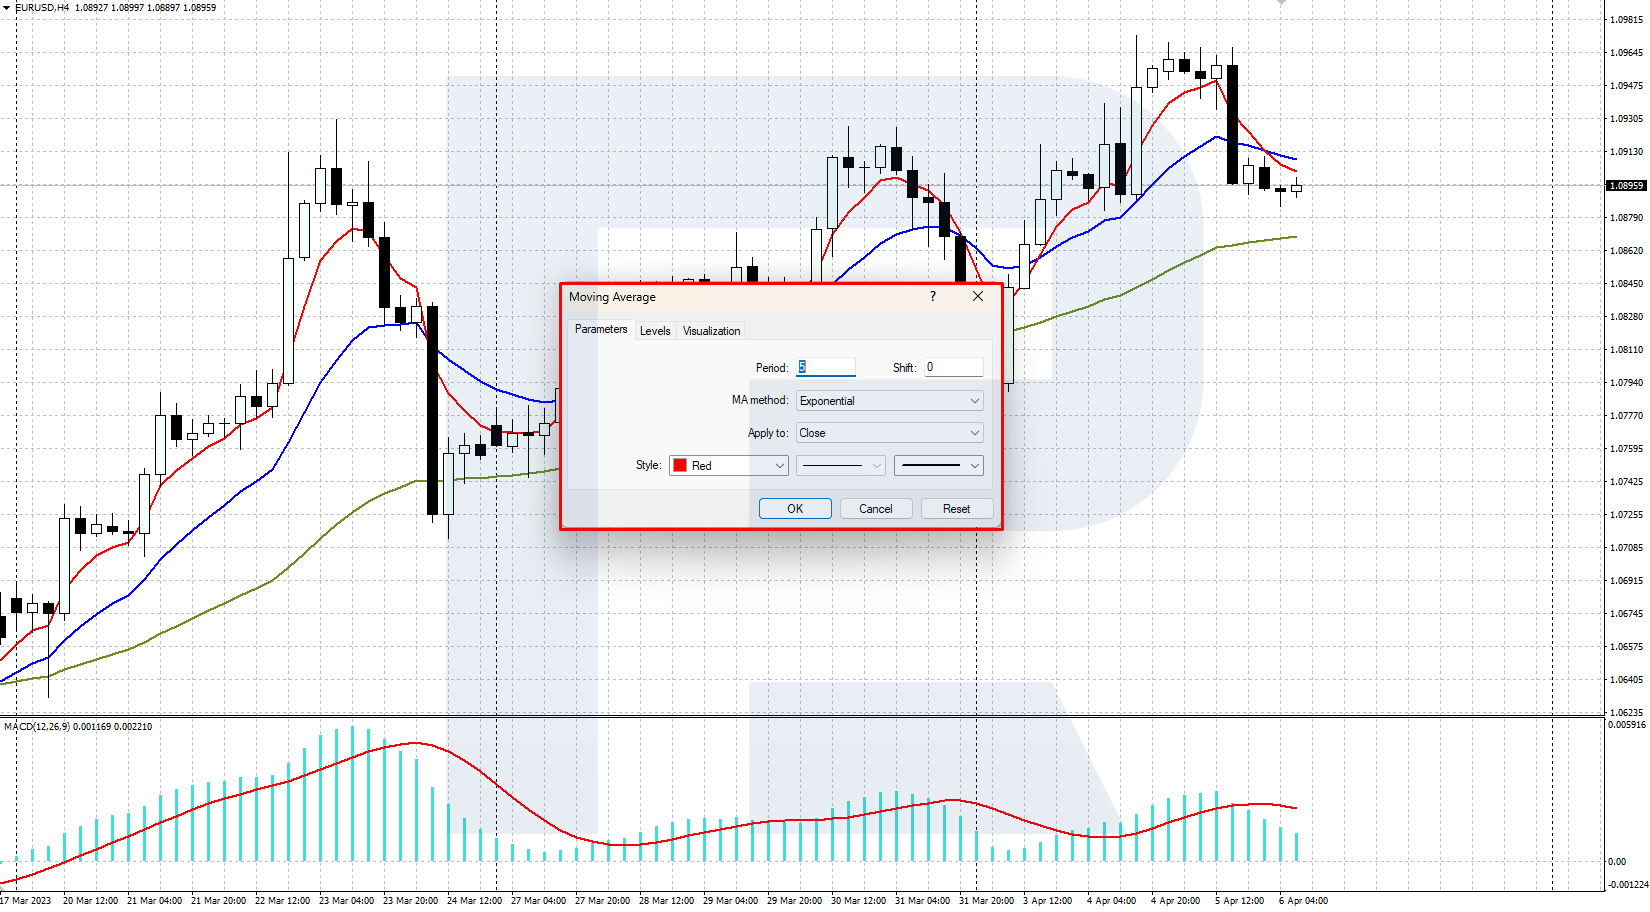
- From the main menu, click on Insert, then on Indicators, then on Trend; and select Moving Average.
- Select period 5, line colour and thickness, MA: Exponential, then click OK to apply the settings and close the indicator settings window.
- Repeat these steps to set up two more Moving Averages with periods 15 and 50.
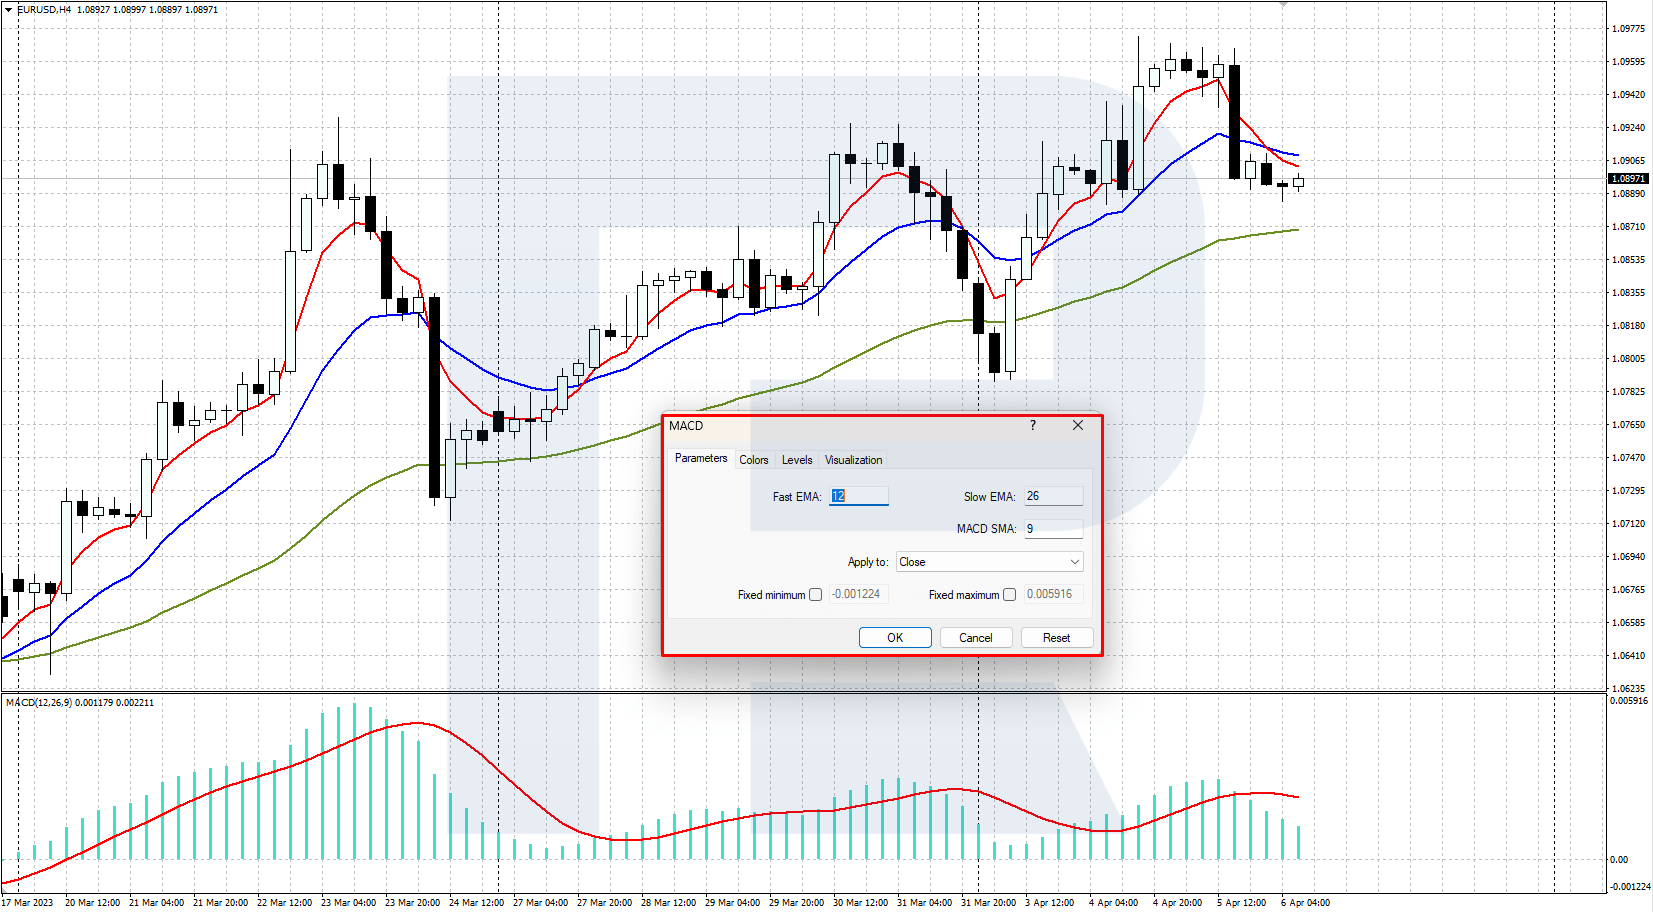
- From the main menu, press Insert, then Indicators, then Oscillators, and select MACD.
- Select Fast EMA: 12, Slow EMA: 26, MACD SMA: 9, and Apply to: Close. Then click OK to apply the settings and close the indicator settings window.
As a result, 3 Moving Averages and the MACD indicator will appear on the price chart, which will be used to search for trading signals according to the strategy.
How to use the strategy in trading
The Three Moving Averages + MACD strategy is primarily focused on the EUR/USD and GBP/USD currency pairs. Recommended chart timeframes - H4, D1. Recommended Take Profit (5 digits) for EUR/USD: H4 time frame - 1000 pips, D1 time frame - 2000 pips. Recommended Take Profit values (5-digit quotes) for GBP/USD: H4 time frame - 1250 pips, D1 time frame - 2500 pips. Stop Loss is set immediately after the EMA (50).
Three Moving Averages + MACD Buy Signal
- Prices begin to rise, EMA (5) crosses EMA (15) from bottom to top
- The price chart is above the EMA (50)
- The MACD histogram is in the positive zone (above 0)
- A buy position is opened, and the Take Profit value is set according to the above recommendations
- Stop Loss is set just below the EMA (50)
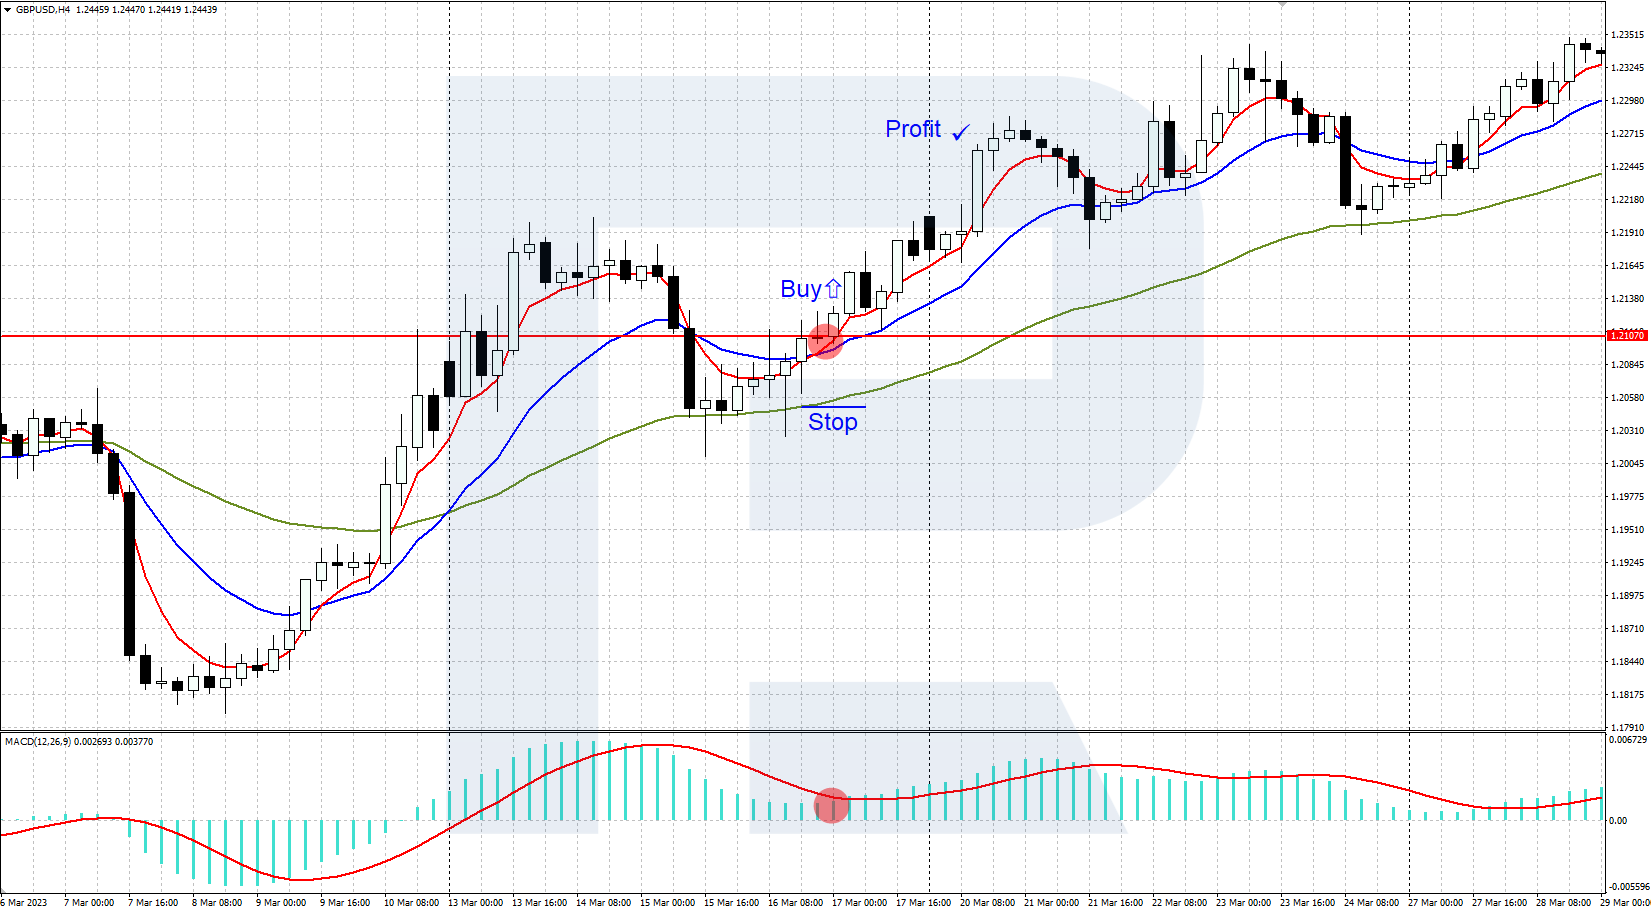
Three Moving Averages + MACD buying example
- On 17 March 2023, on the H4 chart of the GBP/USD currency pair, the red EMA (5) crossed the blue EMA (15) from bottom to top
- The price chart was above the green EMA (50) at this point
- The MACD histogram was in the positive zone (above 0)
- The buy position was opened at 1.21070, and Take Profit was set 1250 pips higher at 1.22320
- Stop Loss was set just below the EMA (50), at 1.20500


Three Moving Averages + MACD Sell Signal
- Quotes begin to decline, EMA (5) crosses EMA (15) from top to bottom
- The price chart is below the EMA (50)
- The MACD histogram is in the negative zone (below 0)
- A sell position is opened, and the Take Profit value is set according to the above recommendations
- Stop Loss is set just above the EMA (50)
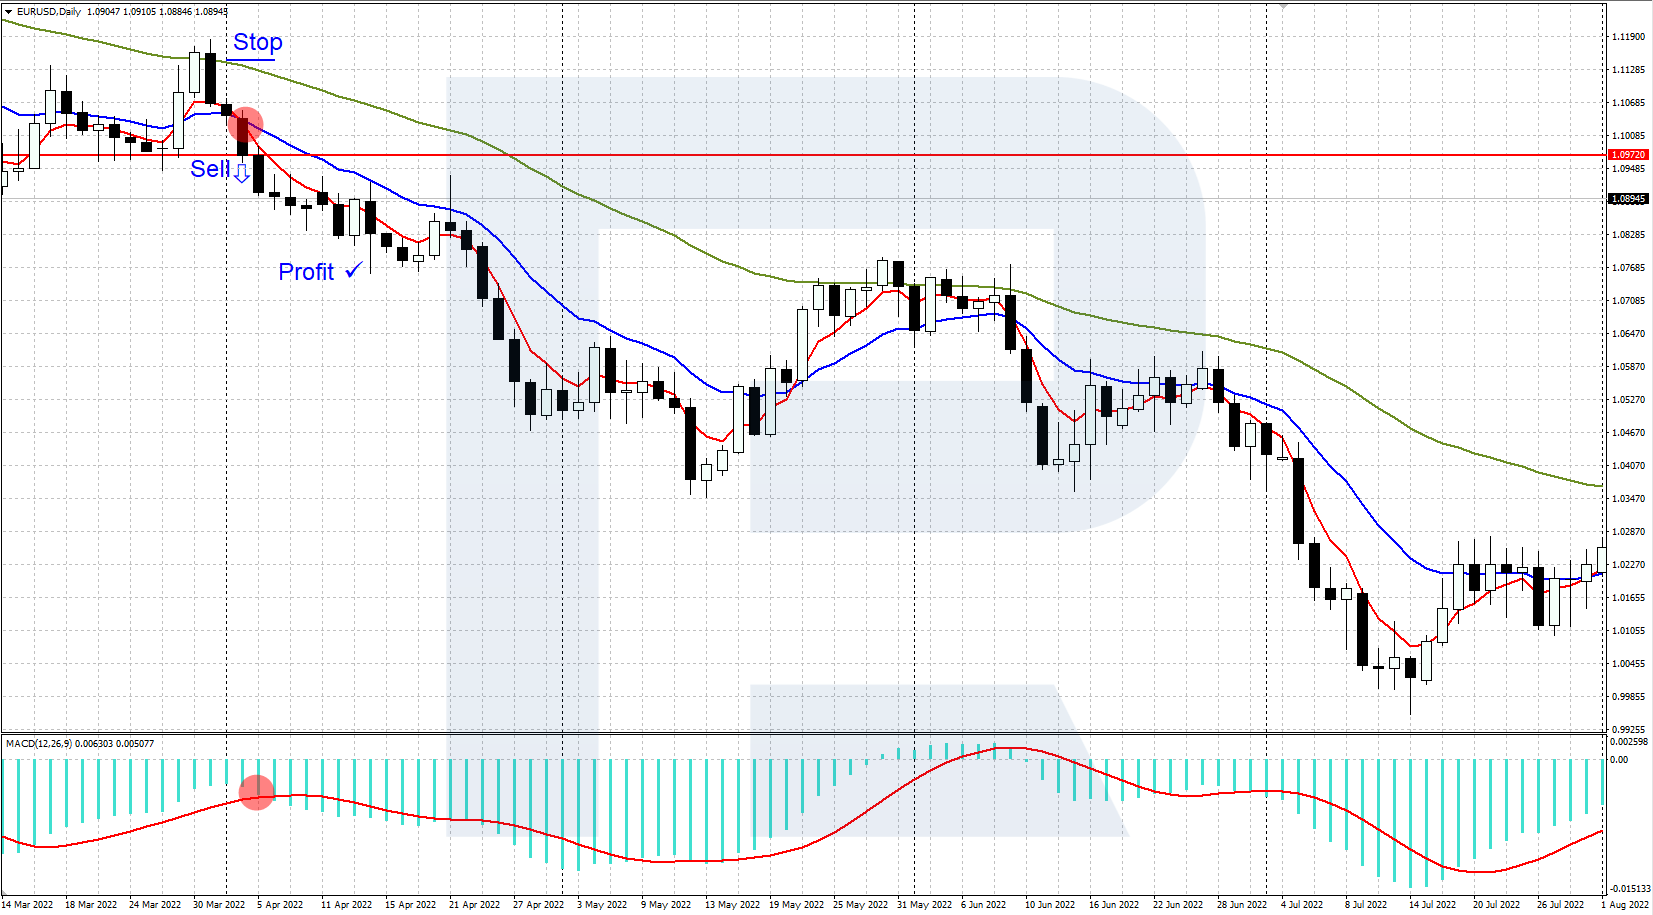
Sales example for the Three Moving Averages + MACD strategy
- On 04 April 2022, on the EUR/USD D1 chart, the red EMA (5) crossed the blue EMA (15) from top to bottom
- The price chart was below the green EMA (50) at this point
- The MACD histogram was in the negative zone (below 0)
- The Sell position was opened at 1.09730, and Take Profit was set 2000 pips lower at 1.07730
- Stop Loss was set just above the EMA (50), at 1.11400
Conclusion
This strategy is a simple trading system based on signals from the popular Moving Average and MACD indicators. The Moving Average signals determine the trading direction and provide entry points, while the MACD histogram confirms this information. We recommend using this strategy in combination with technical analysis tools to make it more reliable. It is especially important to test it on a demo account before using it.


