How to Trade With the "Cutting Pips" Strategy

7 minutes for reading
Today we will look at the “Cutting Pips” short-term trading strategy which applies such indicators as Bollinger Bands, the Relative Strength Index, and the Average Directional Index. It’s meant to work on the major currency pairs EUR/USD, GBP/USD, AUD/USD, and USD/CAD on the M5 chart.
This article addresses the features of the strategy and how to use three scalping indicators at a time. We will explain the rules for opening positions and the options for setting Stop Loss and Take Profit.
Description of the “Cutting Pips” strategy indicators
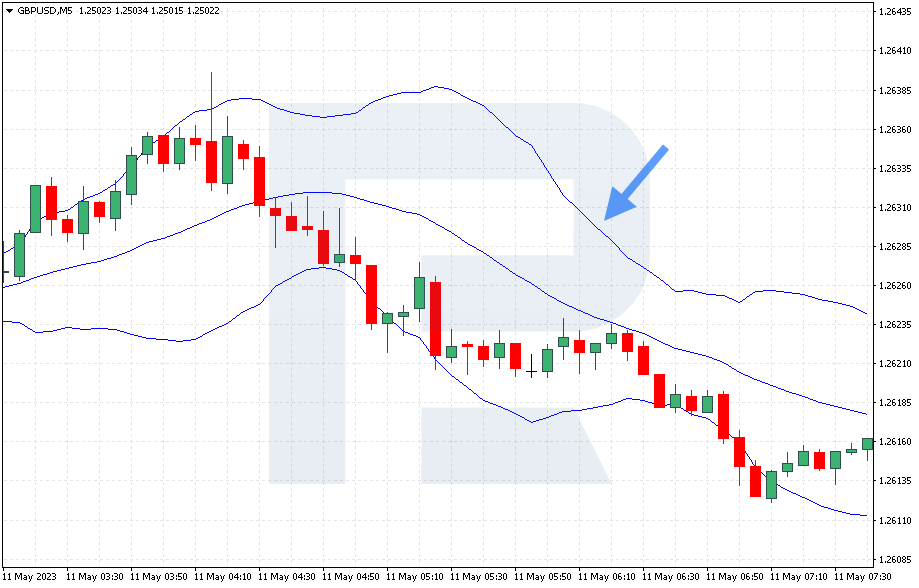
- Bollinger Bands (BB) – this indicator forms a band on the price chart, within which the quotes stay for 95% of the time, according to the indicator’s developer. When the price breaks out of this range, it signals that it may reverse and move in the opposite direction. This characteristic of the indicator is also applied in the “Cutting Pips” strategy: the price must test one of the extreme bands to form the first signal for opening a trade
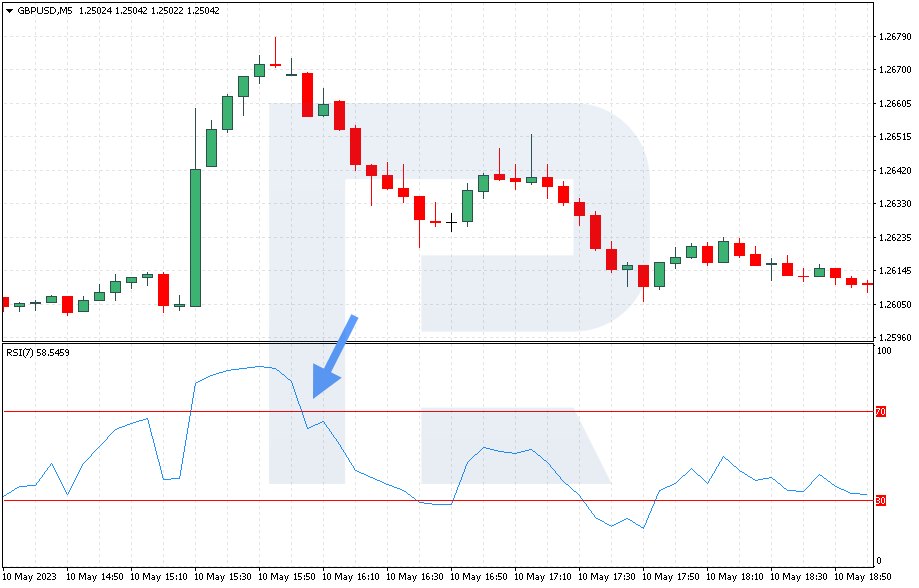
- Relative Strength Index (RSI) – this is a momentum indicator used to measure the strength or rate of a change in the price movement to analyse overbought or oversold conditions. When the indicator rises above the level of 70, it signals that the asset is overbought and its price might soon be declining. When the RSI value falls below the level of 30, it is a signal that the asset is oversold, and its price might soon be increasing. According to the “Cutting Pips” strategy, the indicator values should be above 70 when selling and below 30 when buying
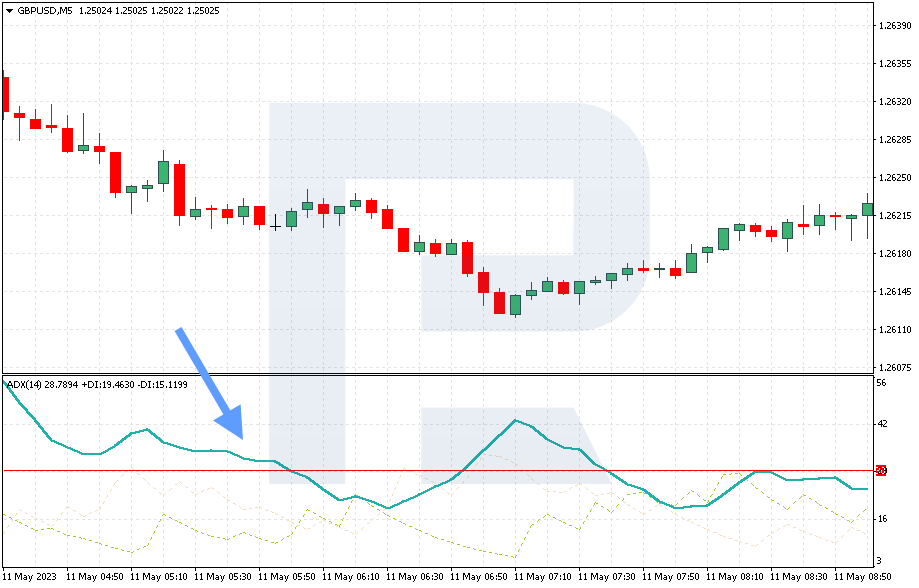
- Average Directional Index (ADX) – this helps determine a trend in the market and its strength, but it does not show the direction of the price movement. The indicator ranges from 0 to 100. It is believed that if the ADX value is in the range of 0-25, the market does not have a prevailing trend, while values greater than 25 signal a trend. When trading the “Cutting Pips” strategy, the ADX values should be below 30, which will be the last signal to open a trade
How to set the “Cutting Pips” strategy indicators
To set the indicators on the popular trading platforms МetaTrader 4 and МetaTrader 5, follow these steps:
- Open the terminal and log in to your account.
- Select the chart of your desired financial instrument.
- From the Main Menu, go to – Insert – Indicators – Trend, and then select the Bollinger Bands.
- Click OK to close the settings window.
- From the Main Menu, go to – Insert – Indicators – Oscillators, and then select the Relative Strength Index.
- In the pop-up settings window, select period 7.
- Click OK to apply the parameters and close the settings window.
- From the Main Menu, go to – Insert – Indicators – Trend, and then select the Average Directional Index.
- Click OK to close the settings window.
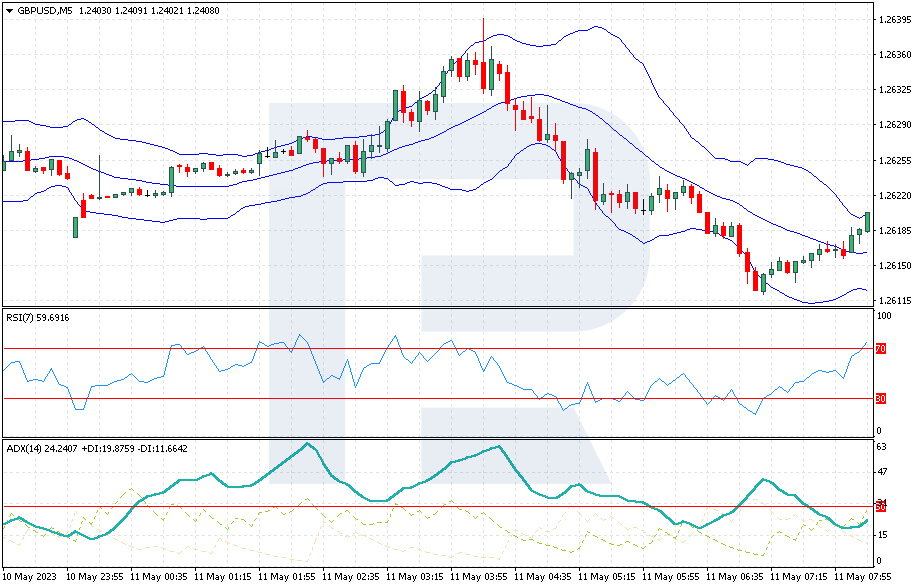
As a result, the chart will show all three indicators – Bollinger Bands, the Relative Strength Index, and the Average Directional Index.
How to buy with the “Cutting Pips” strategy
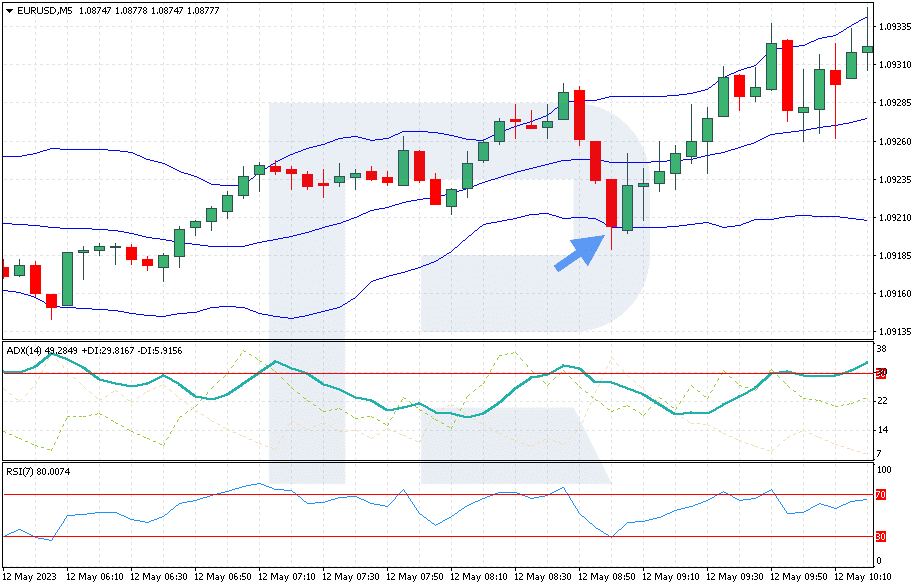
- On the M5 chart, the price is testing the lower band of the Bollinger Bands or falling below it. Given that prices should remain within the range between the indicator’s upper and lower bands for 95% of the time, it can be assumed that the price is likely to exit the range by chance and soon show a reversal
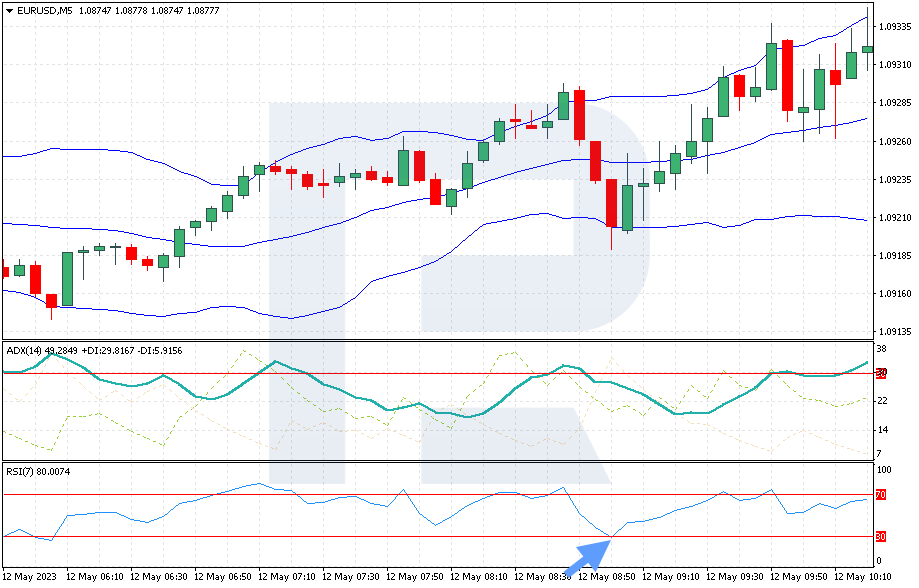
- The RSI value dropped below 30, which indicates that the asset is oversold and a rapid rise in price is to be expected
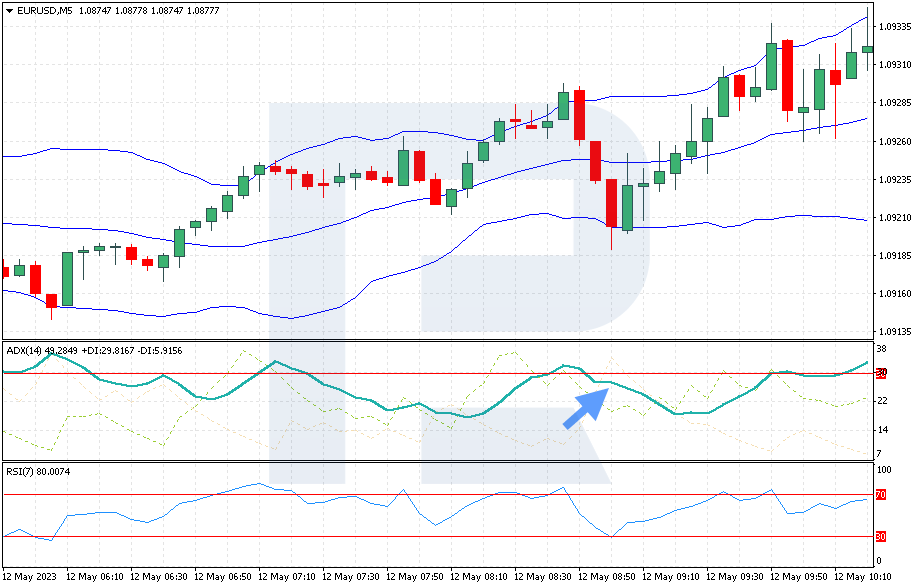
- The ADX value is below 30, which confirms the absence of a strong trend
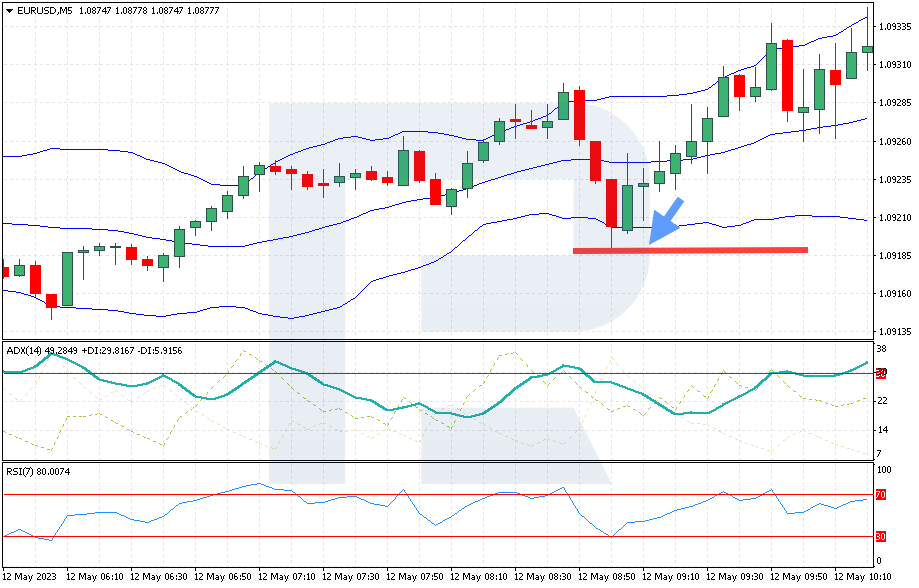
- A buy position should be opened when the price rises above the lower band of the Bollinger Bands
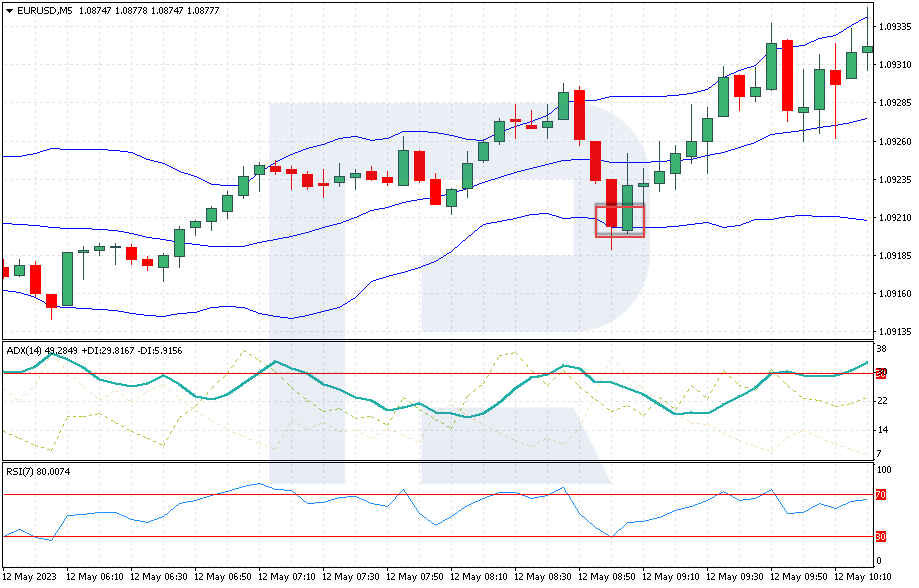
- Take Profit should be set at the level of the Bollinger Bands’ average line or 3-5 pips above the entry point
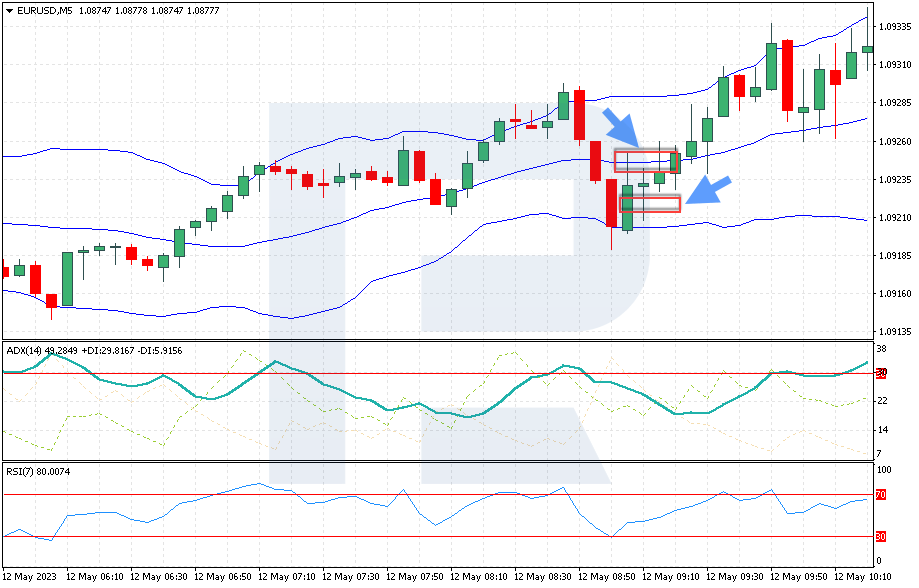
- Stop Loss should be set 3 pips below the lower band of the Bollinger Bands
Example of buying with the “Cutting Pips” strategy
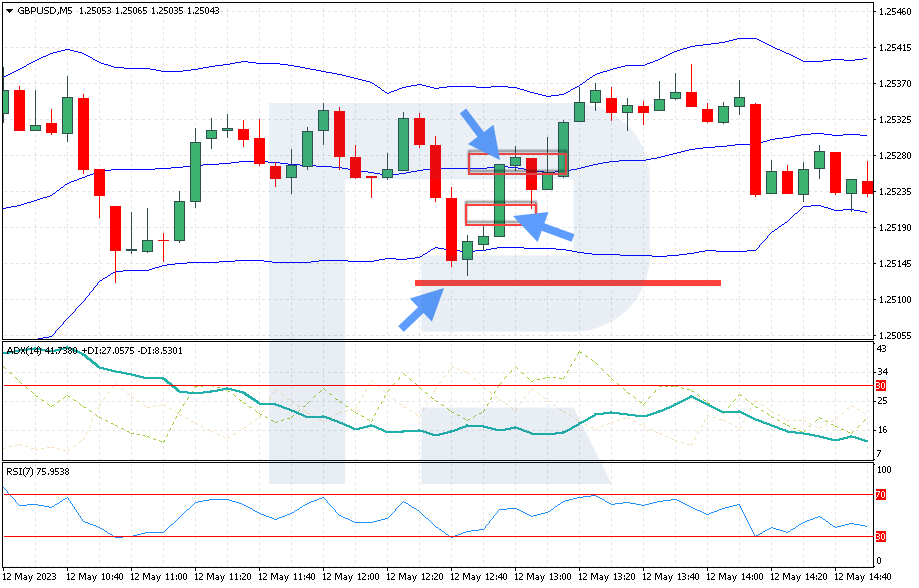
The GBP/USD currency pair traded sideways on 12 May 2023, but later broke through the lower Bollinger Bands. This was the first signal to open a long position. With the RSI value falling below 30, this was the second signal. The ADX value, which was below 30 confirming the absence of a trend, was the third signal to buy.
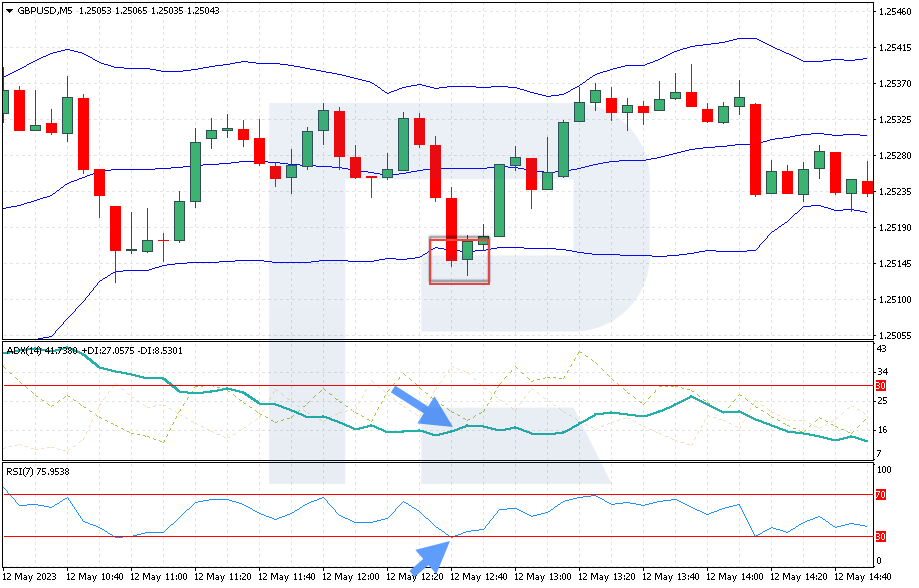
A buy position was opened at the 1.2517 level when the price rose above the lower band of the Bollinger Bands. Take Profit was set at 1.2526 at the level of the BB midline and the second choice for setting it was at the 1.2520 or 1.2523 level. Stop Loss was set at 1.2513, which is 3 pips below the lower Bollinger Bands.


How to sell with the “Cutting Pips” strategy
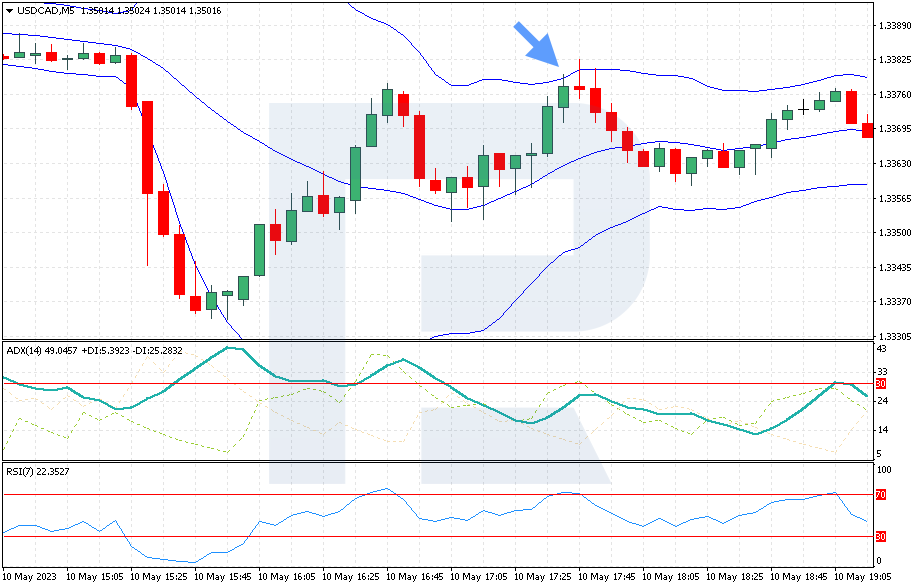
- On the M5 chart, the price is testing the upper band of the Bollinger Bands or rising above it. Given that prices should remain within the range between the indicator’s upper and lower bands for 95% of the time, it is likely that the price is out of the range and will soon show a reversal
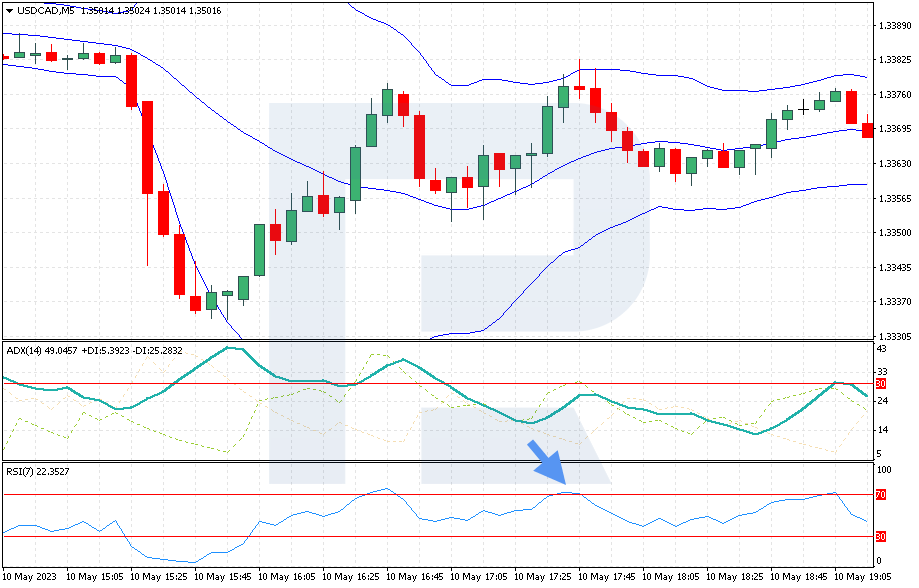
- The RSI value rose above 70, which is a sign that the asset is overbought, and its price will decline soon
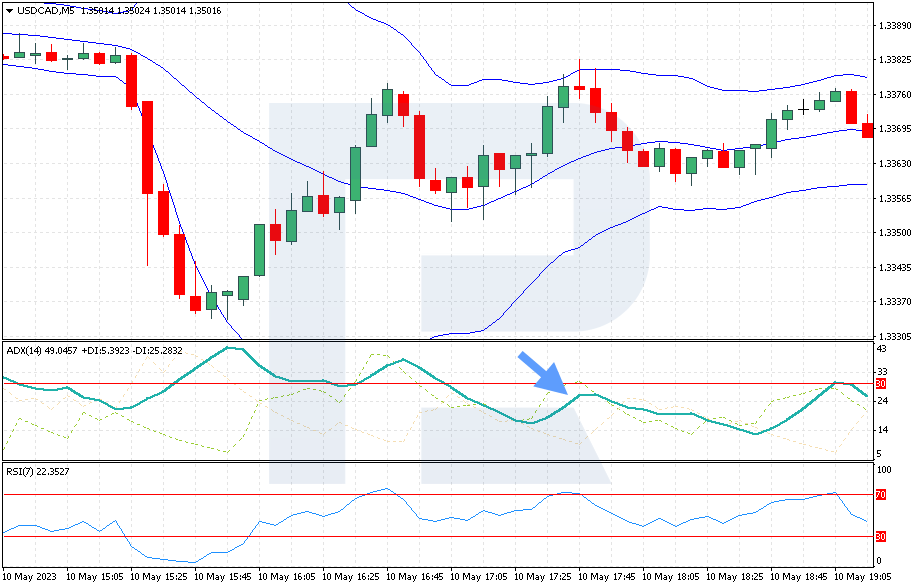
- The ADX values are below 30, thus confirming the absence of a strong trend
- A sell position should be opened when the price drops below the upper band of the Bollinger Bands
- Take Profit should be set at the level of the Bollinger Bands midline or 3-5 pips below the entry point
- Stop Loss should be set 3 points above the upper band of the Bollinger Bands
Example of selling with the “Cutting Pips” strategy
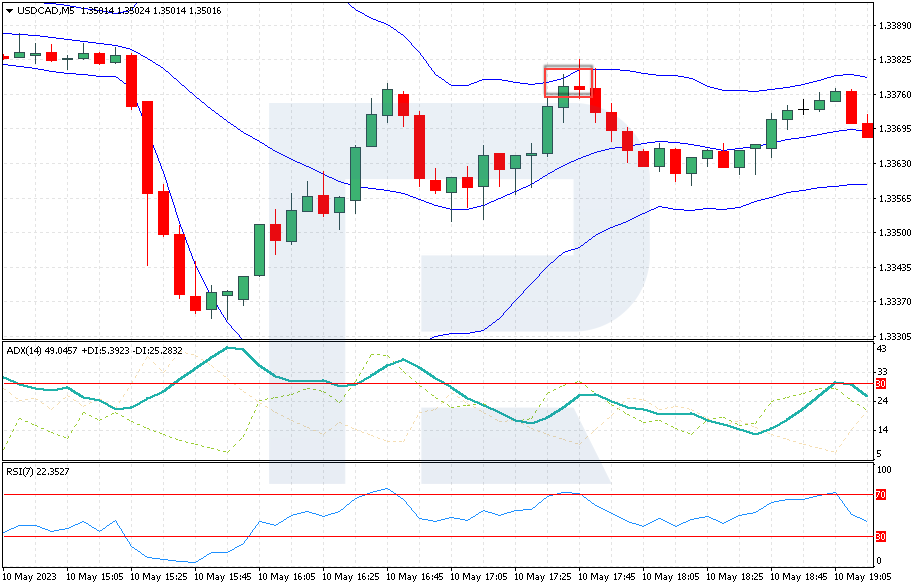
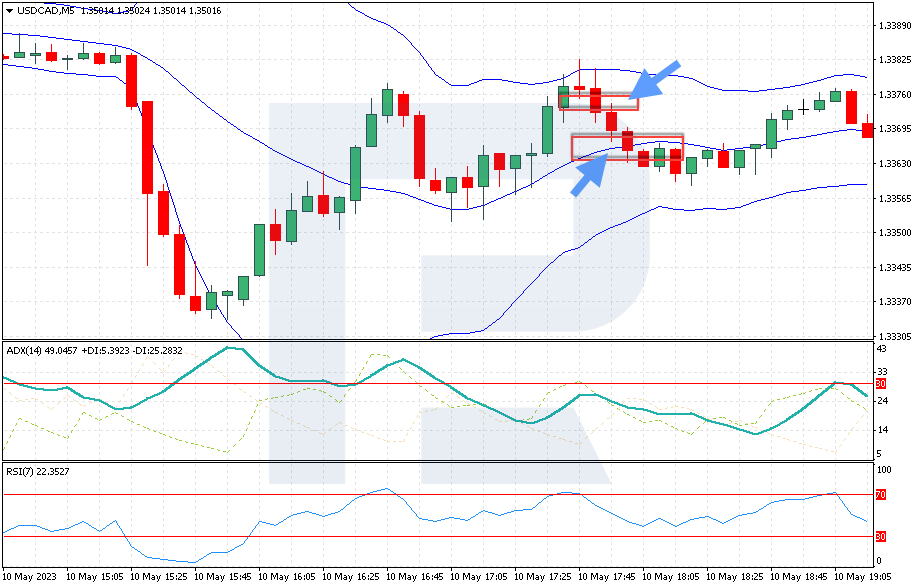
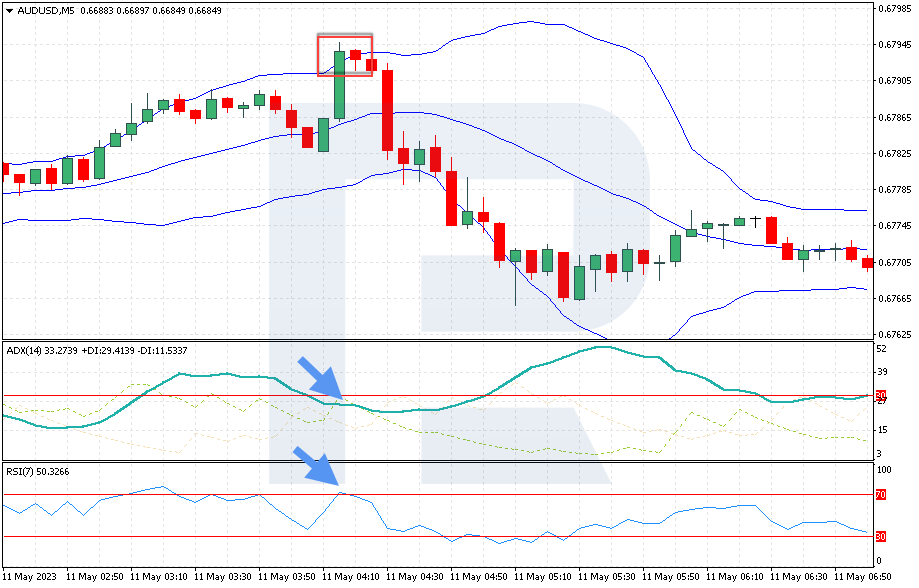
The quotes of the AUD/USD currency pair went up on 11 May 2023 and crossed the upper band of the Bollinger Bands. The ADX values were above 30, which did not allow for opening a sell position according to the strategy. Later, the price tested this level. The RSI values rose above 70, and this was the second signal. The ADX fell below 30, which confirmed the absence of a trend and was the third signal to sell.
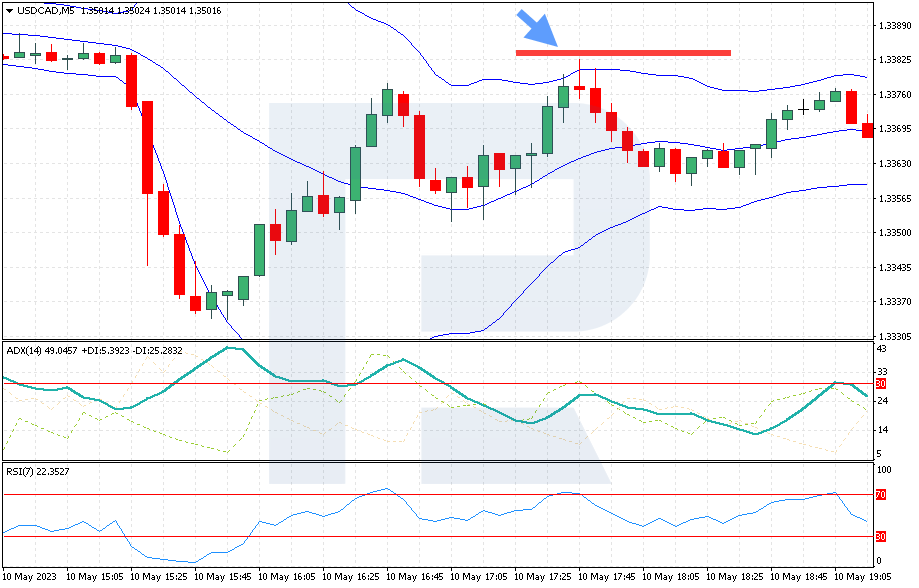
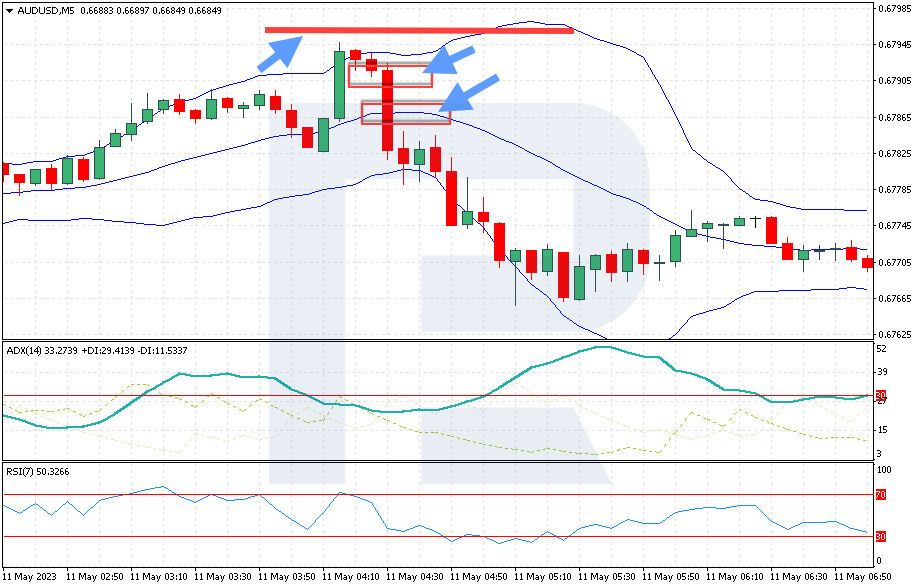
A sell position was opened at the 0.6793 level when the price dropped below the upper band of the Bollinger Bands. Take Profit was set at 0.6787 at the level of the Bollinger Bands midline, and the second option for setting it was at the 0.6790 or 0.6788 level. Stop Loss was set at 0.6796, which was 3 pips above the upper band of the Bollinger Bands.
Summary
The “Cutting Pips” scalping strategy based on signals of such indicators as the Bollinger Bands, the Average Directional Index, and the Relative Strength Index is a straightforward way for trading on the M5 chart. The main advantages of the strategy include the choice of several currency pairs for trading, simple rules for opening a trade, as well as clear conditions for setting Take Profit and Stop Loss. Its major disadvantage is that testing on historical data is difficult.


