Gold Analysis: Reversal or Continued Correction?

6 minutes for reading
Today we will look at the current situation on the gold price chart (XAU/USD). We will assess the trading prospects of this asset with the help of technical analysis, fundamental factors, and indicator signals.
You can visit the RoboForex Market Analysis webpage for the latest Gold (XAU/USD) forecasts.
Technical analysis of the gold chart
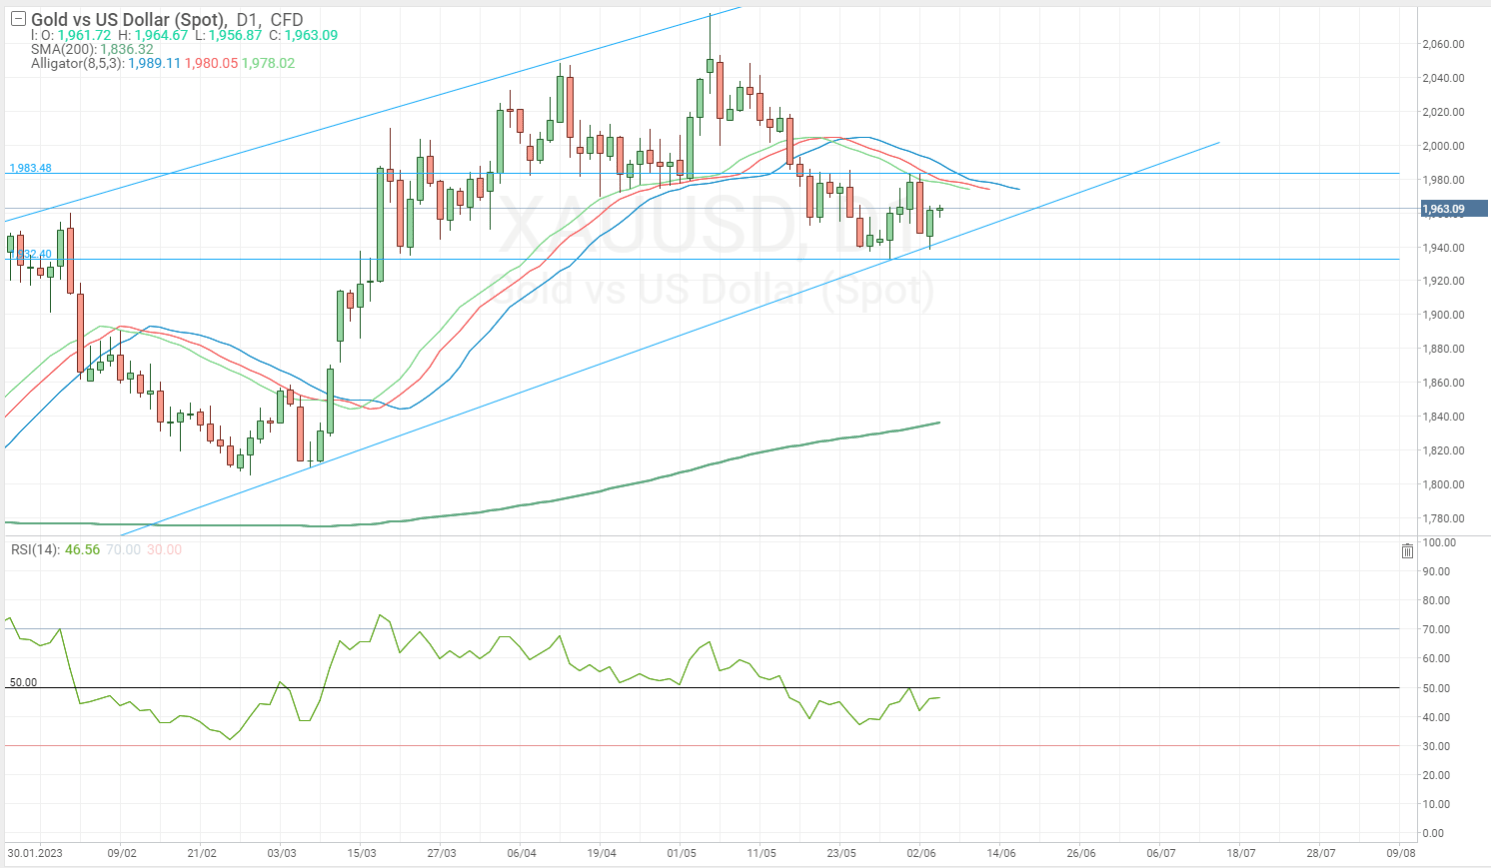
Let’s look at the daily chart to analyse the medium-term outlook for the precious metal price. At the time of writing, the XAU/USD quotes were near the 1,960 USD level.
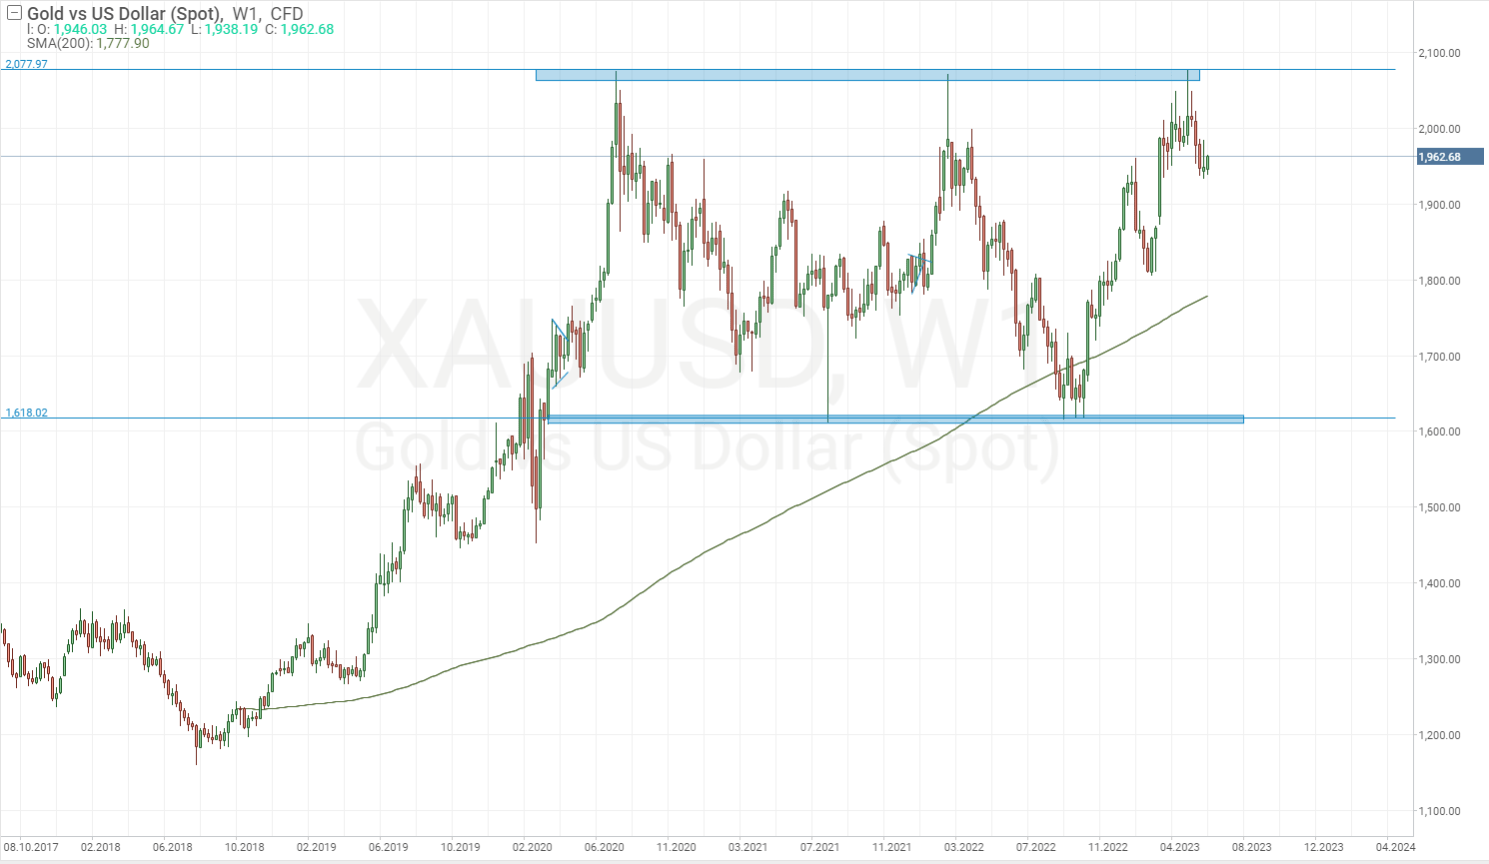
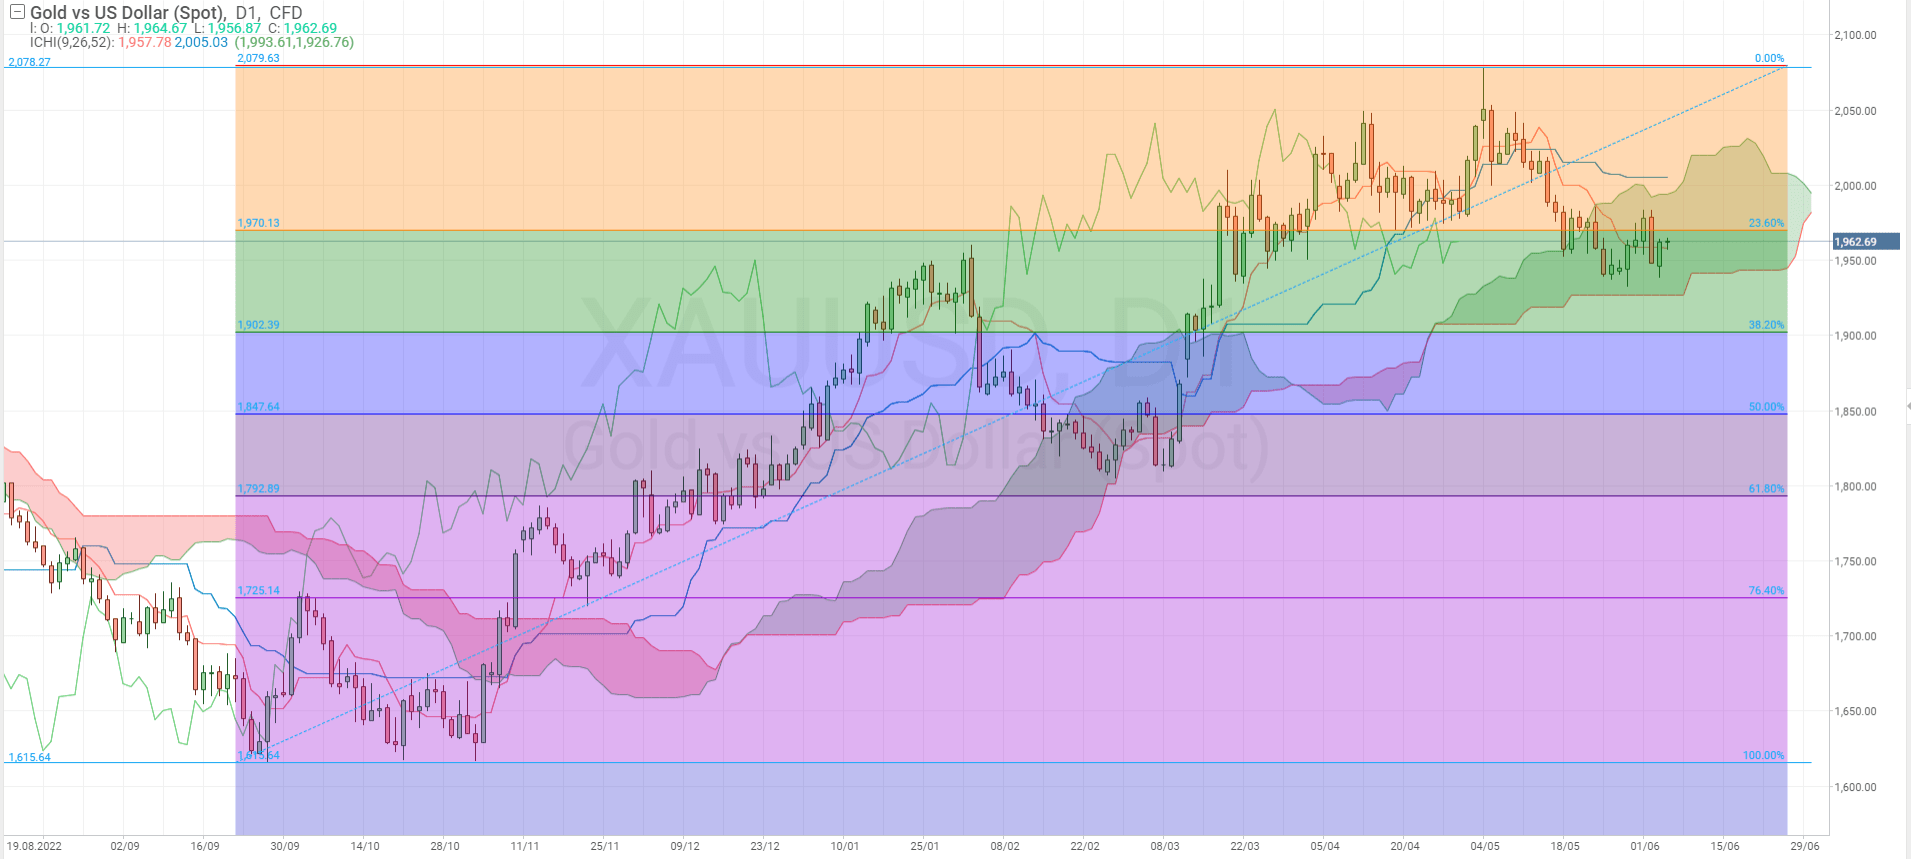
On the weekly chart, the price has been in a wide sideways range since April 2020, with the lower boundary at 1,611-1,615 USD and the upper one at 2,070-2,078 USD. In May 2023, the upper boundary was tested for the third time, which was followed by a pullback downwards. If the bulls gather their forces, reverse the asset’s price upwards, and the fourth testing of this area occurs, a breakout of the upper boundary will be more likely with further growth by the range value to approximately 2,500 USD.
The daily chart shows that the gold quotes have been in an ascending price channel since late 2022. During this time, the price has gradually increased from 1,615 USD to 2,078 USD per troy ounce. In May this year, it reached an all-time high of 2,078 USD.
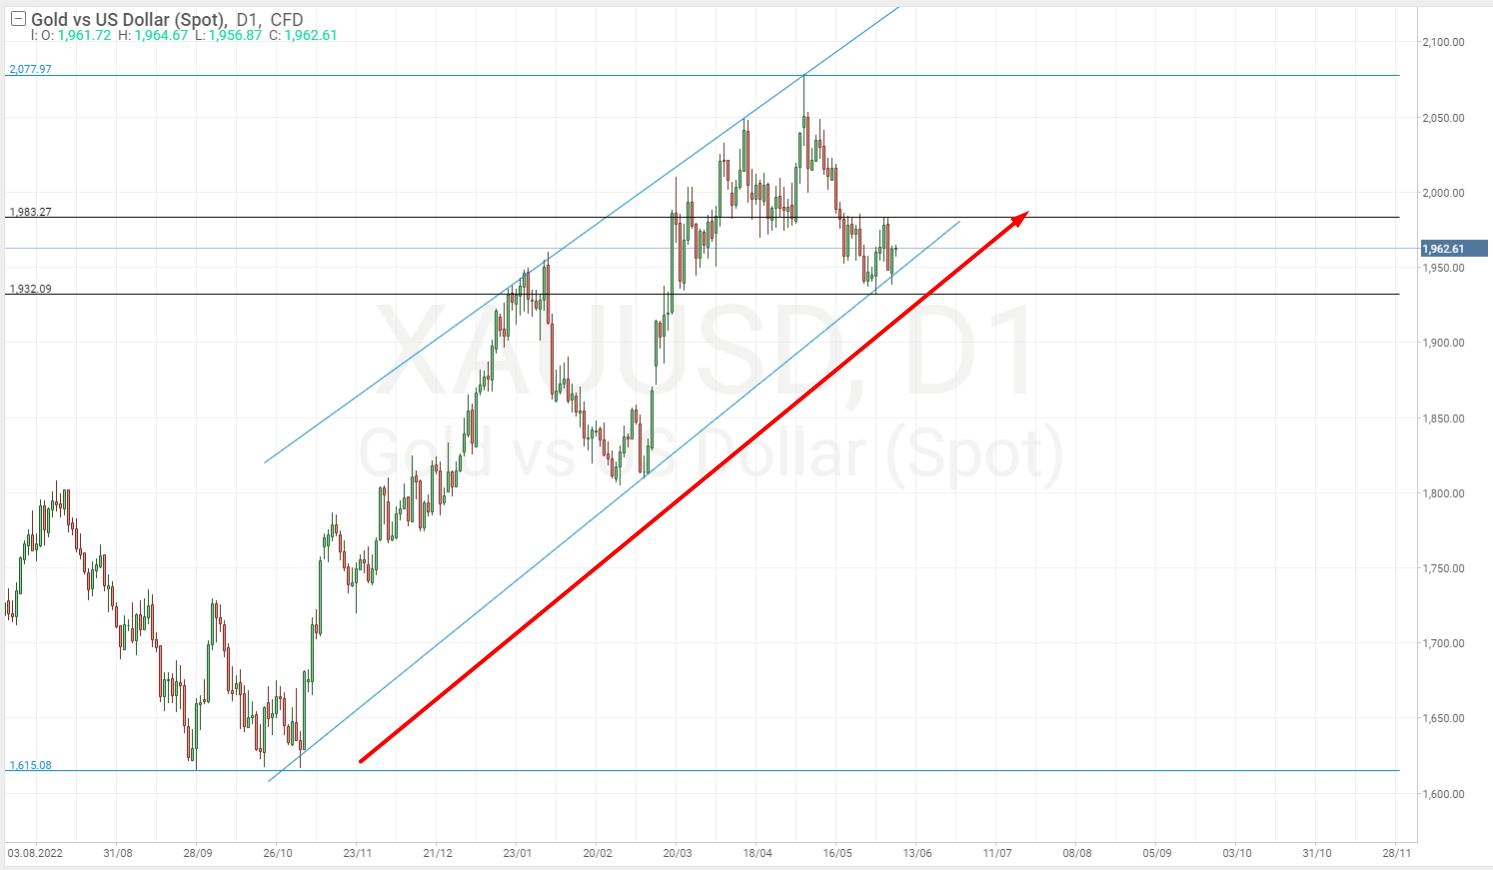
The XAU/USD then made a sharp reversal downwards, followed by a correctional downward movement, which sent the quotes down to the 1,932 USD level where there was the support of the ascending channel. This is where they rebounded upwards but did not show explosive growth. The pair reversed downwards again and tested the channel support once more.
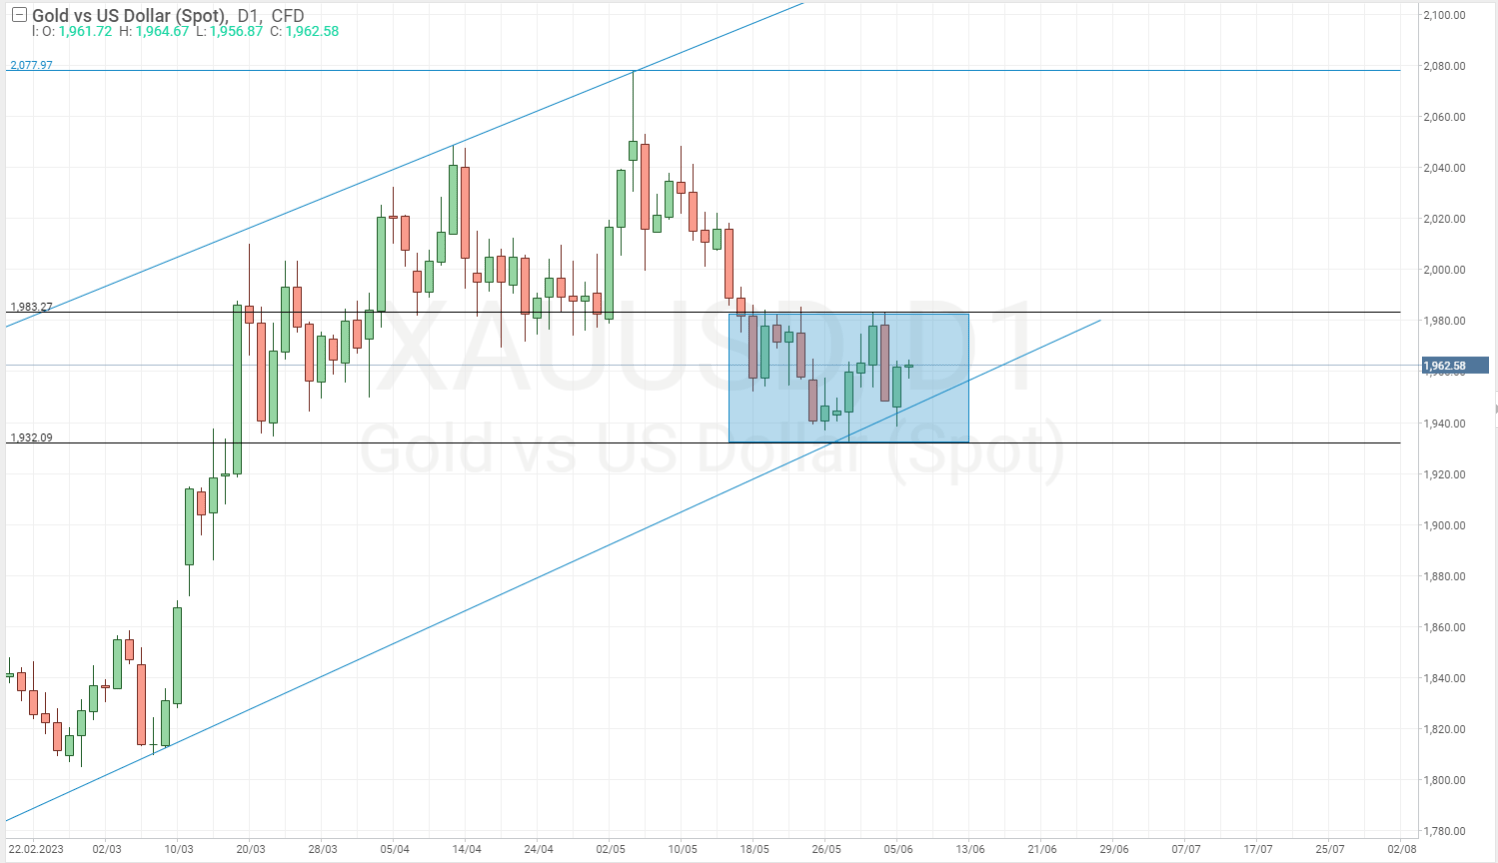
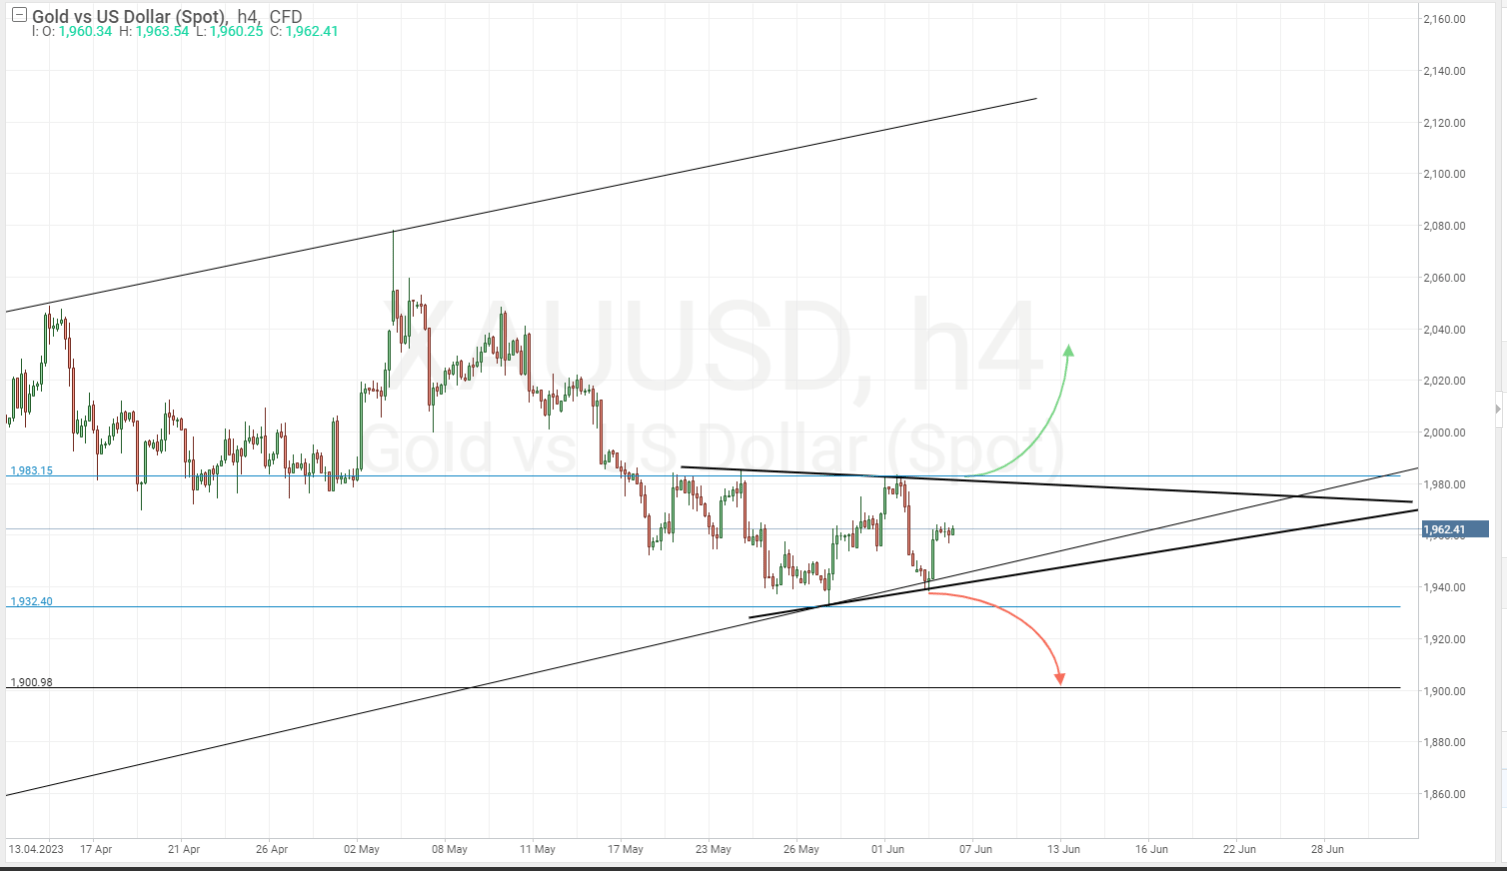
A “Triangle” pattern is now forming near the lower boundary of the price channel on the H4 timeframe. An exit from this pattern may determine in what direction the asset quotes will move in the near future. If the closing prices fall below the lower boundary of the pattern and the low of 1,932 USD, a downward correction is likely to continue, and the quotes will drop to 1,900 USD and below. If the bulls seize the initiative, and the quotes secure above the upper boundary of the pattern and the 1,983 USD level, growth is likely to continue and the highs near the 2,070-2,078 USD level will be tested again.
Evaluation of the indicator signals
- 200-day Moving Average. At the time of writing, the green line of SMA (200) is at the 1,836.3 USD level, and the asset quotes are considerably higher, near 1,960 USD. This indicates a current long-term uptrend. A wide margin between the quotes and the Moving Average, however, implies risks of developing a downward correction
- Alligator. The Williams trend indicator shows a downward movement on the daily chart. The quotes are below all three lines of the indicator, with the lines reversing and going down, which confirms a current bearish scenario. The indicator lines are now at 1,983 USD. If the price crosses them upwards, the bearish scenario will be cancelled
- RSI (14). The popular oscillator has secured below the level of 50 on the daily chart, which confirms a short-term downward scenario. If the indicator line reaches an area above 50, it will signal the cancellation of this scenario
- Ichimoku Kinko Hyo. The popular trend indicator from Goichi Hosoda confirms a downtrend. The gold quotes are now inside the cloud. The Tenkan-Sen line crossed the Kijun-Sen line downwards, giving a signal to sell. The Chinkou Span line fell below the price chart, confirming a descending impulse. An important signal now will be the direction of a price exit from the indicator’s cloud. If it goes up, a bullish scenario is probable but if it goes down, a bearish scenario will continue
- Fibonacci retracement levels. Fibonacci retracement levels based on the last growth impulse of the asset price from 1,615 USD to 2,078 USD indicate that the quotes are a bit lower than the correction level of 23.6. If a downward correction persists, the levels of 38.2 (near 1,900 USD), 50.0 (near 1,850 USD), and 61.8 (near 1,800 USD) will be potential points for a reversal upwards
Fundamental factors analysis
During economic and geopolitical downturns, the price of gold tends to rise as confidence in currencies diminishes. In such conditions, the precious metal acts as a safe haven asset.
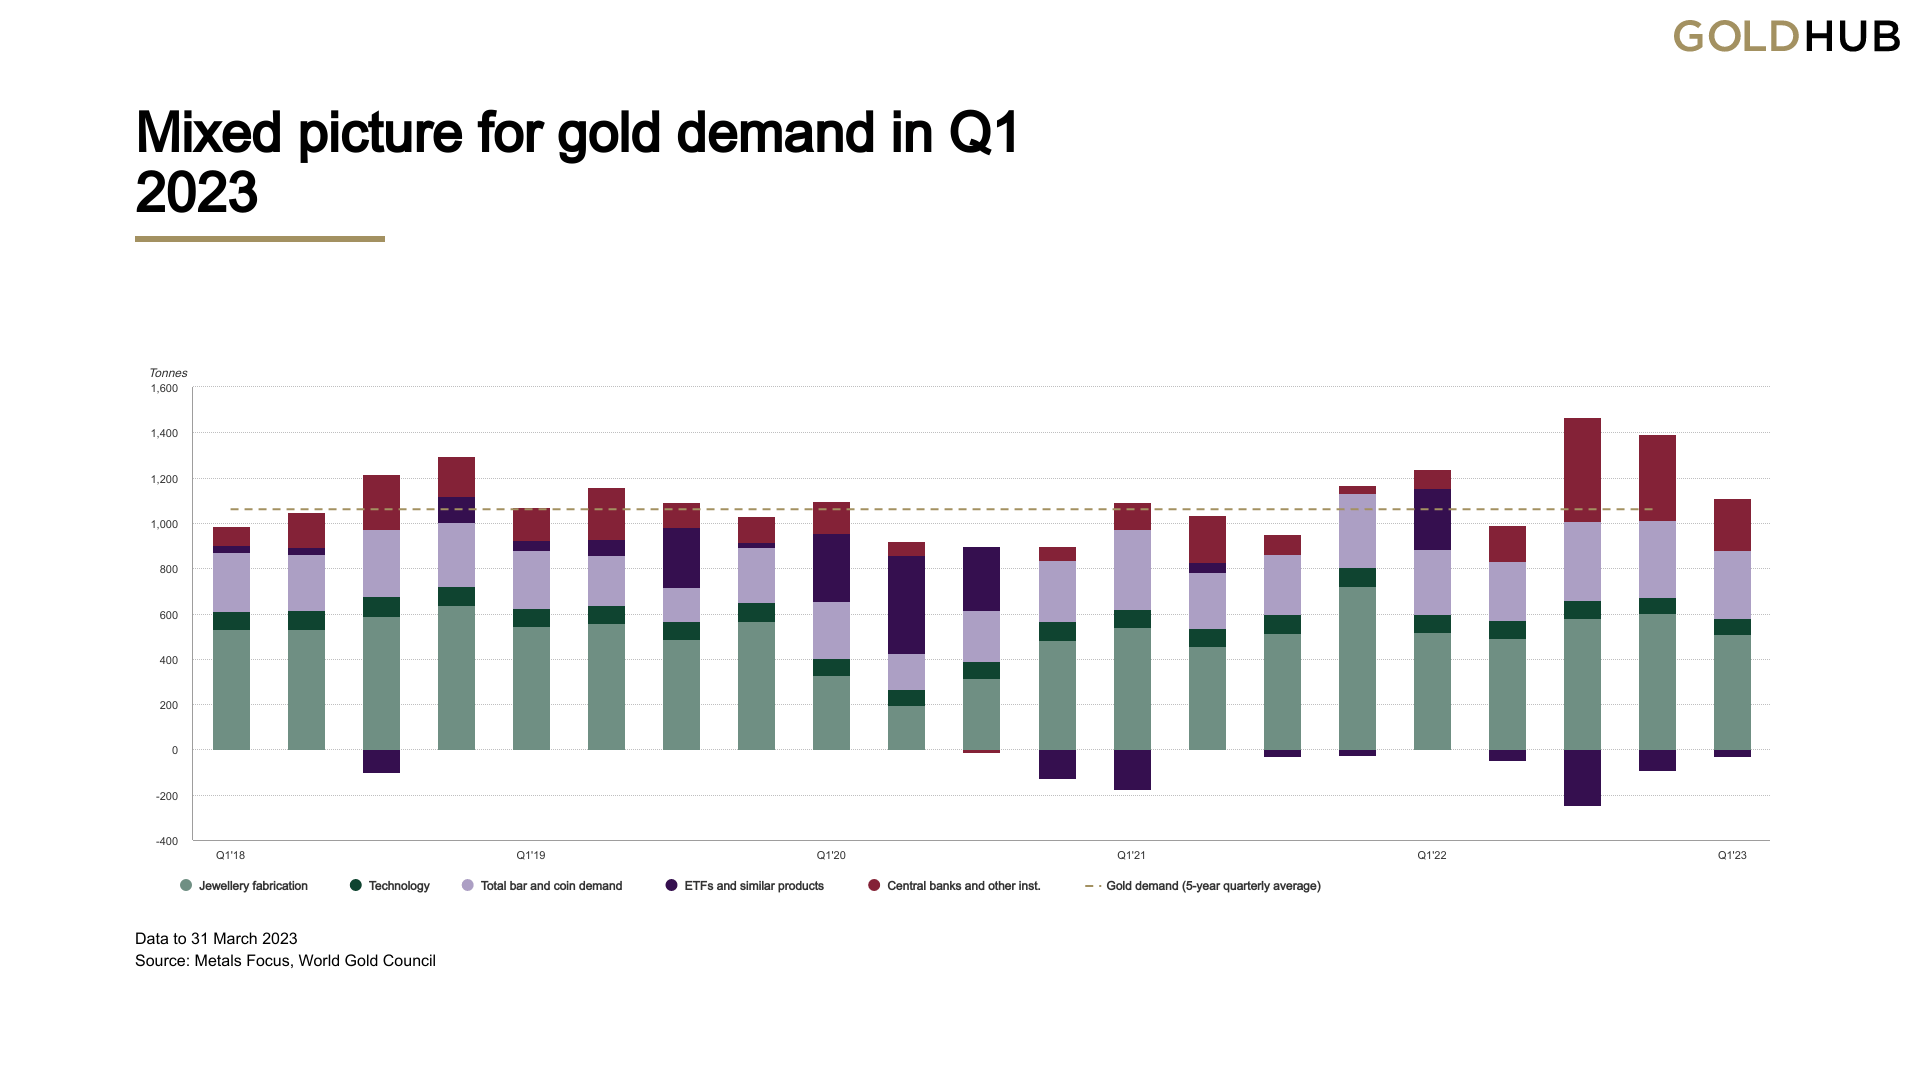
The World Gold Council, which includes the world’s largest gold mining companies, reports a growing demand for the asset in the first quarter of 2023 from central banks of various countries and consumers in China.
According to its data, 24% of central banks intend to increase their gold reserves by the end of 2023. In addition, views of central banks on the future role of the US dollar were more pessimistic than in previous surveys. At the same time, views of the future role of gold have become more optimistic, with 62% of central bank respondents saying that the share of the precious metal in total reserves would exceed last year’s indicators.
Military actions in Ukraine and the surge of global inflation contributed to the growth of the XAU/USD quotes. Since November 2022, they have been rising rapidly, reaching an all-time high of 2,078 USD in May 2023.
But at the time of writing, the asset is under short-term pressure, dropping below the psychologically important level of 2,000 USD. This is happening amid the local strengthening of the US dollar against the world’s leading currencies and growing optimism at the stock exchanges, which is attributed to the expectation of the end of the US Federal Reserve monetary policy tightening cycle. Funds are shifting from safe-haven assets to more profitable instruments, such as stocks.
Summary
Technical analysis tools and signals of selected indicators show that at the time of writing, there is a downward correction on the gold price chart, which has stopped at the support line of the daily ascending channel. The key area on the chart is the one at 1,932-1,983 USD, where the “Triangle” pattern has formed. If the quotes break this area upwards, this will signal the beginning of the next growth impulse of the asset. An exit downwards will signal the continuation of the downward correction.
As for the evaluation of fundamental factors, in the long term, the value of the precious metal will be supported by geopolitical tension, crisis developments in the global economy, and increasing demand from central banks and consumers. Short-term factors of pressure on gold quotes are the strengthening of the US dollar and rising stock markets.


