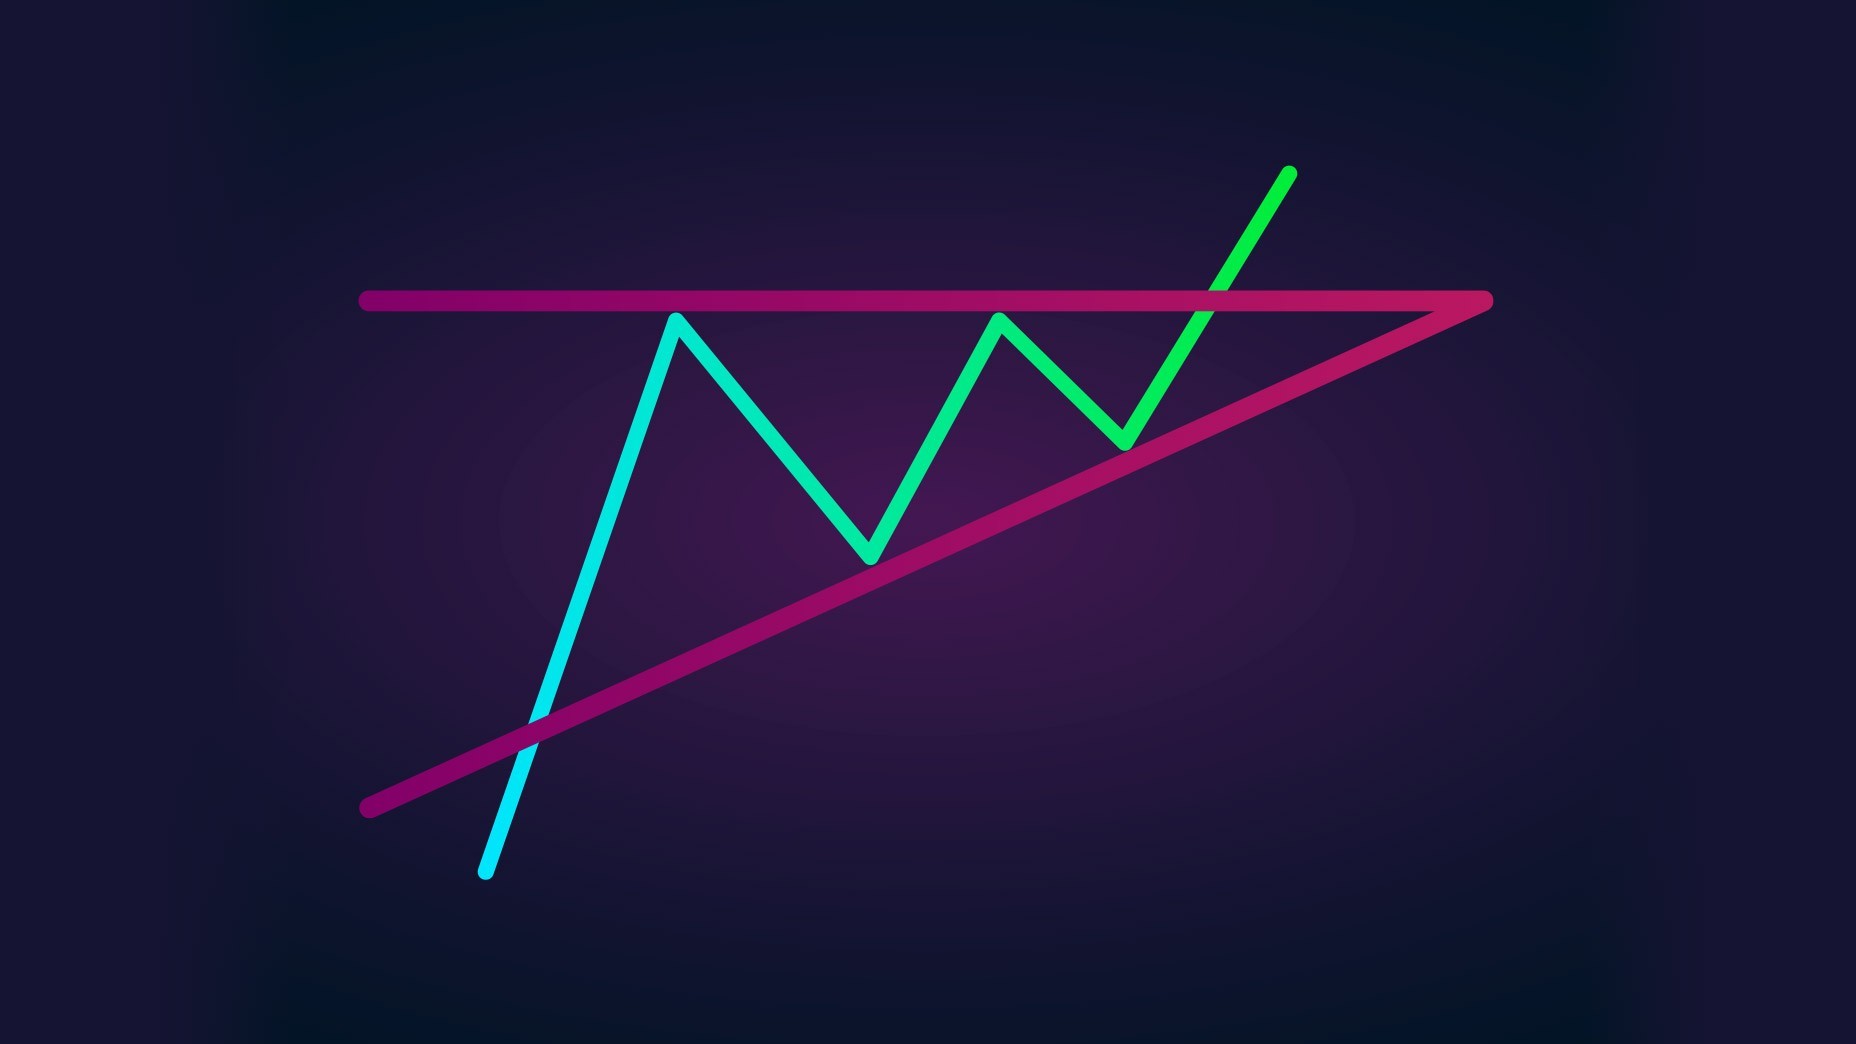
The Triangle pattern appears on different charts rather frequently. Normally, the Wedge is considered a reversal pattern, forming on maximums and minimums of a price chart in an up- or downtrend. A Wedge is quite similar to a Triangle, forming between the two converging support and resistance lines.


One of the most popular indicators (and, perhaps, the one that a trader first comes across starting their way on Forex) is the Moving Average (MA). The Moving Average belongs to the group of trend indicators and shows the average price of the chosen currency during a certain period of time.

The history of the Pivot Points indicator began in the early 30s of the twentieth century when a mathematician and a that-time famous trader Henry Chase decided to create an indicator meant for the security market. The synonym for a pivot would be a reversal, so a pivot point is a level on which the price reverses. So, the basis of the Pivot Point indicator is the idea that the market takes everything into account and repeats itself with time. The indicator was created in such a way that the opening and closing prices may serve as the support and resistance levels in the future.

The author of the Parabolic Sar is J. Welles Wilder. He first used it in 1976. In his book "New Concepts In Technical Trading Systems" Wilder presented several indicators: the Parabolic Sar, RSI, ADX.

This structure of price movement is, in fact, a Wedge pattern. According to the author of the method, a trader should have their unique features and use rare trading instruments in order to be different from the rest of the market players. The Wolfe Waves pattern is able to provide a beginner trader with the keys to a new understanding of market behavior. However, as with any other trading strategy or technical instrument, no matter how successful its trading history may be, much depends on the hands the instrument gets in.

The S&P500 index fell again upon testing its historical maximums. The last two waves of declining were used by investors as a chance to buy with the aim to take at the start of the new ascending trend. However, as soon as the price reaches its record values, the buyers disappear and those who bought earlier lock in their profit, putting pressure on the index.

To succeed in market trading you should learn to analyze and forecast price movements. The market price is influenced by a whole range of various factors, all of which we literally cannot know. A question emerges: in this case, how does forecasting become possible? This question is answered by one of the basic and most necessary types of market analysis — technical analysis.

Stochastic Oscillator chart is drawn in a separate window under the price chart and consists of two lines: %K, quick one, and %D, slow one. Its values vary from 0% to 100%; at the levels of 20% and 80% signal lines, defining the oversold (0-20%) and overbought (80-100%) areas, are drawn.

System CCI expert advisor works on the basis of well-known indicator Commodity Channel Index (CCI hereafter), included in a standard list of indicators of the MetaTrader 4 terminal. For opening a position, a signal line of the CCI and default levels of the EA are used. The levels are customizable for a more precise opening of positions.

EXTRA strategy, like any other, has long-term, mid-term and short-term goals. At the basis of this strategy lies a MATRIX. A matrix is practically the basic structure of the Elliott waves.

On August 6th Walt Disney Company (NYSE: DIS) submitted its financial report for the second quarter of 2019. According to the report, the company's income has reached record levels, amounting to 20.25 billion USD; however, it has not matched the forecast level of 21.46 billion USD, which led to a steep decline of the stock price by 5%.
In the description of the indicator in the book "Bollinger on Bollinger Bands", it is said that the price remains at the borders of the lines 95% of the time and escapes those borders in 5 remaining percent. If volatility on the market is low, the upper and the lower lines are close to one the other, while the price is trading between them; the higher the volatility, the wider the channel formed by the three lines (pic 1). According to the classification, the Bollinger Bands are a trend indicator as it shows both flats and directed price movements. The timeframe may be anything from M1 to a year.

The Relative Strength Index (RSI) is one of the few trader's instruments able to go ahead of the price. Of course, such situations do not happen every day, however, this feature is really interesting and useful for the analysis of the current market situation.

Greed Advisor is, no doubt, a pretentious name. According to the developer, this advisor is meant for especially greedy traders. However, the similarity of “greed” in the name to a “grid” is also worth mentioning, because its algorithm includes forming a grid-like series of trades.