Most often, using Martingale on Forex is reduced to merely doubling the position after a loss.

One of the most known and popular trading instruments on Forex are the Fibonacci levels (or lines). They appeared thanks to a famous Italian mathematician Leonardo from Pisa, better known by his nickname Fibonacci (son of Bonacci)

The classic Pin Bar forms on the critical support/resistance levels at the maximal/minimal values in the places where, theoretically, the trend may end. However, there are more options for the Pin Bar formation, which are the places of the trend correction.
AT&T is an American transnational telecommunication company, the largest supplier of mobile communication and the second-largest mobile services provider in the USA. 20% of its income the company receives from military contracts with the US Ministry of Defense. AT&T is the 18th largest mobile operator in the world.
A lot is a volume of an operation on the Fore market, which is defined by global standards. 1 lot always equals to 100,000 units of a base currency.
The Head and Shoulders pattern is a classical pattern of technical analysis. Let s have a look at its main elements as well as the characteristics of trading with the use of it.
Psychologists recommend formulating your goals as precisely and carefully as possible, projecting them on your subconscious and controlling your progress towards them. Systematic investors and traders have managed to secure themselves at the top of the market not just because they own some super system or insider information; the reason is, their goals are based on their long-time experience, their knowledge, technology, psychological stability and skillfull risk and money management. Trading without a clear idea of what, when and how we are planning to reach washes the main part of "plankton" off the market very quickly. The more detailed and realistic your goals are, the lower the risk of losing your deposit.

Trading against the main trend entails lots of difficulties and additional risks. As a rule, the trader in such a situation tries to catch a correction; however, it would be more efficient to wait for the completion of the current trend and enter a trade in the new trend. Even the most high-quality signal or pattern always realizes if it goes against the main trend. The trader has to be as attentive as possible and control risks if they try to enter trades against the main movement or catch the completion of the latter.

The Flag and Pennant patterns appear rather frequently on price charts. They are trend continuation patterns, working in the presence of a strong trend, same as trend reversal patterns. When such patterns appear, we may forecast that the trend will continue.
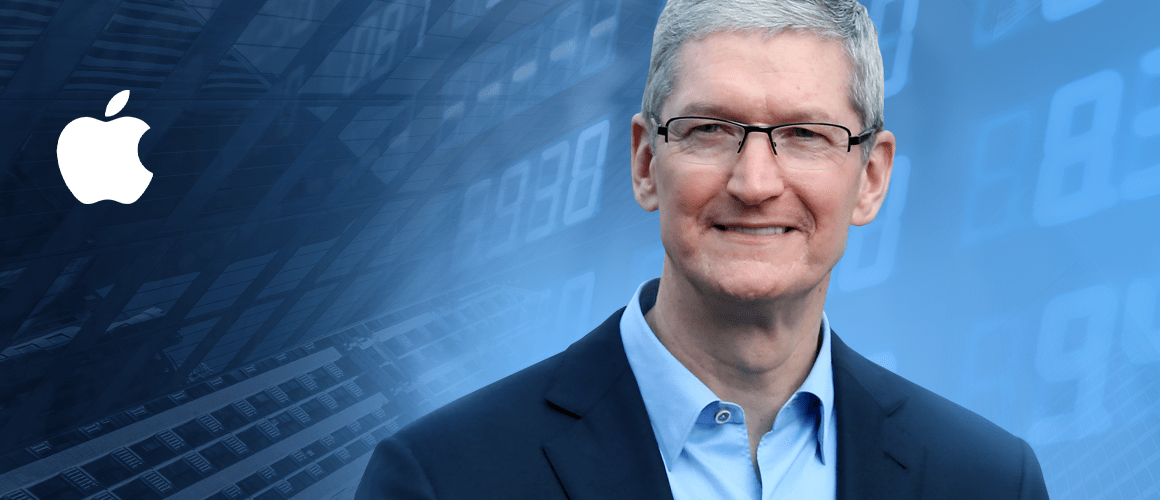
The market capitalization of Apple Inc (NASDAQ: AAPL) is 965 billion USD, net profit in 2018 was 59.43 billion USD; 132,000 employees generate annual revenue over 260 billion USD, which is higher than the GDP of some countries with a population of several million people.
A Japanese candlestick chart looks like a rectangle with two "tails" on the top and at the bottom. Same as the bars reflects four prices...

The Gap is shown in the chart above as yellow rectangles. This is a practical gap in the flow of quotations reflecting a serious difference between the opening and closing prices in trading sessions. A quick look at the chart captures a large number of such phenomena. This means that if we classify them we may find a lot of opportunities to use them in trading. But first, let us talk about the reasons which a Gap emerges for.

Cloudflare Inc. is an American company founded in 2009. Its business is web safety and web infrastructure, content delivery network services, protection from DDoS attacks and access to DNS servers and resources. Cloudflare stands between website visitors and the hosting provider of the Cloudflare user, acting as a reverse proxy server for websites. According to the data of the SolveDNS website, Cloudflare has one of the highest speeds of DNS search in the world, which allows the client to access the website as quick as possible. Cloudflare provides its services to more than 20 million websites, reducing the response time to less than 100 milliseconds for 98% of users in the developed countries. To imagine this speed, just blink. It will take you 4 times longer than the response time. For businesses, such a speed increases conversion and, hence, profit.

The SWB Grid is an expert advisor based on the RSI, Stochastic Oscillator and Bollinger Bands indicators. One of its features is the possibility of receiving signals to open a trade from all indicators, only one indicator or a combination of those.

A trend is defined as a sequence of maximums and minimums. If we say that there is a bullish trend on the market, it means that every next maximum is higher than the previous one and every next minimum is also higher than the previous one. In this case only, we may presume that the trend is ascending and try buying.