Trading Strategies That Were a Revolution: Three Strategies of Linda Raschke
7 minutes for reading
It is generally accepted that there are much fewer women in trading than men, but this does not mean at all that their influence on the trading establishment is a bit less. In this series of posts we will introduce you to the bright representatives of financial markets, whose activities have not gone unnoticed. And the first one will be Linda Raschke.
Who is Linda Raschke?
Linda Bradford Raschke is a famous and talented trader. She was born in the USA in 1959. She has been trading for over 35 years. For the start, she used to help her father when she was young. Then, she worked at the exchange. And in 1992, she founded her own company LBR Group. In 1993, she extended her horizons and started managing investor money. In 2002, she founded a hedge fund that, according to Barclays Hedge, became the 17th out of 450 active funds.
Mostly, Linda Raschke traded S&P 500 futures and successfully applied her own trading systems on the currency and commodity markets. As a rule, her positions are short-term, no more than 10-15 minutes. A position holding for up to several weeks is more of an exclusion. She used to carry out 3-4 trades a day.
In 2015, she finished her career as an active trader and took up delivering lectures and organizing workshops for analysts and market makers.
Linda Raschke is the author of several books, such as:
- "Street Smarts. High Probability Short-Term Trading Strategies" (co-authored by L.Connors)
- "Trading Sardines"
The 80-20 trading strategy
This Raschke's strategy does not require any indicator; it is short-term, intraday, based on the idea of the false breakaway of a range.
At the basis of this strategy lies the formation of a specific intraday candlestick. Particularly, a candlestick with a long body and short shadows. If the body takes up 80% or more of the candlestick, while the shadows constitute 20% or less, such a candlestick is considered to signal next day trades. Raschke noticed that, in such a case, a reversal of the market is highly probable the next day. Such a candlestick was named momentum candlestick.
After the momentum candlestick has formed, the next couple of days ee should wait for the price to escape the limits of the closing price of the momentum candlestick for 20 points, and on the return of the price to the closing level open an order with a profit of 50% of the whole length of the momentum candlestick. The return will be to at least the center of the momentum candlestick.
The system is obviously simple. It may equally be used by beginners and professionals. Let us have a look at an example: a D1 of the S&P 500. The candlestick of September 20th, 2019 looks interesting, complying with all the requirements of the system.
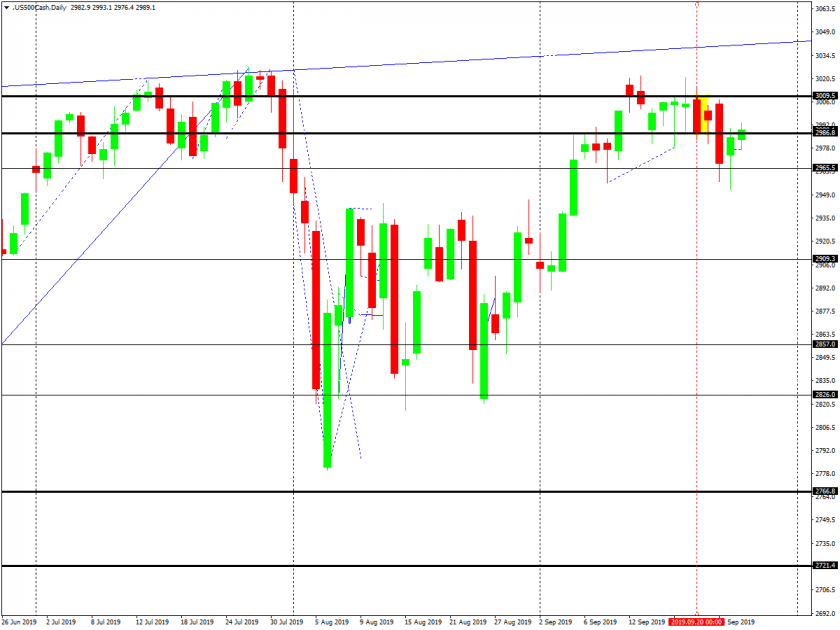
After the momentum candlestick has formed, we should move to H1. In Pic 2 you can see all the possibilities of using this system.
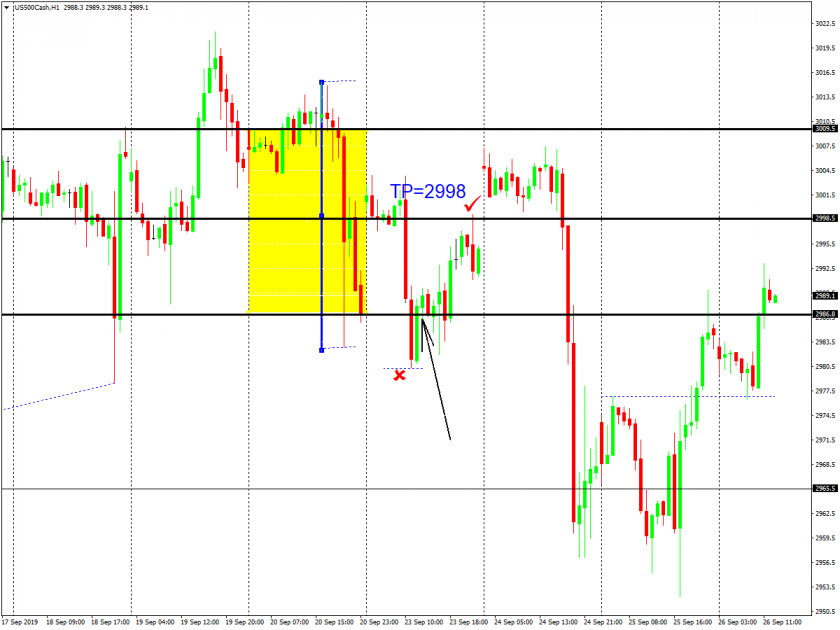
The market is breaking through the range in question top-down, declines for over 20 points and returns inside the borders of the range.
Right after the return you can start buying. The profit is right in the middle of the range. If the Take Profit is not triggered, the order is closed manually at the end of the session, at, say 23:59, a minute before the market closes. The signal in this strategy is valid for only a day. The 80-20 strategy is applicable to Forex as well.
Let us discuss another example of the USD/CAD on September 13th, 2019.
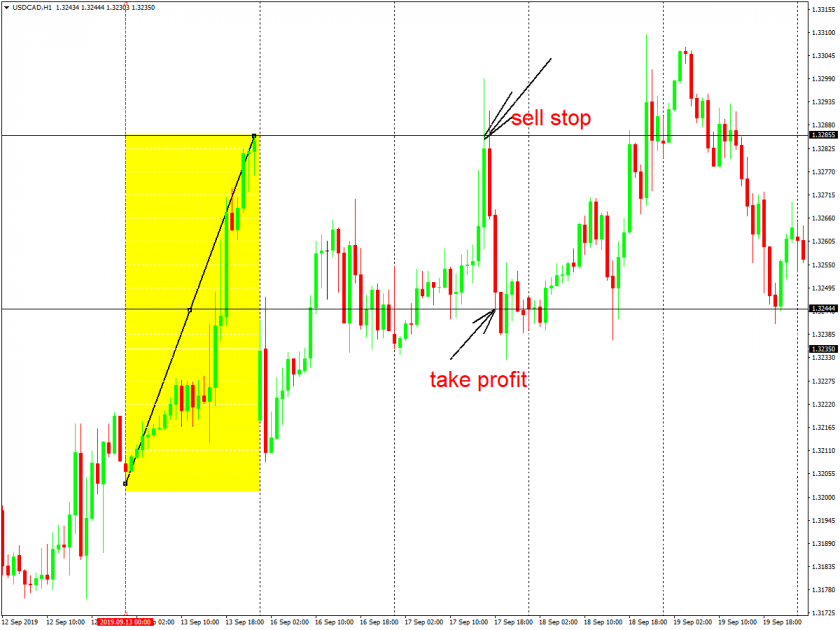
The condition is met on the second day after the appearance of the momentum candlestick. The market goes more than 20 points above the closing price of the momentum candlestick, and on the reversal, we can place a Sell Stop. You receive a profit after2-3 hours of trading. The Stop Loss must be placed above the maximum at the moment of the order being triggered.
The Turtle Soup strategy
This strategy is mid-term or long-term, requiring no indicator. The position is held for 2-3 days. The key element of the strategy is the 20-day price range.
The calculation starts any day of the market analysis. The strategy is based on the false breakaway of the range. The work starts when the minimum or the maximum of the range is broken through no earlier than 3 days after the price reached this maximum or minimum. Upon the price returning to the range, an order heading inside the range is open. In other words, when the minimum is broken through, a buy order is open if the price enters the range starting 10 points from the minimum of the initial range. In case the maximum is broken away, a sell order is open from the maximum -10 points from the maximal price of the range.
The order is followed by a trailing stop for 50-70 points.
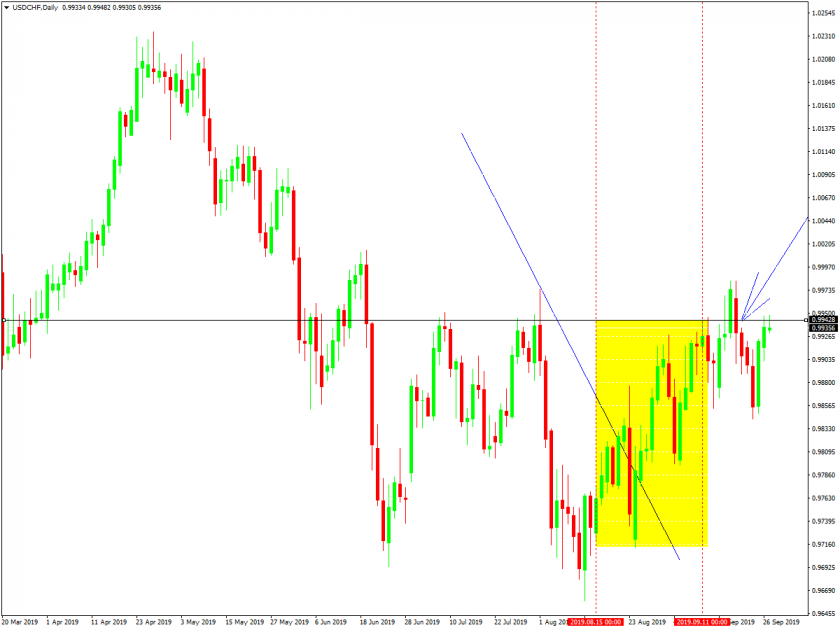
Among the last 20-day ranges, the most successful one was, perhaps, the one on the USD/CHF pair.
We move to H1 and launch the periods devider.
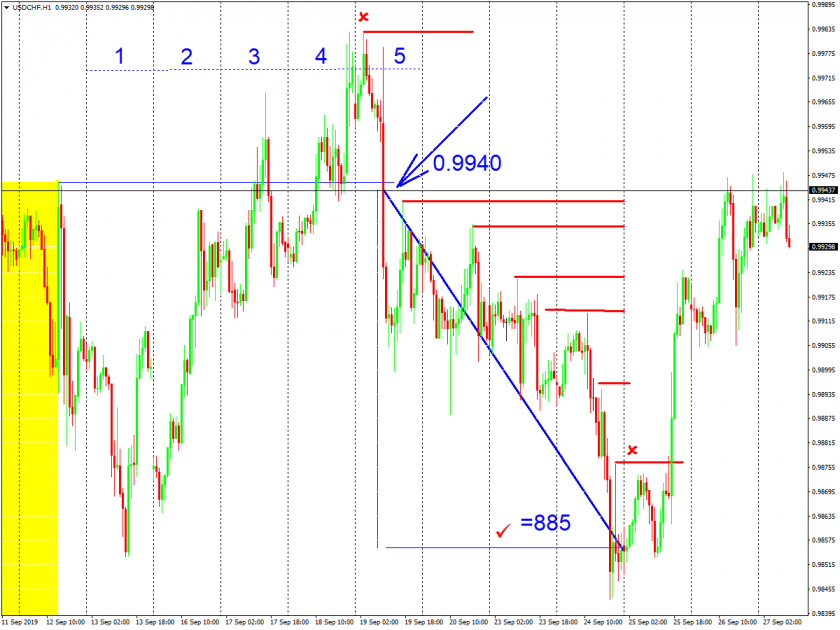
In the picture, we can clearly see the market break through the maximum of the 20-days range and return to the range 4 days later. The condition of 3+ days is fulfilled. We open a sell order from 0.9940. We put an SL above the new maximum that has formed at the moment of the trade.
We remain in the trade for 2-3 days. At the end of the third day, we can get a profit of 885 points. Or, we can visually follow the transition of the SL to the specified maximums of the correction. Or, we can choose a trailing stop for 50 points. However, in this case, the profit will be reduced.
The Anti trading system
The main idea of this one is trading the trend after the completion of a correction. The particularity of the system is the use of the Stochastic Oscillator for defining the end of the pullback and the continuation of the main trend.
The Stochastic parameters are 7.10.3. The trend direction is in accordance with the slow line of the oscillator, while the quick l8ne signals the end of the pullback. The trade is entered when both lines move in the same direction. What deserves the most attention is the hook under the slow line. The order is held strictly one day, with a TP placed at the end of the day and an SL — under the minimum/maximum of the signal candlestick.
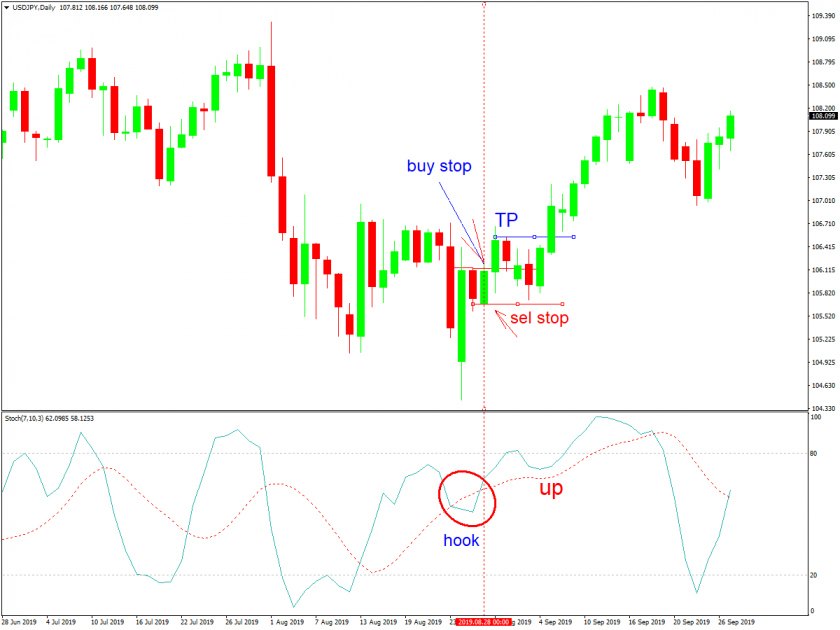
This strategy is suitable for almost any timeframe if all the rules are followed.
Summary
In this article, we have discussed the three easiest strategies by Linda Raschke's that have influenced the whole market significantly, stimulating many traders to develop new breakaway strategies for not only D1 but also session, week, month or year timeframes. These three strategies are suitable for beginners and professionals equally. It is worth mentioning that, regardless of how easy they look, these strategies require much care with SLs. Raschke's work is an example of long-time devotedness to trading. With lots of other systems available, she has invented her own unique methods and shared them generously.
In order to harvest good results, reading the rules and opening an account at once is not at all enough. What you need is strict compliance with the rules, good money- and risk management. No matter how great her strategies are, Linda Raschke has experienced serious losses, too. However, after them, she demonstrated even better results. That is why she gives us such an amazing example to follow.
