Three Indicators Trading Strategy: Detailed Description

7 minutes for reading
Today we're going to talk about the Three Indicators strategy. It's based on the use of tools such as the Accelerator Oscillator, the Awesome Oscillator, and the Parabolic SAR.
The idea is to try to catch the beginning of an impulse, and earn money on this movement. Trading is done only on the major currency pairs, and on an hourly timeframe.
We will show you how to combine signals from the three indicators, in an attempt to catch the beginning of an impulse long before it forms a reversal on the price chart. We will study the intricacies of this procedure, and detail the rules for opening and closing positions.


How to set up the three indicators
The processing of signals according to the "Three Indicators" strategy could take hours or days. It all depends on the size of the potential profit: the bigger it is, the higher the risk and the longer the waiting time.
Now let's talk about the indicators:
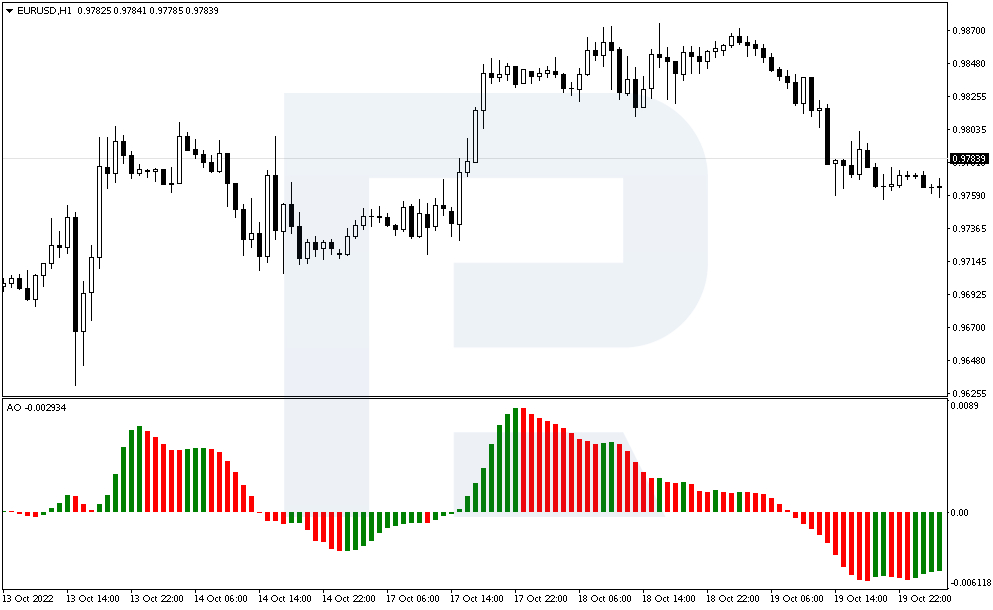
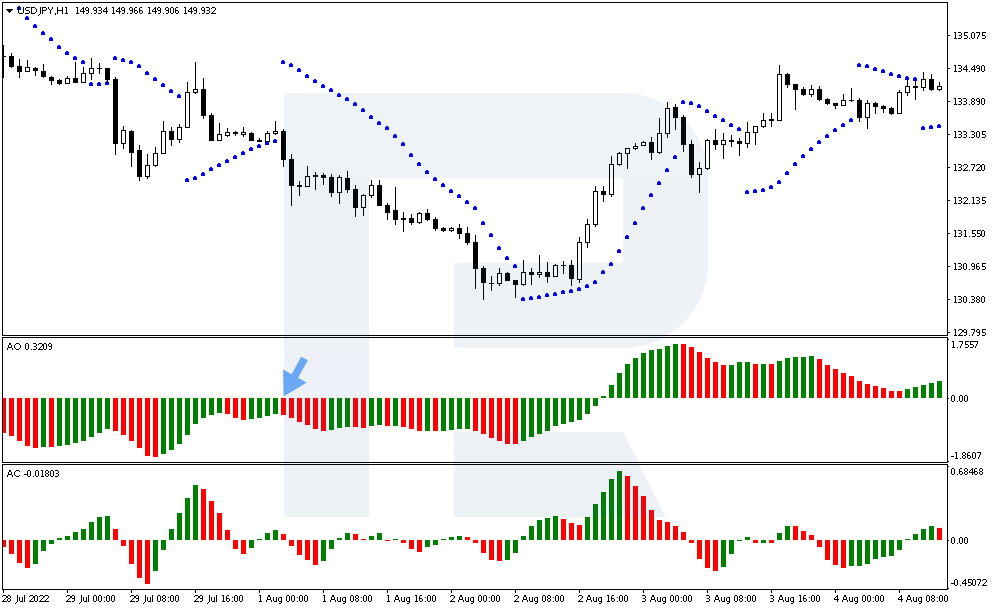
1. The Awesome Oscillator is used with standard parameters. Traders note its similarity to the MACD indicator: it shows the difference between simple moving averages with periods of 34 and 5. It is represented by a histogram that changes colour when moving averages are crossed, with green indicating an uptrend, and red a downtrend.
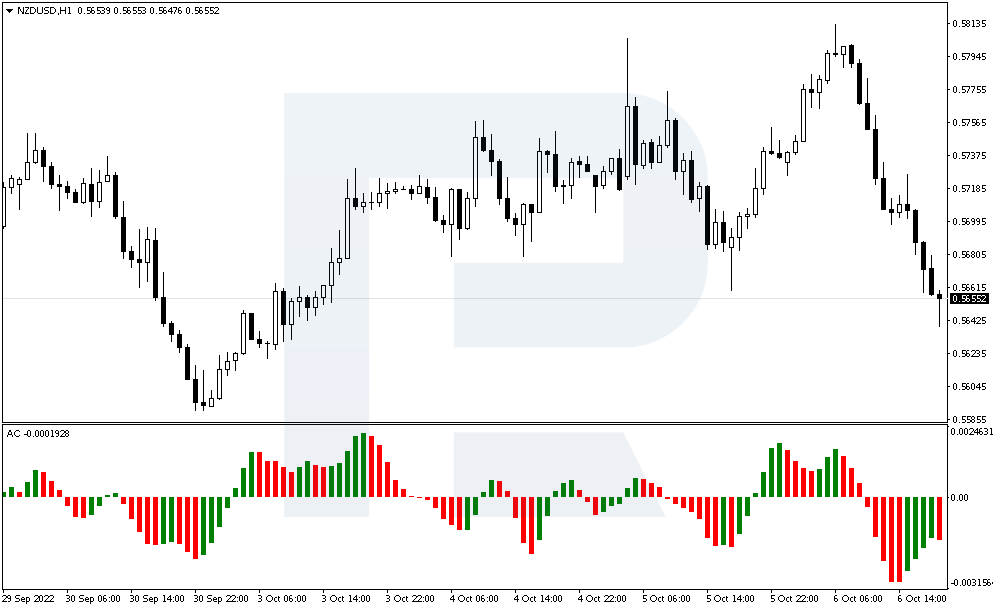
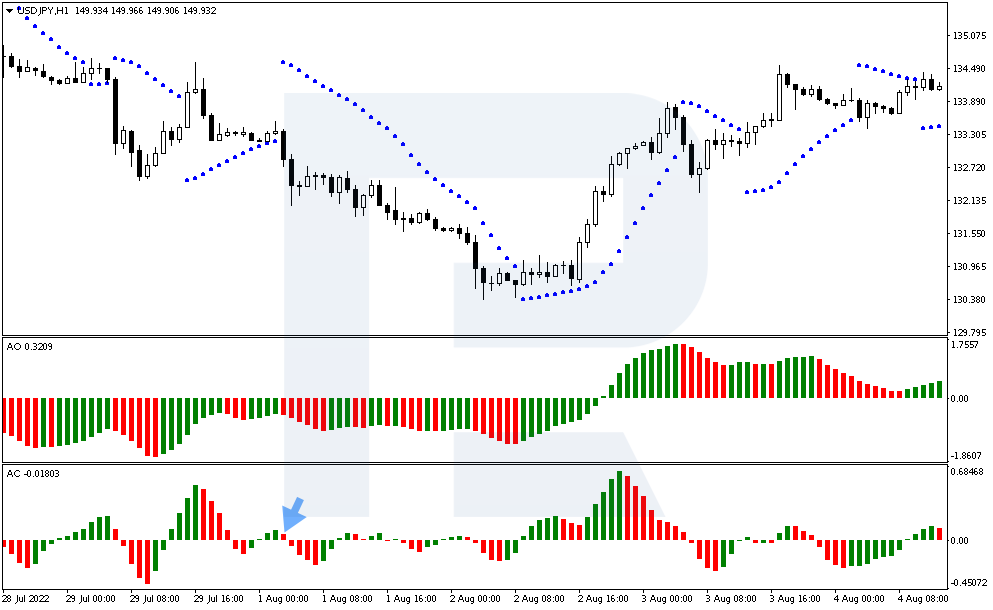
2. The Accelerator Oscillator is also added with the standard parameters. It is calculated taking into account the values of the Awesome Oscillator and displays the acceleration and deceleration of the driving force. In most cases, traders trade in the direction of the histogram: if its colour is red – you should not buy, if it is green – do not consider selling.
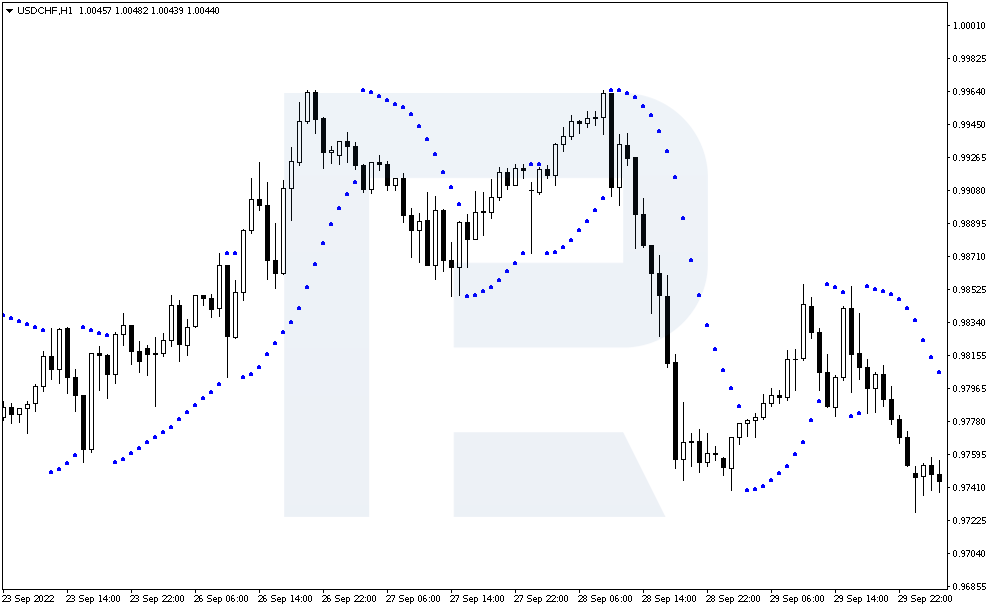
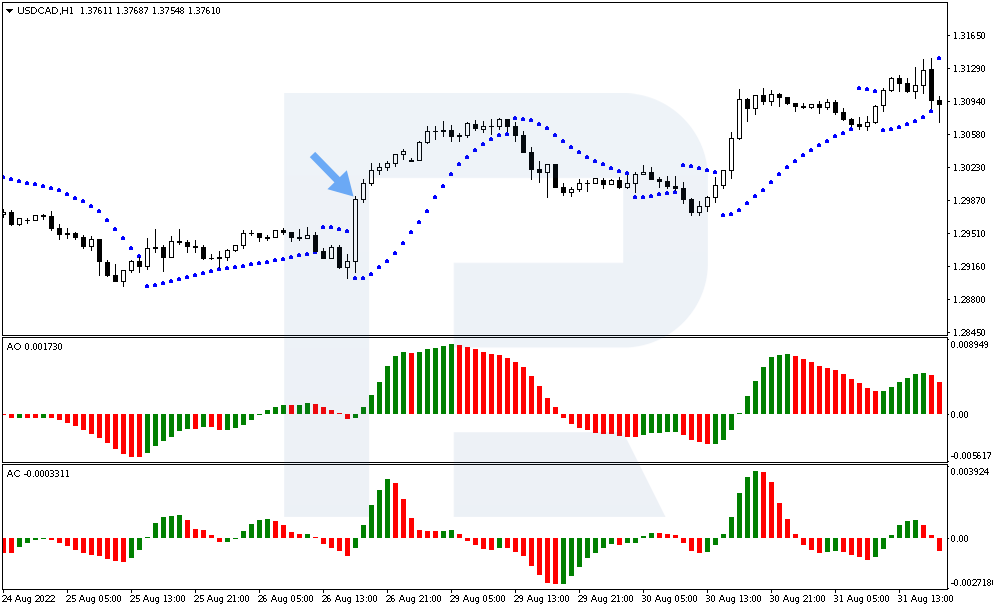
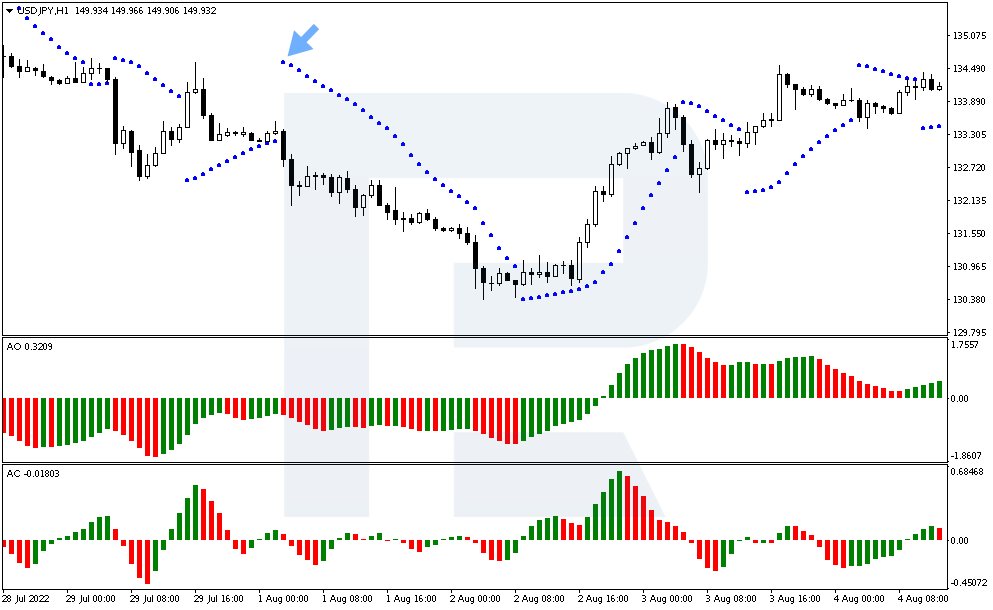
3. The Parabolic SAR represents points that are above or below the price. The trend is said to be upward as long as the dots are below the price chart. If the price breaks through the indicator and a point appears above, then the trend changes downward, which means you should sell. Often traders use the Parabolic SAR to place a floating Stop Loss: if the indicator point is broken by the price, this means the market is changing direction, and the trade should be closed.
How to buy using the Three Indicators strategy
You must get signals from all three indicators before buying. Once the conditions are met, you can enter the market. Let's look at the basic rules for opening a long position:
1. The Parabolic SAR values are below the price chart, suggesting a bullish trend.
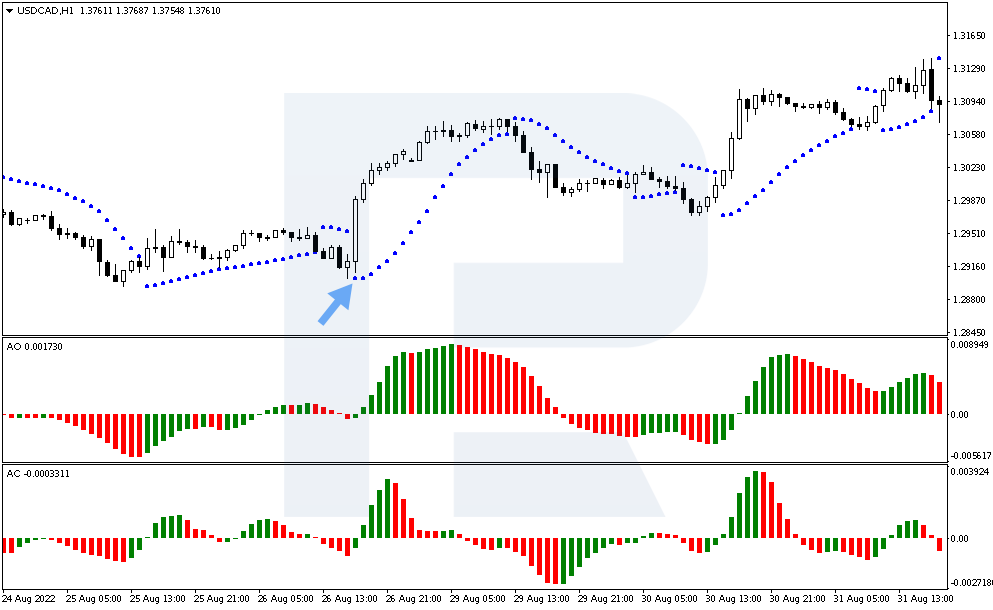
2. The Awesome Oscillator histogram bars have turned green.
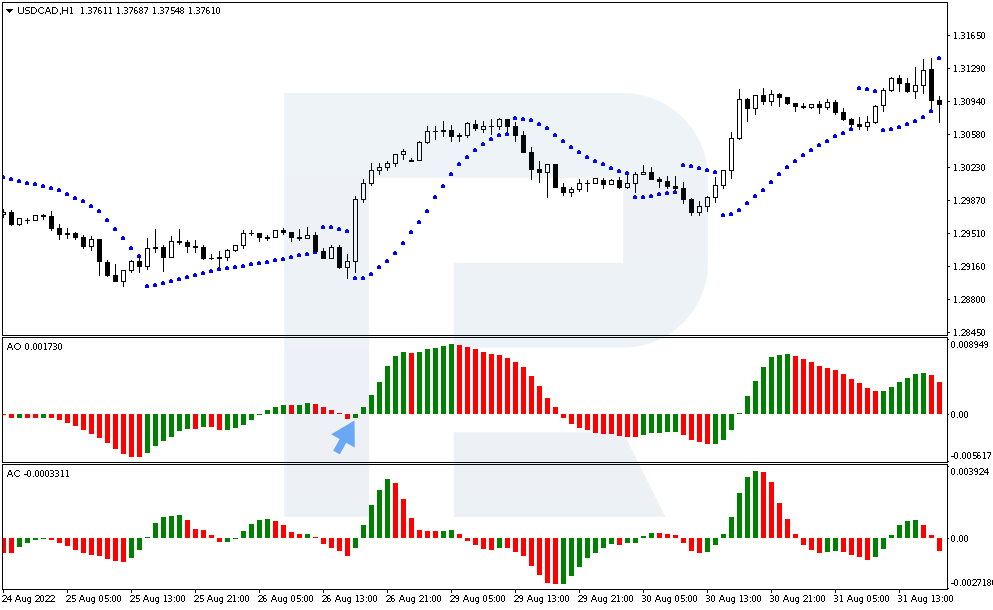
3. The bars on the Accelerator Oscillator bar graph have turned green.

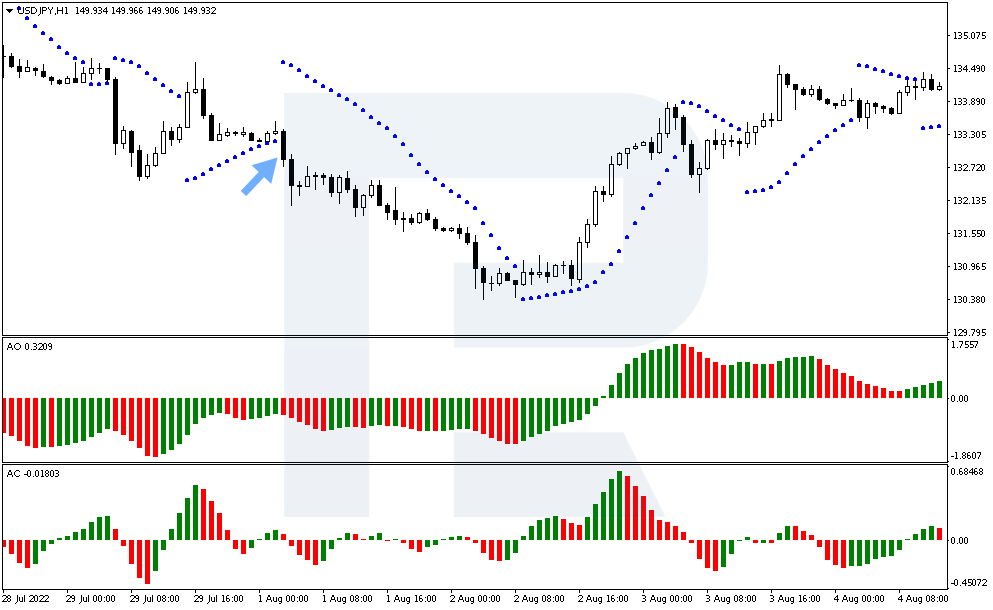
4. All these conditions must be met on one candlestick, which is called the "signal" candlestick. A trade to buy is opened on the next candlestick at its opening price.
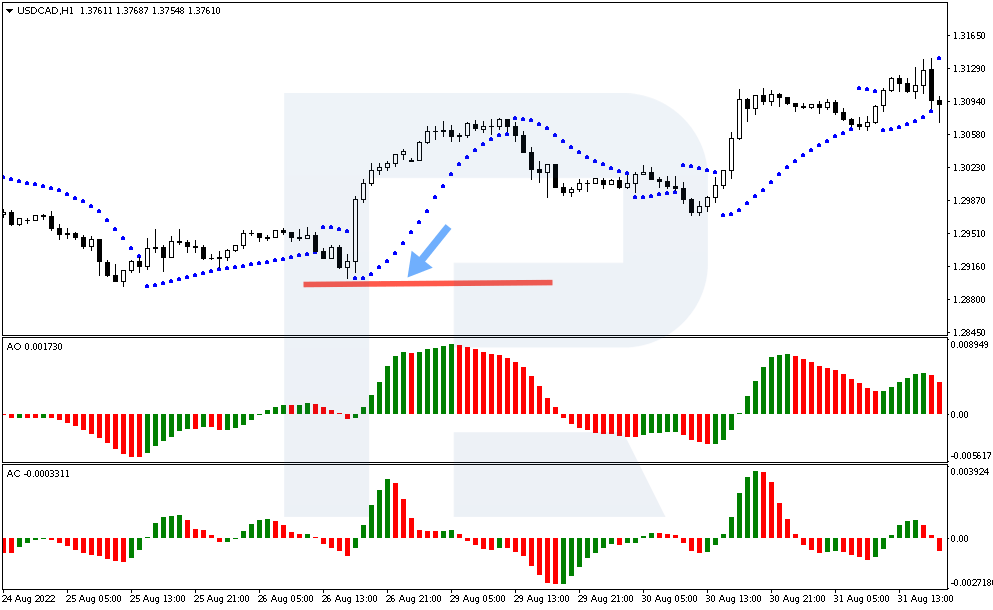
5. Stop Loss is placed below the low of the "signal" candlestick.
6. Take Profit is set equal to the size of Stop Loss. According to risk management rules, this profit/loss ratio is not quite correct. One should strive to have profits several times greater than potential losses. Therefore, the second possibility is to close the trade at the moment when the Awesome Oscillator and Accelerator Oscillator histograms change colour to red.


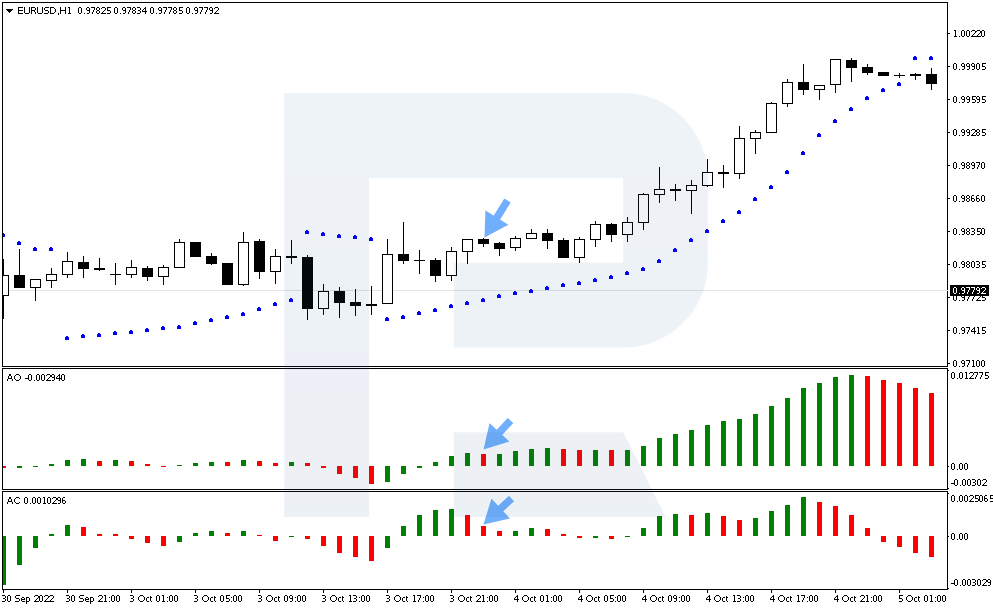
An example of buying with the Three Indicators strategy
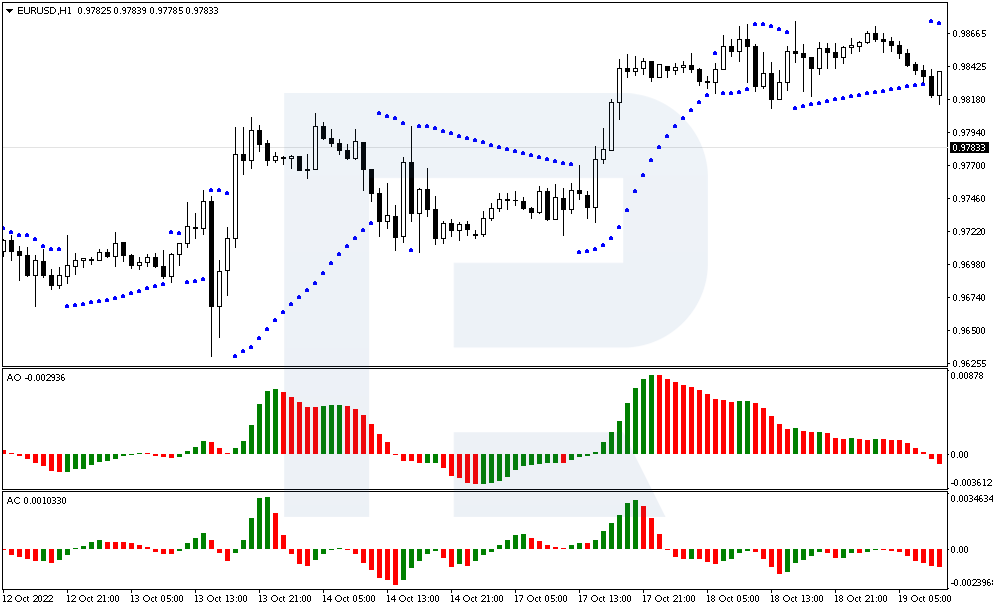
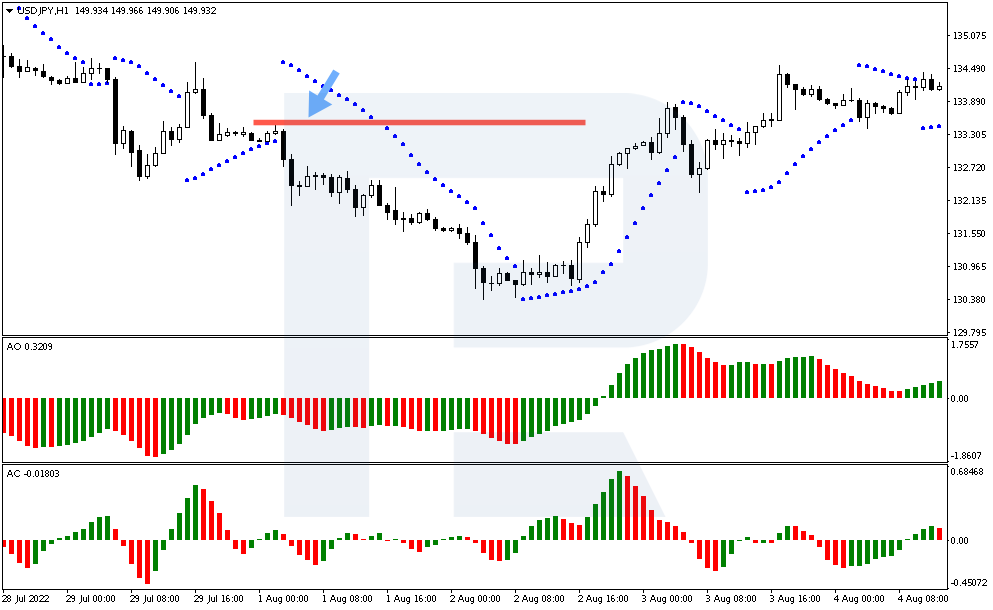
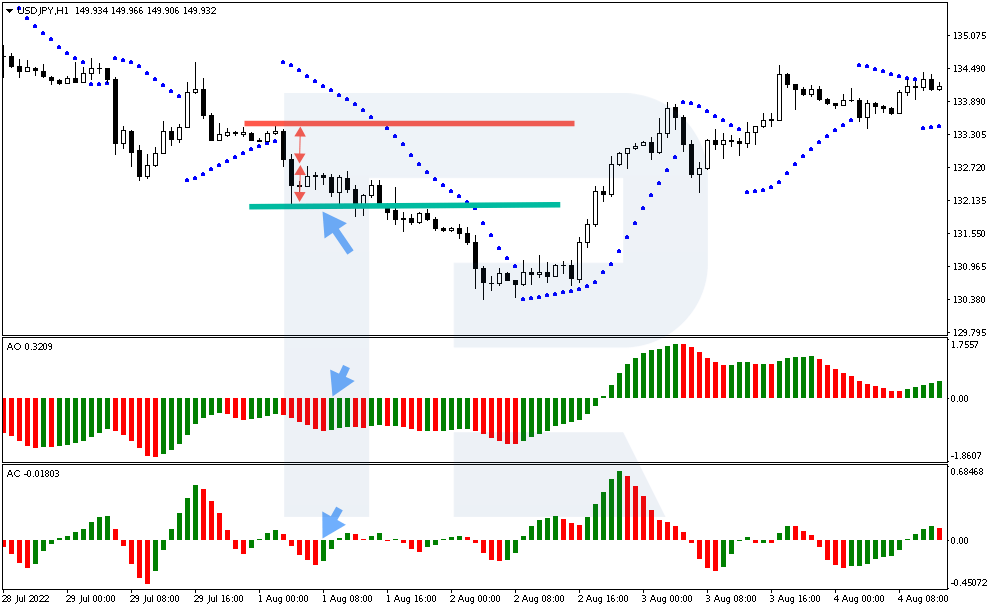
Consider the situation on the EUR/USD chart on 3 October 2022. On a large bullish candlestick, the Parabolic SAR has positioned a point below the indicator chart. The Awesome Oscillator and Accelerator Oscillator histogram bars immediately became green on two indicators, so we mark the candlestick as the "signal".
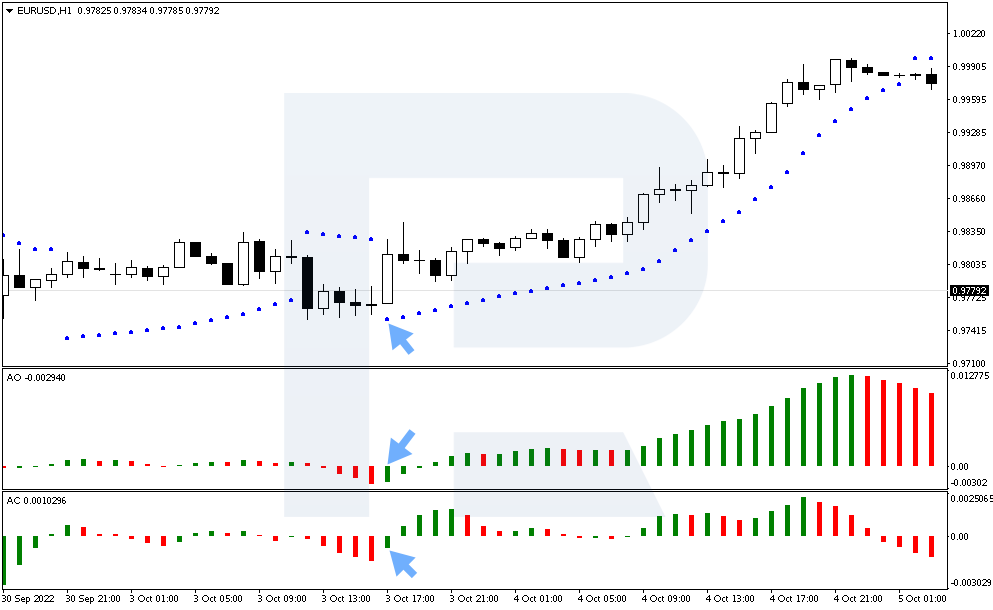
We open the trade at the opening of the next candlestick at 18:00 at 0.9813. We set the Stop Loss below the level of the "signal" candlestick at the price of 0.9756. Take Profit is equal to the Stop Loss size of 57 points, and set at 0.9870. The profit made 57 points; the price reached this target within 16 hours.
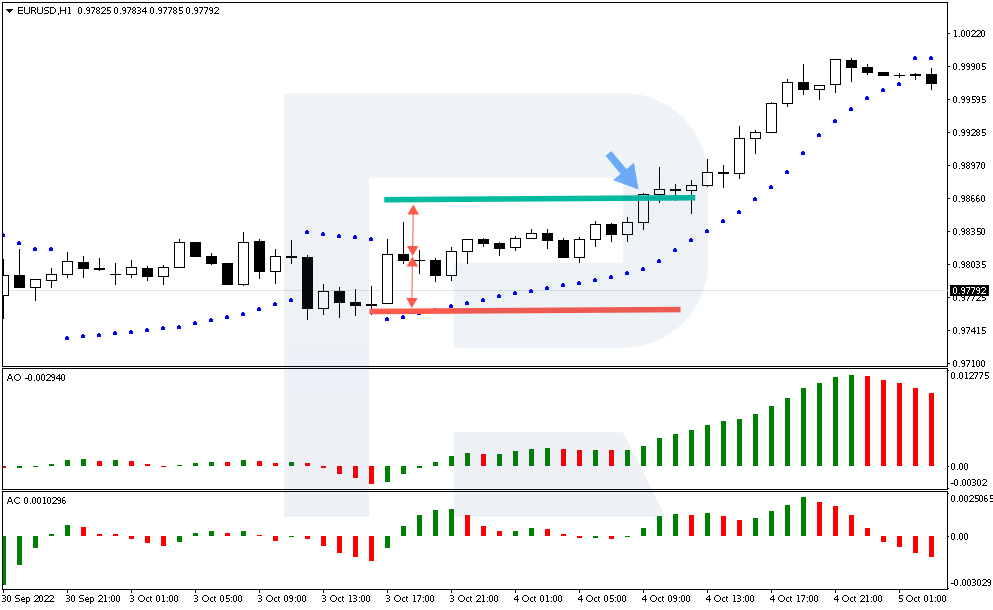
If the second variant of trade closing had been applied, when it was necessary to wait for the Awesome Oscillator and Accelerator Oscillator histogram bars to change colour from green to red, then the trade would have had to be closed at the price of 0.9819. The profit would be only six points.
How to sell using the Three Indicators strategy
Consider the rules for opening a short position:
1. The Parabolic SAR values are above the price chart, indicating a downtrend.
2. The Awesome Oscillator histogram bars have turned red.
3. The bars on the Accelerator Oscillator bar graph have turned red.
4. All these conditions must be met on a single candlestick, which is called the "signal" candlestick. Open a sell deal when a new candlestick is formed.
5. Stop Loss is set above the maximum of the "signal" candlestick.
6. Take Profit is set by the Stop Loss size. Alternatively, we wait for the Awesome Oscillator and Accelerator Oscillator to change the histogram colour to green.
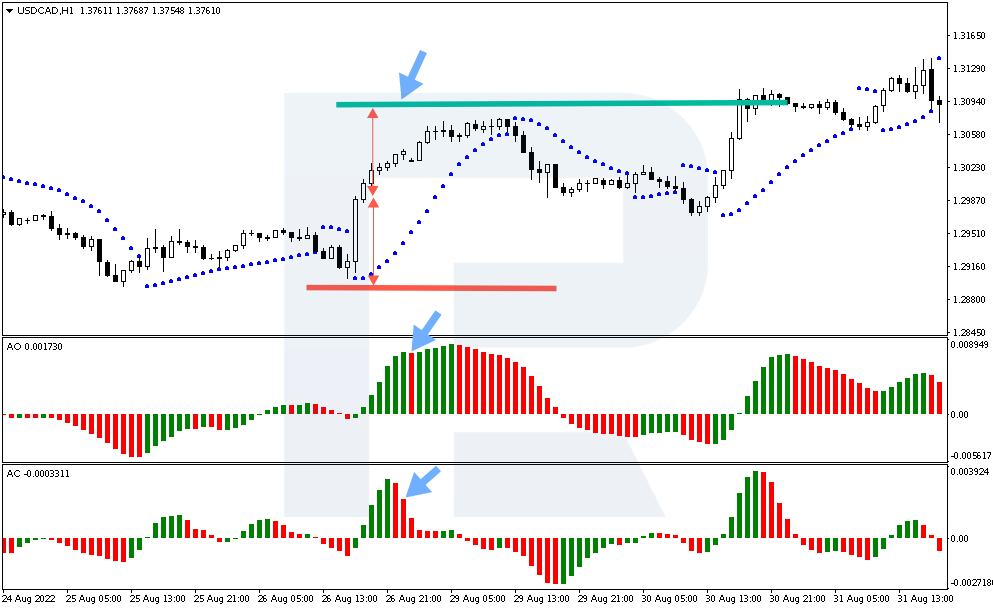
Example of a Three Indicator Strategy sale
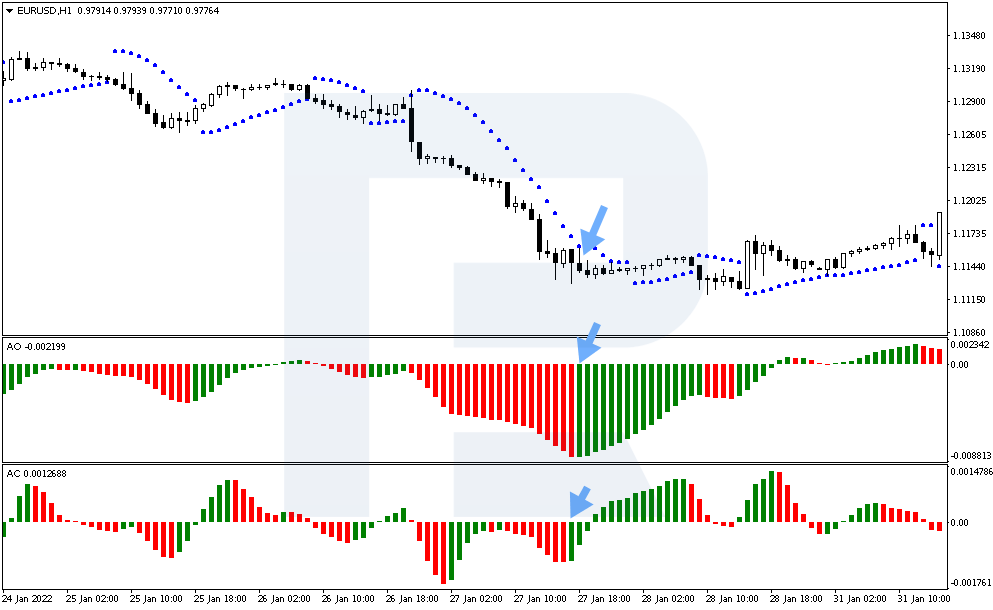
Let's look at the EUR/USD chart for 26 January 2022. The price had been declining for some time, but could not leave the limits of the sideways correction. The support level of 1.1260 is broken and a signal from the Parabolic SAR is formed: a point appears above the price chart.
On the Awesome Oscillator and Accelerator Oscillator, the bar graphs have changed colour from green to red. Mark this candlestick as the "signal" candlestick. We can open a deal when the next candlestick opens at 1.1254 at 22:00 terminal time.
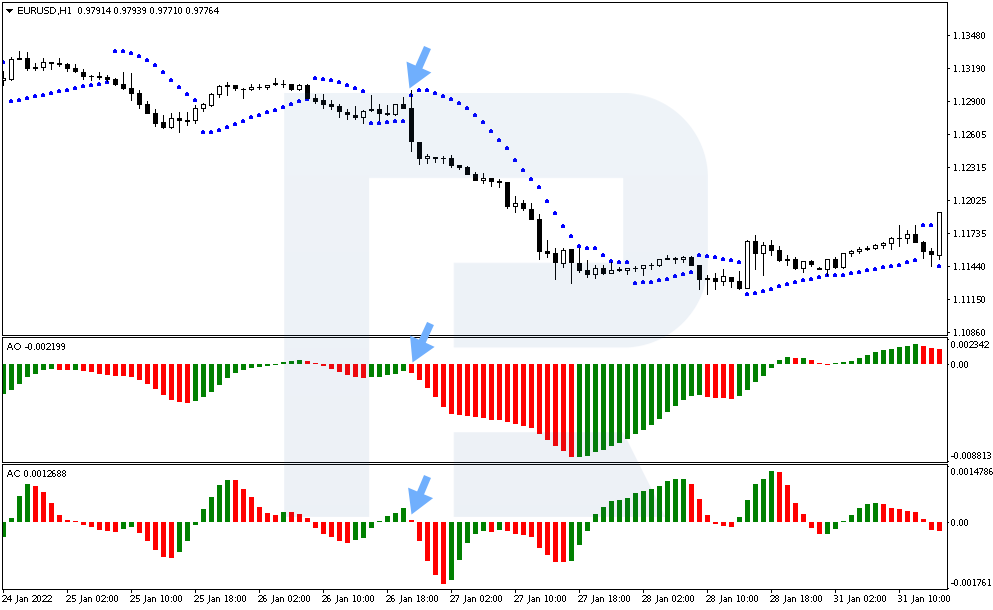
Stop Loss is set above the high of the "signal" candlestick at 1.1305. Take Profit is set equal to the size of the Stop Loss, and placed at the level of 1.1201. The profit amounts to 51 points, with the price reaching this target in 10 hours.
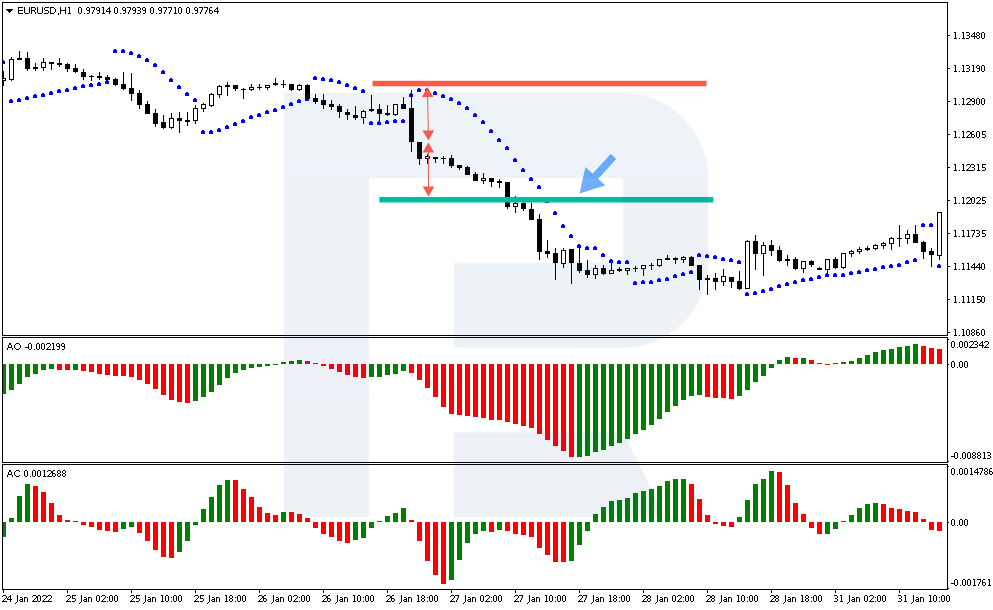
If the second option of closing the trade had been used, in which it was necessary to wait for the Awesome Oscillator and Accelerator Oscillator histograms to change colour from red to green, then the profit would have been about 105 points. The trade would have closed after 21 hours.
Conclusion
The "Three Indicators" strategy is a simple variant of trading major currency pairs on the Hourly chart. Even a novice trader can understand its basic rules: you need to evaluate the signals of the three indicators before you start opening trades.
It should be noted that the rules of the strategy are simple and clear. The only disadvantage is one of the options for setting a Stop Loss whereby the profit is equal to the loss. However, this rule could be refined, or another option for exiting a position could be used.


