Triple Candlesticks Trading Strategy

7 minutes for reading
Triple Candlesticks (Three Candles) is quite a popular Forex strategy that uses no indicators. In this review, we will get acquainted with it and find out how to apply it and to what instruments. Like any other strategy, it will take time to master, i.e. to learn to find the right patterns and filter false signals.
Triple Candlesticks are included in quite a large strategy Price Action. It became independent with time and is now used by many traders. Though originally the strategy does not need any indicators, they may be added at the trader's discretion.
Main patterns of the strategy
The general name of the strategy is Three Candles but the patterns that it consists of have various names. The main patterns would be:
- Three Crows and Three Soldiers.
- Three Black Crows and Three White Soldiers.
The names may differ but the essence remains the same.
The Three Crows strategy got its name because it is somewhat similar to crows sitting in a tree.
Three White Soldiers looks a bit like soldiers going up the stairs. Bearing in mind that traders may use different colors on the chart, we may call Three Crows a bearish pattern and Three White Soldiers - a bullish pattern. The difference between Three Crows and Three White Soldiers is the place where they form:
- The Three Crows combination forms at the top of an uptrend.
- The Three White Soldiers combination usually forms at the lows at the bottom of a downtrend.
The common feature of these two patterns is the presence of a strong resistance or support level or round price (ending in .00 or .50). This is one of the key parameters. If price patterns form far from strong levels, such a signal is likely to be false. A level may be considered strong if the price remained on them for quite long or bounced off them several times.
Thereafter, we will call the patterns Three Crows and Three White Soldiers.
Three Candles strategy rules
The strategy is multicurrency, so it may be applied to currency pairs, metals, and indices.The timeframe may also be of your choice. However, keep in mind that on M5 there might be quite a lot of signals, false signals are frequent, and the profit may be small.
On such timeframes as H4 and longer, signals will be rare, and their execution may take several trading sessions. Hence, Stop Losses will be respective.


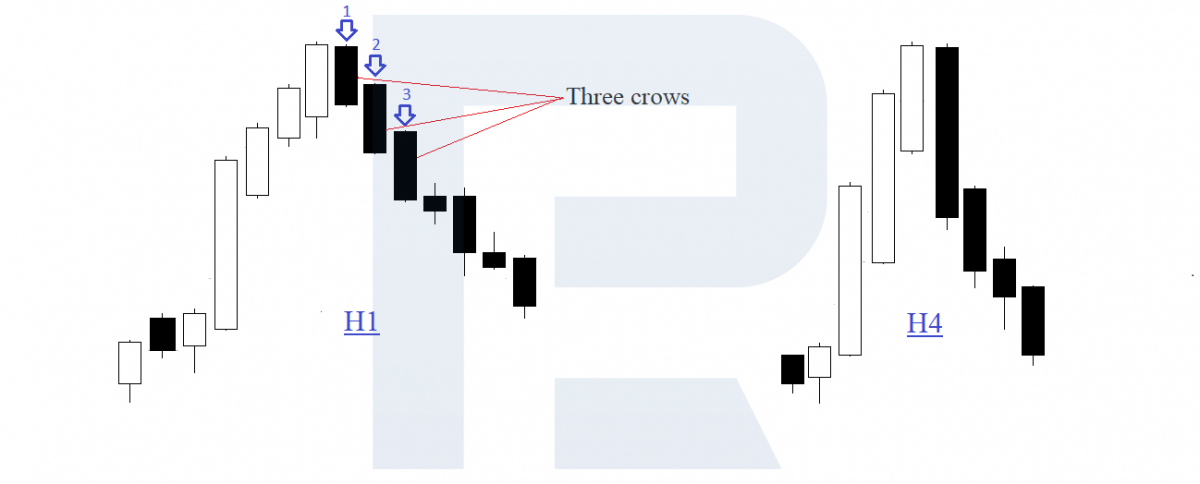
Description of the Three Crows pattern
Usually, after a lengthy ascending momentum, there appear several subsequent candlesticks of the same color (bullish candlesticks, in this case); the price stops near the resistance level.
Next, three candlesticks with long bodies form in the opposite direction (of the other color). The shadows of the candlesticks must be small with the only exception of the upper ones as they are not really important; meanwhile, the lower shadows are either very small or lacking. It will take too long to find a combination that has no shadows at all, so let us consider small shadows to be a slight inaccuracy.
The opening price of the second candlestick must be inside the body of the first candlestick; the closing price is visibly lower than that of the previous candlestick.
The third candlestick: the opening price is inside the body of the second one, the closing price is significantly lower than the previous one. Thus Three Crows are formed. It will be confirmed by the chart on a longer timeframe: there, Three Crows will look like one large candlestick.
See an example in the picture below.
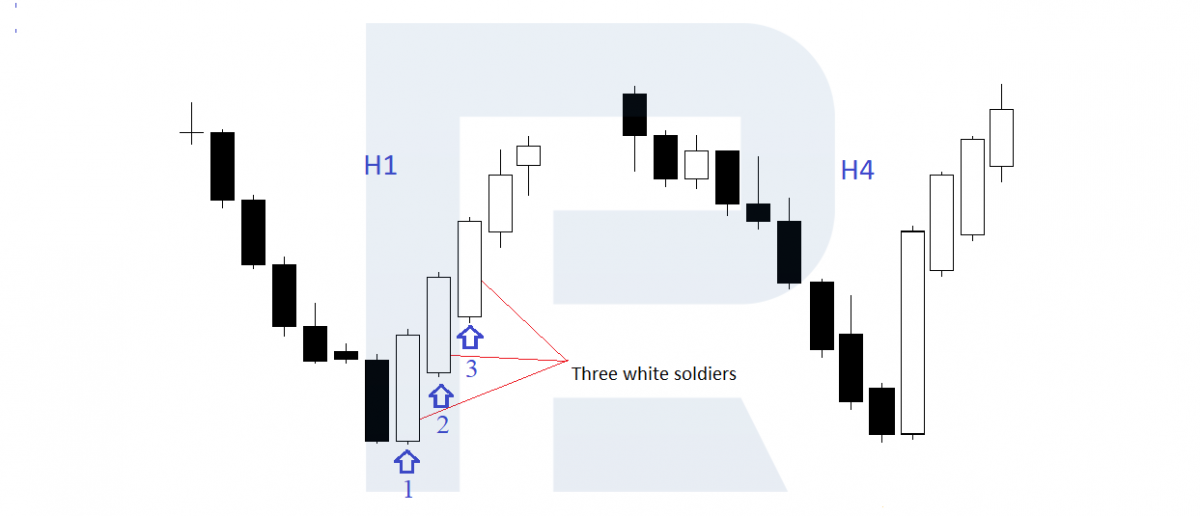
Description of the Three White Soldiers pattern
This time, the three candlesticks will form at the bottom of a downtrend and work off mirror-like to those formed at the top.
After a lengthy decline, the price stops near the support level. Then three candlesticks in the opposite direction (growing, in our case) form. They have long bodies of roughly the same size and small shadows looking up; those looking down are insignificant.
The opening price of the second candlestick is inside the body of the first candlestick; the closing price is above the previous one.
The third candlestick: the closing price is inside the body of the second candlestick; the closing price is high above the preceding one. On a larger timeframe, the three candlesticks will look like one big candlestick.
Look at the example below.
Making the signals stronger
The signal of this strategy will be considered stronger in the presence of one of the following factors.
Three Crows
- The opening price of the first candlestick coincides with the closing price of the last growing candlestick;
- The opening price of the second candlestick coincides with the closing price of the first one;
- The opening price of the third candlestick coincides with the closing price of the second one;
- There are gaps between the candlesticks.
Three White Soldiers
- The opening price of the first candlestick coincides with the closing price of the last descending candlestick;
- The opening price of the second candlestick coincides with the closing price of the first one;
- The opening price of the third candlestick coincides with the closing price of the second one.
Normally, we enter the trade after the third candlestick closes.
A landmark for a Take Profit is the nearest level on the chart. However, you may not use Take Profit at all but control the trade and close it manually.
A Stop Loss is placed behind the high for the Three Crows and the low - for the Three White Soldiers. The trade may later be transferred to breakeven and control the position.
Three Candles is a reversal trading strategy, which means that the emergence of a pattern is most likely followed by a trend reversal. Note one more thing: sometimes, after a candlestick pattern forms, the price might correct. Usually, it does not reach the Stop Loss and, completing the pullback, goes on in the direction of the signal.
Upon discussing the theory, let us proceed to practice.


Finding an entry point
We look for an entry point the following way:
- Choose the timeframe for analyzing the instrument, for example, H4.
- Screen the instruments for one of our patterns.
- If there are any conditions for the pattern to form, keep watching the instrument.
- After the third candlestick closes, open a position.
- Place an SL and TP, wait for the result.
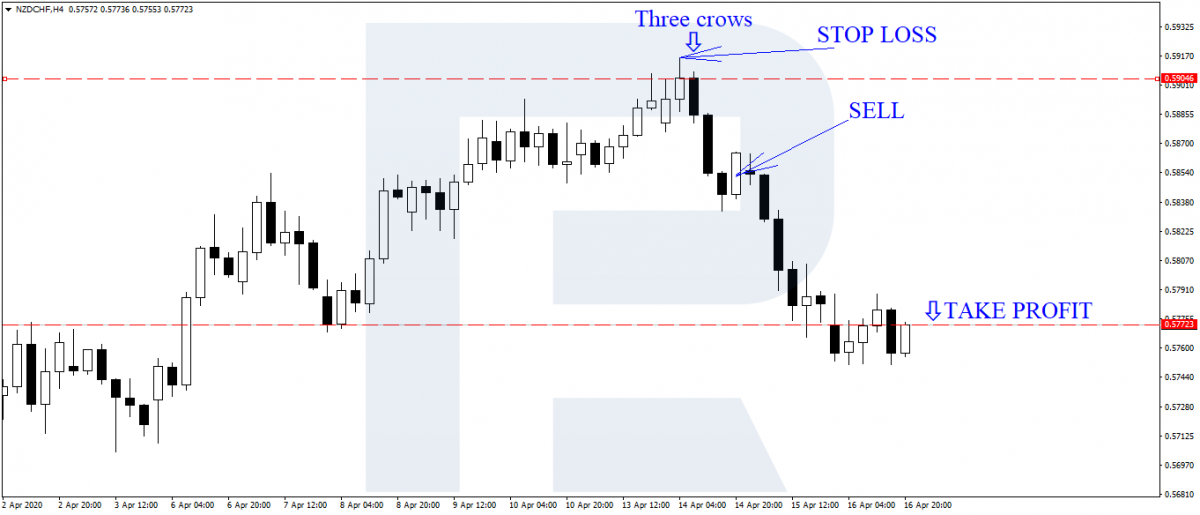
An example of a signal to sell and a trade
In this picture, the NZD/CHF on H4 tested the resistance level and formed a signal to sell by the Three Crows candlestick pattern.
I would enter the trade on the fourth candlestick. An SL is placed behind the high, and a TP - at the nearest strong support level. If you wish, you may do without a TP and, transferring the SL to the breakeven, keep the position open.
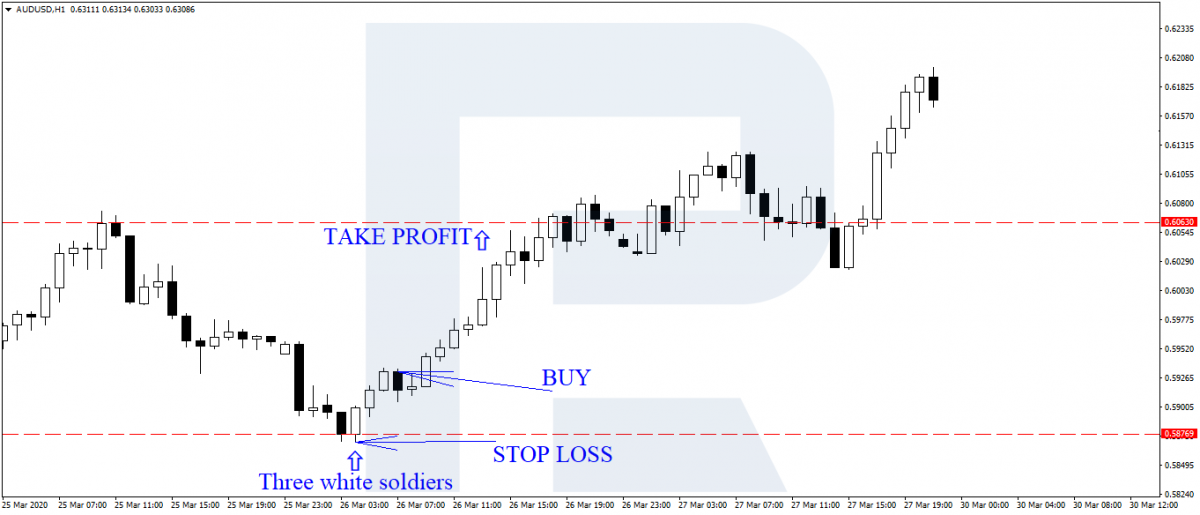
An example of a signal to buy and a trade
In this picture, AUD/USD on H1 tested the support level and then formed Three White Soldiers. As in the previous trade, you may do without a TP and, transferring the SL to the breakeven, keep the position open to increase your profit.
Summary
These patterns may be combined with other indicators and strategies. Though simple, this strategy is rather efficient. Note, however, that the signal consists of three candlesticks, so the SL might be quite large. When using this strategy, always stick to the money management rules.
Before using the strategy for real, practice finding the signals on the chart. You may also need the basics of classical candlestick analysis to understand well the idea of Japanese candlesticks.


