Indicator Strategy Parabolic SAR & Awesome: How to Use

5 minutes for reading
Today, we will speak about a trading strategy called Parabolic SAR & Awesome. It is not widespread in financial markets including Forex; nonetheless, it is quite simple and requires no special knowledge from the trader.
Strategy description
Parabolic SAR & Awesome uses several indicators with different mathematical backgrounds, which helps the trader analyze the current impulse from several points of view. Meanwhile, the strategy works best on M30 timeframe.
Parabolic SAR & Awesome was initially designed for two correlating currency pairs – EUR/USD and USD/CHF. At the moment when the trading strategy appeared, these two pairs were the most technically correct ones thanks to large trade volume, moderate volatility, and no steep fluctuations or reversals.
The indicators of the strategy
The strategy uses the following indicators:
- Parabolic SAR (0.01, 0.1);
- EMA 5:
- Awesome Oscillator.
Parabolic SAR
The first indicator is Parabolic SAR. It shows the direction of the impulse.
Its working principle is quite simple: if the points of the indicator are below the current price, the market trend is ascending. It looks like the indicator is pushing the price upwards. If the indicator points are above the price chart, the market is descending; the indicator seems to be pushing the chart downwards.
The calculation principle is as follows: Parabolic SAR compares the opening and closing prices of a certain period and identifies the most probable price direction. It also shows the places of reversals: the indicator points leap above or below the candlesticks.
In this trading strategy, we need Parabolic SAR to assess the current trend. The settings are: step – 0.01, high – 0.1/
EMA 5
The second indicator is EMA 4, or an exponential moving average with period 5.
The settings of the EMA 5 for Parabolic SAR & Awesome are:
- Apply to Close;
- No shift used.
Awesome Oscillator
The third indicator is Awesome Oscillator. It confirms the signals of the other two indicators, however, its importance must not be underestimated.
The thing is that Awesome Oscillator shows the market impulse by a histogram: if it is above zero, the trend is ascending; if below, the trend is descending. The color of the histogram bars also matters: sometimes it so happens that the bullish impulse weakens in an uptrend, which might mean an upcoming consolidation or even a reversal. In the case of the latter, the color of the bars turns from green into red (a bearish threat to an uptrend) or from red into green (a bullish threat to a downtrend), even if the bars are above or below zero, respectively.
We need the Oscillator for trend continuation signals, hence, we want the bars to keep their color when we open a position. The indicator has almost no settings, you may only change the color scheme and the width of the lines.
How to trade the Parabolic SAR & Awesome strategy
By Parabolic SAR & Awesome, you enter trades on M30, at the birth of a new trend, only when all indicators of the strategy give due signals:
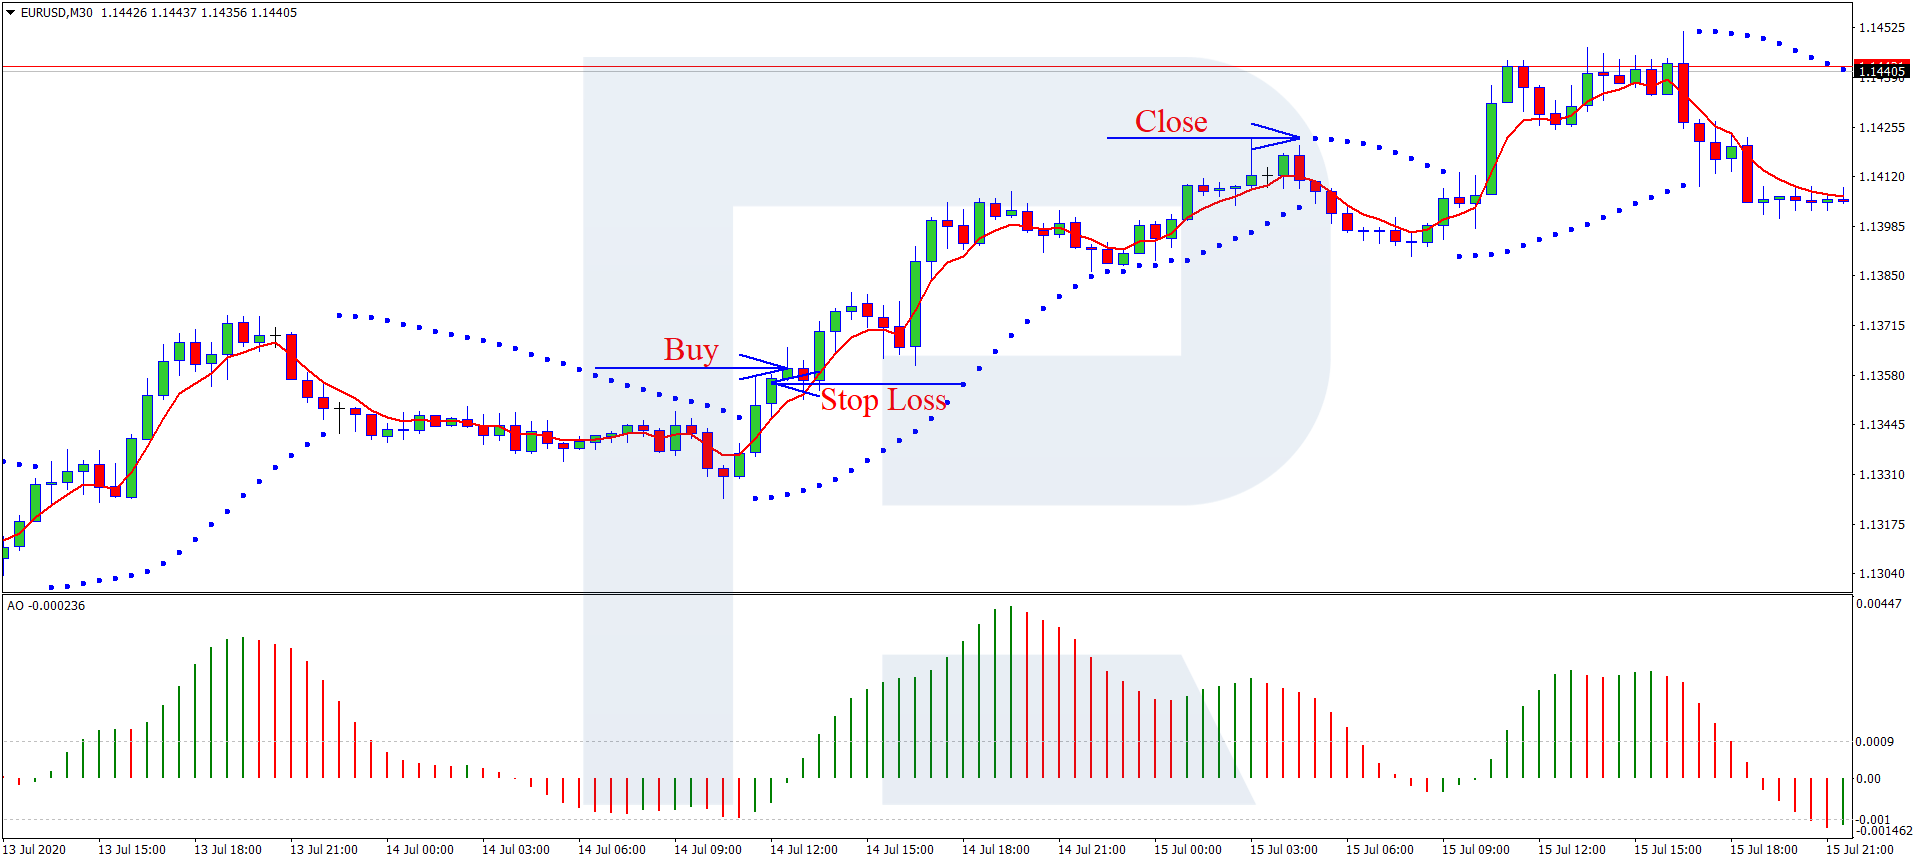
Opening a buying position by Parabolic SAR & Awesome
Awesome Oscillator becomes positive, its histograms turn green. Ideally, wait for two fully formed bars to appear; the color here is crucial. If the indicator shows green and red bars in turns, better not enter the market.
Parabolic SAR is below the chart. If the points of the indicator appear above and below the chart in turns, better skip the trade. Normally, in a correct entry point, the chart will look like a growing one.
The EMA 5 will be moving inside the candlesticks; however, for a good entry point, we need the price to go away from the Moving Average. Ideally, the candlestick must close above the EMA 5 and the next one must open staying away from the MA. If these two conditions are fulfilled, open a buying position.
According to various sources, the Stop Loss is placed 20 (200 in a 5-digit terminal) points below the opening price, and the Take Profit is 15 (150 in a 5-digit terminal) points above the opening price.
To my mind, this is not quite correct: the SL is larger than the TP, so even 50% of profitable trades will lead to the loss of the deposit. On the other hand, this increases the chances of closing the trade by the TP.
It seems more efficient to place a fixed SL 20 (200 in a 5-digit terminal) points below the opening price, and instead of the TP, monitor the open position and close it manually. To close the position with a profit, look at Parabolic SAR (it must go under the chart) or Awesome Oscillator (the histogram has become negative). This time I will not give you any musts because every trader has their ideas about the thing.
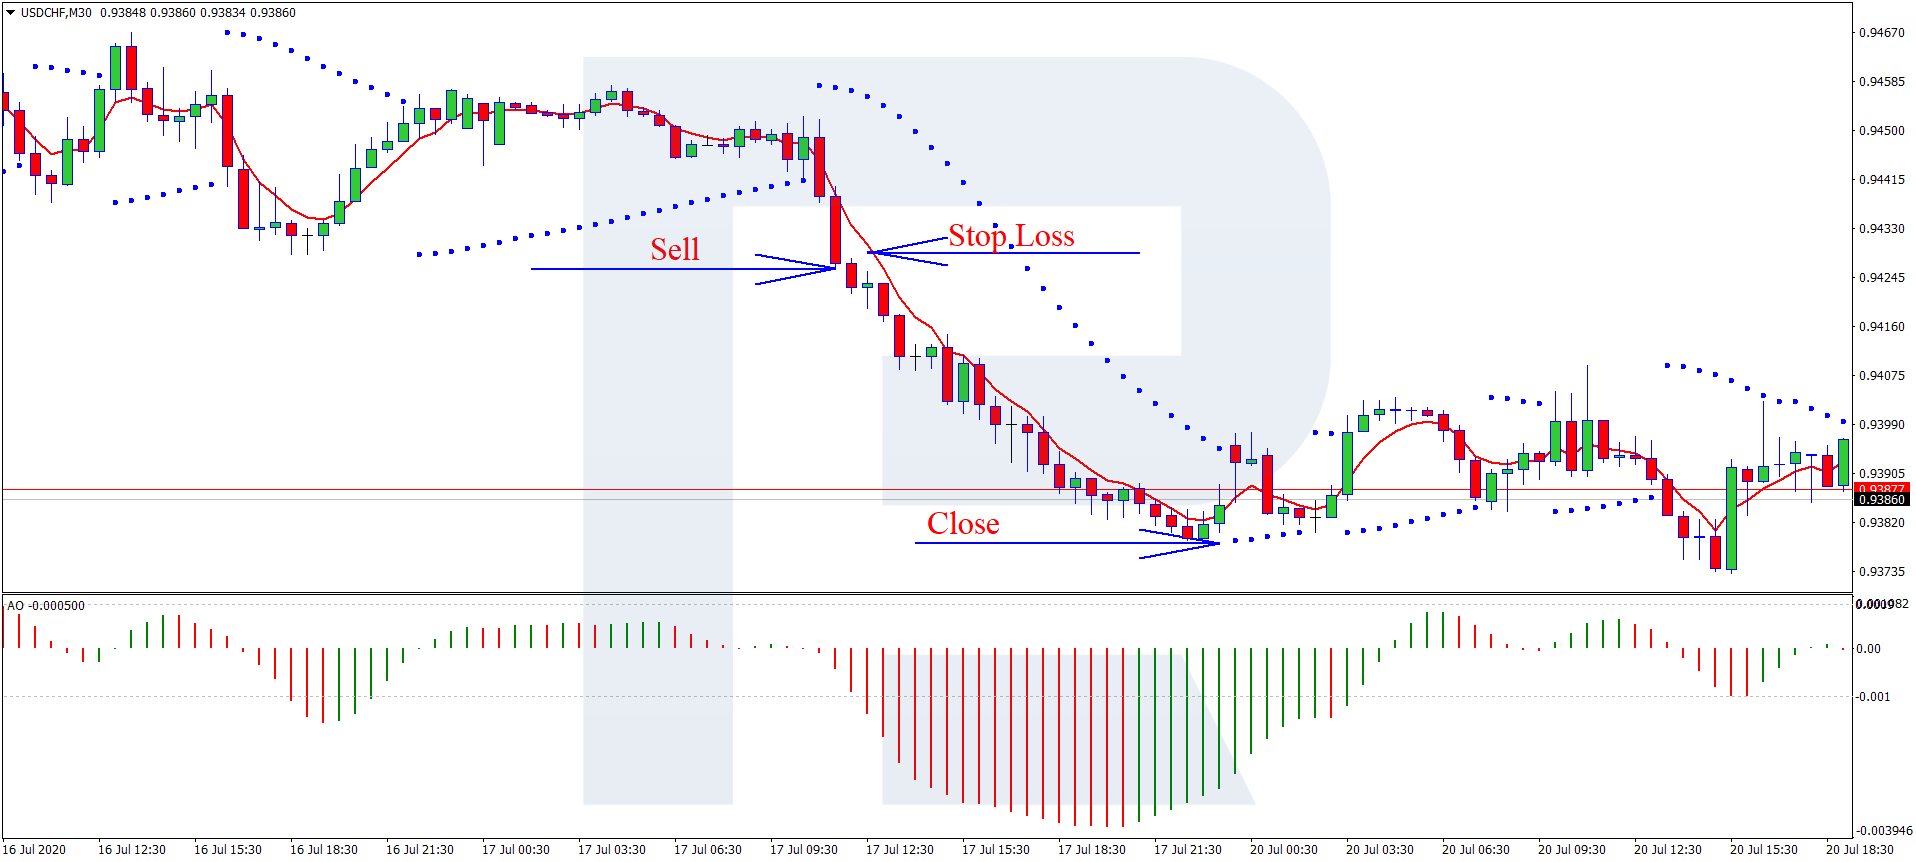
Opening a selling position by Parabolic SAR & Awesome
Awesome Oscillator becomes negative, its histograms become red; ideally, it must show to descending red bars in a row. As with buying, avoid opening a trade is the color changes all the time.
Parabolic SAR is under the chart, and the latter looks descending. If the chart starts moving horizontally, abstain from opening a position.
The EMA 5 is moving inside the candlesticks; as with buying, we need the price t tear away from the MA so that the candlestick closes below it. Then, if the next candlestick op[ens away from the EMA 5, open a selling trade.
AS with buying, the SL is placed 20 (200 in a 5-digit terminal) points away from the opening price. The TP is 15 (150) points away. In my opinion, the strategy of placing protective orders as described in the previous chapter is better.
Closing thoughts
Regardless of this strategy being meant for currency pairs only, you may try adapting it for other instruments – everything depends on the trader. Anyway, stick to the rules of opening a position. If you customize the strategy for highly-volatile pair or cross-rates, mind the risk management rules when placing Stop Losses.


