Trading with the EMA + RSI + Parabolic Strategy

6 minutes for reading
In this article, we will review a trading strategy based on two Exponential moving averages (EMA) and such indicators as RSI and Parabolic. This strategy helps to find entry points in the direction of the active trend after corrections.
The EMA + RSI + Parabolic strategy description
This indicator strategy is intended for searching for trades in the direction of the current price movement. To define the current trend direction and an entry point, we use two EMAs (fast and slow) and the RSI indicator respectively, while Parabolic serves as a guide mark for placing a Stop Loss order.
Exponential Moving Average (EMA) uses two Exponential Moving Averages with periods of 7 and 21. Moving Averages are some of the most popular and efficient tools for defining the trend. Interposition and movement direction of fast (7) and slow (21) EMAs show in which direction one is recommended to open a position.
Relative Strength Index (RSI) is a normalized oscillator, which shows the location of the price in relation to the previous period. In this strategy, the RSI is used for defining an entry point after corrections.
Parabolic SAR is a trend-following indicator created by J. Welles Wilder. In our strategy, Parabolic serves an additional indicator and a guide mark for moving a Stop order following the price. It may help to protect your profit in case of unexpected twists and turns on the market.
The strategy algorithm is the following:
- On a longer timeframe, the direction of the current trend is defined by means of two EMAs with periods of 7 and 21.
- On a shorter timeframe, we expect a correction and take a signal for entry, which is breaking 50 at the RSI (14).
- After opening a position, we’re moving a Stop order following the price by means of the Parabolic indicator.
- The strategy is multi-currency, that’s why it is suitable for any financial instrument.


EMA + RSI + Parabolic strategy trading rules
We put a fast (colored in red) EMA (period 7) and a slow (colored in blue) EMA (period 21), as well as the RSI (period 14) and the Parabolic SAR (step 0.02, maximum 0.2) on the price chart. In such popular terminals as MetaTrader 4 or MetaTrader 5, it can be done by going to Main Menu -> Insert -> Indicators.
The strategy uses two timeframes, long and short. A longer timeframe is used for defining the trend direction, a shorter one – a signal to enter the market. Different combinations of long/short timeframes can be used: D1/H4, H4/H1, H1/M15.
A signal to buy
- On a longer timeframe, the price is breaking a sideways channel to the upside and updating the local high. A fast EMA (7) is above a slow EMA (21); both are directed upwards.
- On a shorter timeframe, we are expecting a descending correction. During this correction, the RSI line must go below 50 (rarely 30). After the line reverses and crosses 50 or 30 from bottom to top, a buy order is opened.
- A Stop order is placed at the local low on a shorter timeframe. In the future, if the price grows and covers the distance equal to the Stop, it is moved into the “black”. After that, the Stop can be moved following the price using the Parabolic indicator spots, thus protecting your profit from unexpected reversals.
- Guide marks for closing a profitable position: the price reaches a strong resistance level, from which it may rebound to the downside; the price reaches a comfortable Stop/Profit ratio (for example, 1/3); a candlestick closes below a slow EMA (21); triggering of the moving Stop by Parabolic spots.
A signal to sell
- On a longer timeframe, the price is starting moving downwards. A fast EMA (7) has crossed a slow EMA (21) from top to bottom; both are directed downwards.
- On a shorter timeframe, we are expecting an ascending correction. During this correction, the RSI line must go above 50 (rarely 70). After the line reverses and crosses 50 or 70 from top to bottom, a sell order is opened.
- A Stop order is placed above the local high on a shorter timeframe in the price chart. In the future, if the price falls and covers the distance equal to the Stop, it is moved into the “black”. After that, the Stop can be moved to the downside following the price using the Parabolic indicator spots, thus protecting your profit from unexpected reversals to the upside.
- Guide marks for closing a profitable position: the price reaches a strong support level, from which it may rebound to the upside; the price reaches a comfortable Stop/Profit ratio (for example, 1/3); a candlestick closes above a slow EMA (21); triggering of the moving Stop by Parabolic spots.


Examples of Trading in EMA + RSI + Parabolic strategy
Let’s consider examples of trading using this strategy:
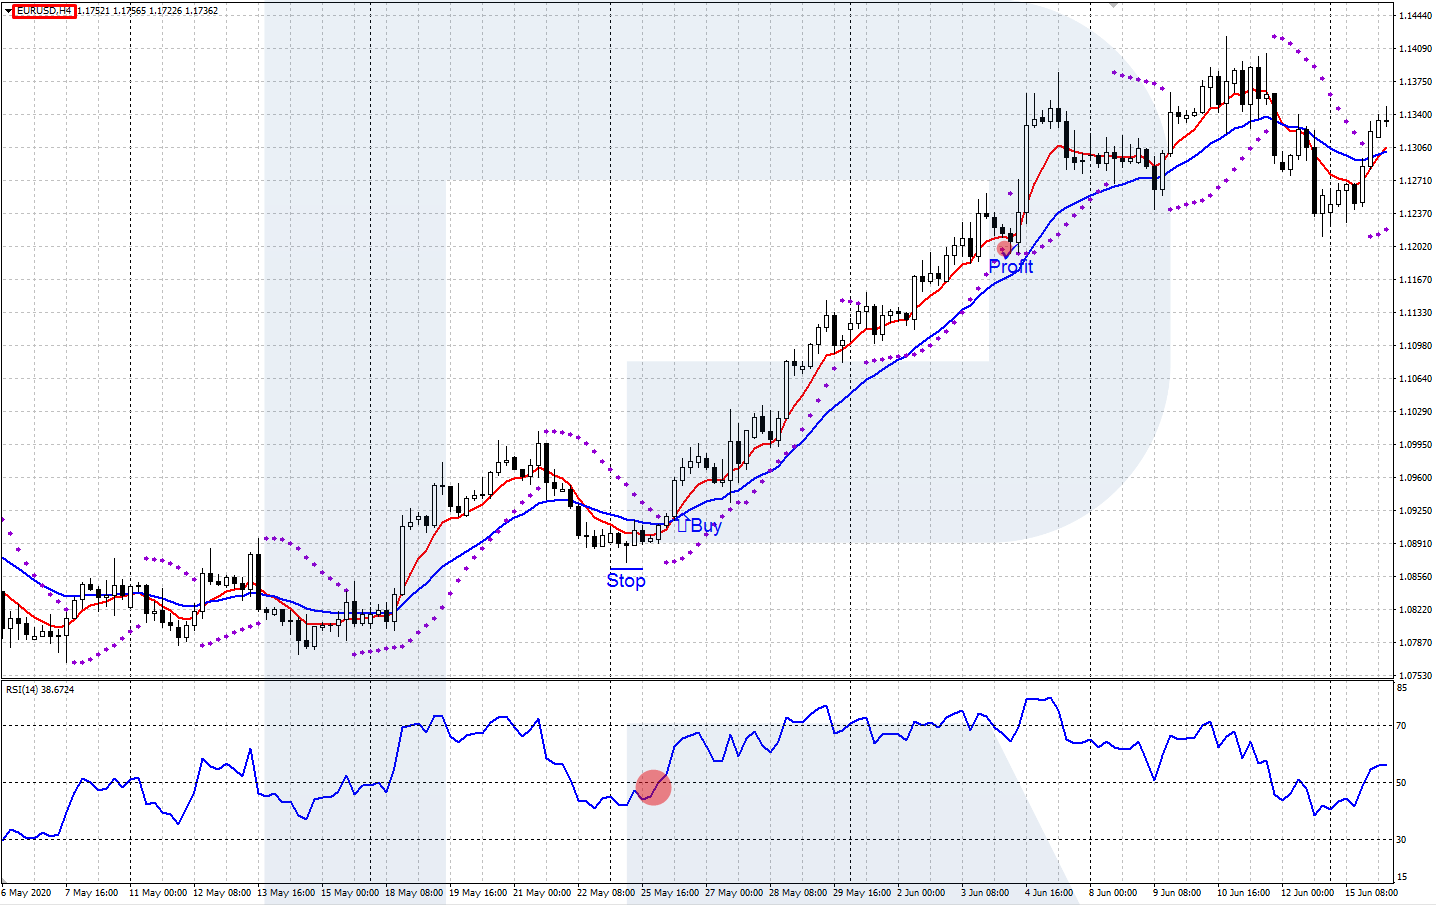
Example 1
- Instrument: EUR/USD
- Timeframes: D1/H4
- Direction: Buy
- Signal on a longer timeframe: the ascending movement started, EMA (7) crossed EMA (21) from bottom to top, Moving Averages are rising.
- Signal of a shorter timeframe: the RSI (14) line crossed 50 to the downside then reversed and crossed the same level to the upside. A buy order is opened.
- Position closing: a Stop order moving by Parabolic spots triggered.
Example 2
- Instrument: USD/CAD
- Timeframes: H4/H1
- Direction: Sell
- Signal on a longer timeframe: the descending movement started, EMA (7) crossed EMA (21) from top to bottom, Moving Averages are falling.
- Signal of a shorter timeframe: the RSI (14) line crossed 50 to the upside then reversed and crossed the same level to the downside. A sell order is opened.
- Position closing: a Stop order moving by Parabolic spots triggered.

Closing thoughts
Despite an accurate algorithm and clear signals, indicator systems shouldn’t be considered as a Holy Grail because the price movement is always primary. That’s why, the efficiency of this strategy can be improved by combining it with classic tools of the technical analysis, candlestick and Price Action patterns.
Also, indicator systems are very useful for enthusiasts of automated trading. By means of such systems, they can create Expert Advisors and set optimal parameters for trading while testing them.