Trading by Midnight Strategy: Describing on Examples

6 minutes for reading
First and foremost, I would mention that many traders mix up the Midnight and Insomnia strategies. These are two different trading methods. In Insomnia, we trade on H1; however, in case of Midnight trading strategy, we work on daily charts.
By Midnight, you enter the market about midnight, at the beginning of a new trading day – this peculiarity gave the trading strategy its name. The trader does not need much time for chart analysis because they work on D1 where changes are scarce.
The method is based on the fact that you cannot find two subsequent candlesticks that would be identical: each one is either higher or lower than the previous one. Thanks to the timeframe being large, we eliminate price noises that is abundant on hourly timeframes. Note that in lengthy flats and reversals the system might give false signals. Traders recommend to skip such situations and remain out of the market.
What do you need to trade by Midnight?
The strategy requires volatile instruments. Normally, investors choose GBP/USD but you may try other instruments. As you remember, you can select a currency pair for any strategy and adapt the latter to your preferences.
Trade on daily charts only, never use the strategy on hourly timeframes. The main reason is the lack of unwanted price movements: the smaller the timeframe, the more noises you will have to analyze before making up your mind. The larger the timeframe, the more efficient is each signal – just note that many authors teaching tech analysis use only daily or larger timeframes in their books.
You do not need any additional indicators, we will only be using the price chart. Many traders state that it is the price chart that reflects the real market situation while indicators are just following the price and cannot give high-quality signals because they lag a lot.


How to open a trade by the Midnight strategy?
At midnight sharp, as soon as the candlestick of a new trading day forms, evaluate the size of the previous candlestick. If it is smaller than 90 points, the shadow included, avoid opening a trade. This is the recommendation for GBP/USD; hence, the height of the candlestick for EUR/USD may be smaller. Authors recommend to change this parameter after studying the behavior of your pair for some time.
If the candlestick is larger than 90 points, proceed to opening a position according to the following recommendations:
- Place a pending Buy Stop order 5 points above the high of the candlestick and a Stop Loss 3 points under the daily low.
- Place a pending Sell Stop order 5 points under the low of the candlestick and a Stop Loss 3 points above the daily high.
While working with a certain currency pair, you may also decide to place the orders closer to the extremes or farther from them depending on the behavior of the instrument. A new trading instrument needs time for signals to work off – thus it will be easier to choose optimum levels for the orders; however, you may start with those suggested above.
How to close a trade by the Midnight strategy?
After you open a trade, hols it for the next trading day. As soon as the candlestick closes and a new one starts to form, place orders by the above-mentioned scheme regardless of the previous ones remaining open. Hold the preceding trade until it brings 100 points of profit.
As sson as we get 100 points of profit, close the trade. The second trade remains open until it, again, yields 100 points or closes by the SL. Traders think that this approach maximizes their profit thanks to good market movements.
Close all trades if a Doji candlestick or something similar forms because it means a reversal or some market ambiguity. Also, close your position at a Shooting Star in a bullish trend and a Hammer in a bearish market.
If the market is growing every day, you may move the SL under the daily low or just hold the positions as long as possible until the market reverses. This way you go along with the trend and increase the volume of your open positions.
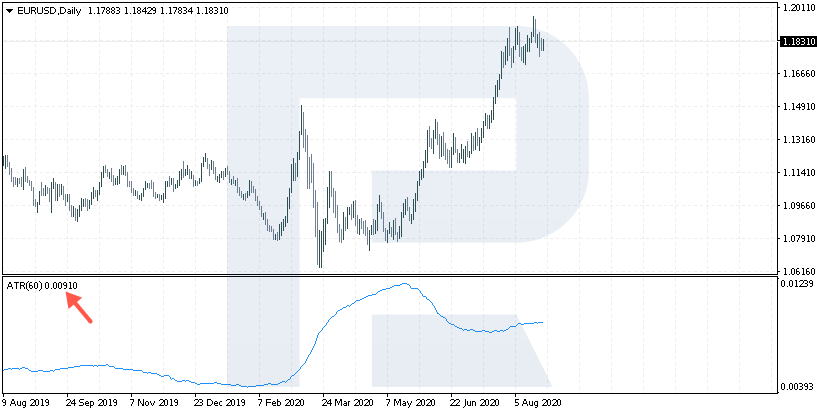
How to define an average price movement in points?
It is rather easy to find a goal for the daily movement: you only need to know an average daily price movement for your instrument. For this, use the ATR indicator: add it to the chart, choose the period – for example, 60 days – and check how many points the pair covers every day. For example, for EUR/USD an average movement is 89 points.
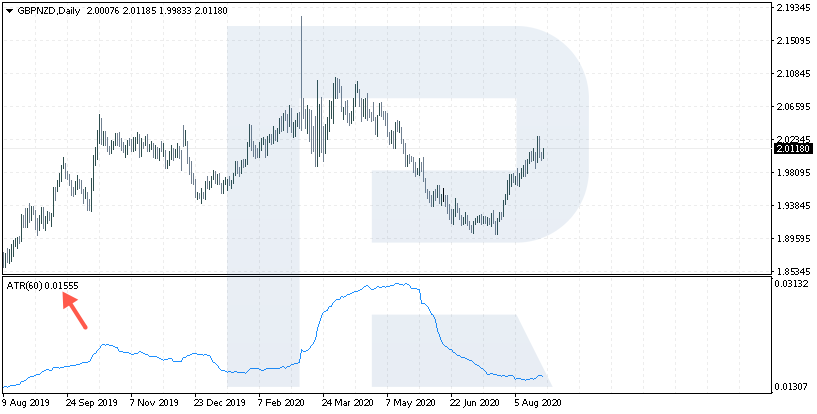
As long as GBP/NZD is more volatile, it covers 155.
Traders say that for the position to close with a profit, place the order at least in the middle of this range or cover the whole daily range.
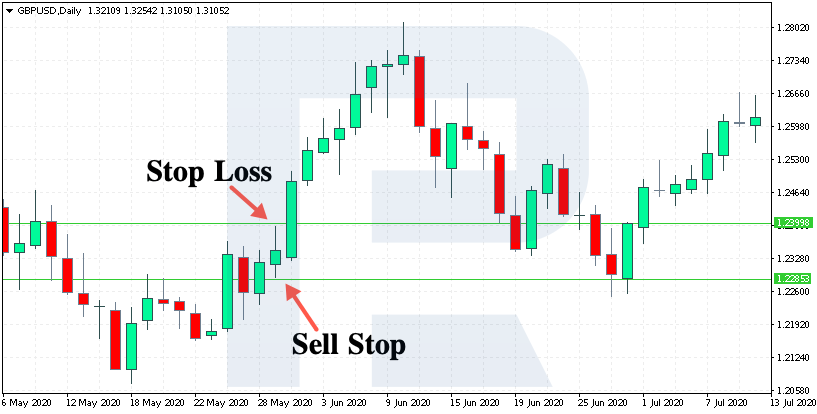
An example of opening a position by Midnight
Let us rehearse opening a position with GBP/USD. As you see, a candlestick sized 108 points closed. The movement is all right for us as it was larger than 90 points. Place a Buy Stop at 1.2398 and a Stop Loss at 1.2286.
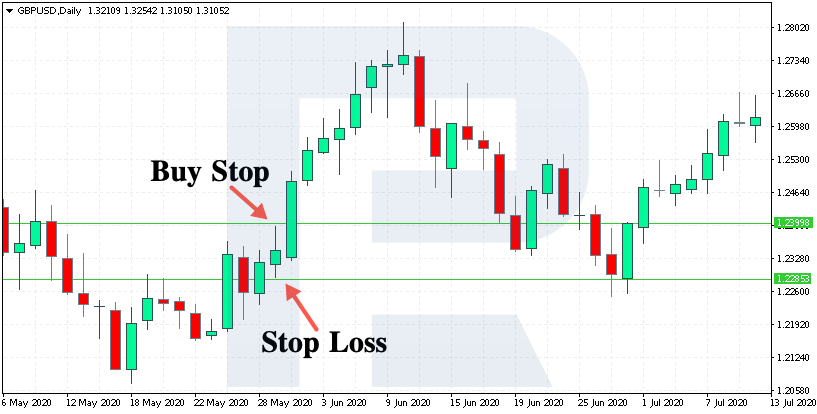
Here as well, place a Sell Stop at 1.2284 and a Stop Loss at 1.2398.
The very next day, the price grew significantly, and at midnight, we had 90 points of profit. We may close this trade and go on placing new orders – or move the SL by this position to 1.2319, which will be 3 points lower than the daily low.
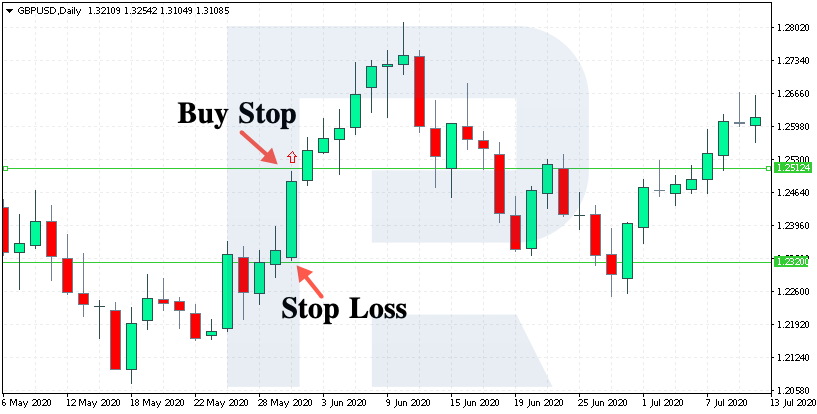
Then, place a pending Buy Stop again at 1.2511 with an SL at 1.2319.
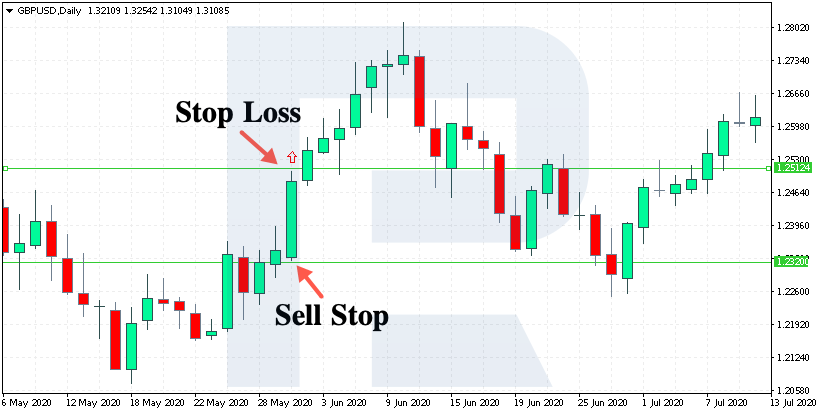
Place a Sell Stop at and a corresponding Stop Loss at 1.2509. The very next trading day, the high got broken away. At midnight, we have 43 points of profit by this buy, so either move the SL to 1.2473 behind the low of the candlestick or wait for our 90 points of the movement. The first trade, in this case, will be giving 153 points of profit.
All in all, these positions could bring us 196 points of profit. Trading conservatively, we could take 90 points of the first profit and leave the second one open because we have not got our 90 points by it yet.
Closing thoughts
The Midnight trading strategy (not to be mixed with Insomnia) is a curious way to work on daily charts. It requires very little time from the trader: just assess the charts at midnight, place pending orders, correct and track changes (at midnight only).
What might be called a disadvantage is the large size of Stop Losses – they might reach 90,150 or more points because we are working on daily charts.
The advantage of the strategy is trading the trend. We do not try to forecast what will happen to the market, we just follow the price were it goes. Of course, there are times when two orders are triggered at once – but every trading method gives a number of signals that never work off.


