How to Trade with High_Low Indicator?

6 minutes for reading
In this overview, we will discuss an interesting and useful indicator called High_Low. It helps the trader to find important support/resistance levels on the chart.
Description of High_Low indicator
The High_Low indicator is created to represent the highs and lows of a certain period (day, week, month) on the chart. In fact, High_Low automatically marks important support/resistance levels on the chart: local highs/lows are some sort of markers that help to forecast further price progression.
According to its settings, High_low marks the following extremes on the chart:
- Monthly are the extreme lines of the current and previous month.
- Weekly are the extreme lines of the current and previous week.
- Daily are the extreme lines of the current and previous day.
As a result, on the chart, we can see a network of certain price lines, each of which may act as a support or resistance level. The lines feature different styles, colors, text symbols.
The longer the timeframe, the more important are the lines drawn through its highs and lows. Based on tech analysis, estimating the reaction of the price to the High_Low lines, you can make weighed trading decisions.

Installing and setting up High_Low indicator
To install the indicator into a popular trading terminal MetaTrader 4, download the file by clicking the link at the end of this article and copy it to the Indicators folder. To do it, open the Main Menu of the terminal, then File/Open Data Catalogue/MQL 4/Indicators – and copy the file into the folder; then restart the terminal.
As a result, High_Low will appear on the list of user indicators; add it to the chart of your instrument via Insert/Indicators/User/High_Low – or simply left-click and drag to the chart from the Navigate window.
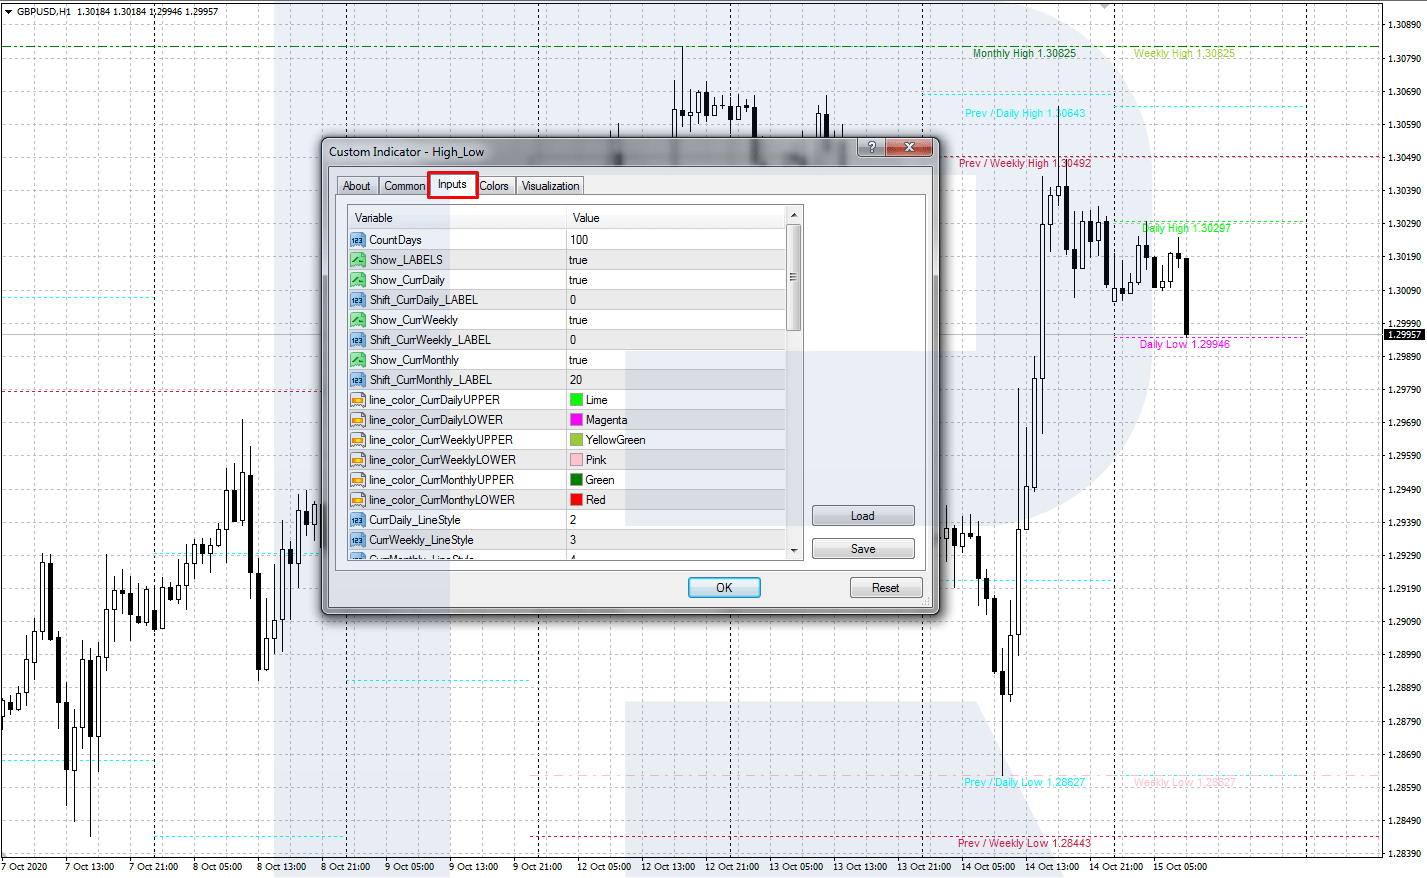
You can set up the following parameters:
- CountDays is the days when the indicator lines will be drawn on the chart.
- Show_LABELS switches on (true) and off (false) text labeling of the lines.
- Show_CurrDaily switches on (true) and off (false) representation of the high and low of the day.
- Shift_CurrDaily_LABEL sets the distance between the name of the daily line and the right border of the chart window.
- Show_CurrWeekly switches on (true) and off (false) representation of the high and low of the week.
- Shift_CurrWeekly_LABEL sets the distance between the name of the weekly line and the right border of the chart window.
- Show_CurrMonthly switches on (true) and off (false) representation of the high and low of the month.
- Shift_CurrMonthly_LABEL sets the distance between the name of the monthly line and the right border of the chart window.
- line_color_CurrDaily (UPPER, LOWER) sets the color of the high and low lines of the day.
- line_color_CurrWeekly (UPPER, LOWER) sets the color of the high and low lines of the week.
- line_color_CurrMonthly (UPPER, LOWER) sets the color of the high and low lines of the month.
- Curr_LineStyle (Daily, Weekly, Monthly) sets the style of the daily, weekly, and monthly lines, respectively.
- Show_Previous (Daily, Weekly, Monthly) shows/hides the lines of the previous day, week, and month.
- Xtend_Prev (DailyLine, WeeklyLine, MonthlyLine) shows/hides all the lines for the calculation period (daily/weekly/monthly).
- line_color_Previous (Daily, Weekly, Monthly) sets the color of the previous daily/weekly/monthly lines.
- Show_CurrRectangle_Display shows/hides current price ranges in the form of colored rectangles.
- Show_Pivots (Daily, Weekly, Monthly) shows/hides daily/weekly/monthly Pivot levels.
The indicator can be used with the default settings. You can set it up according to your preferences later.
How to use High_Low indicator in trading?
As I have mentioned above, the lines of High_Low are local support/resistance levels. Hence, we can use classical tech analysis methods of trading support/resistance levels. The strongest signal is the one given by monthly lines, then go the weekly ones, then daily.
As a rule, we make decisions based on the interaction of the current lines with those of the preceding period (last month, week, day). Let us discuss three trading options.
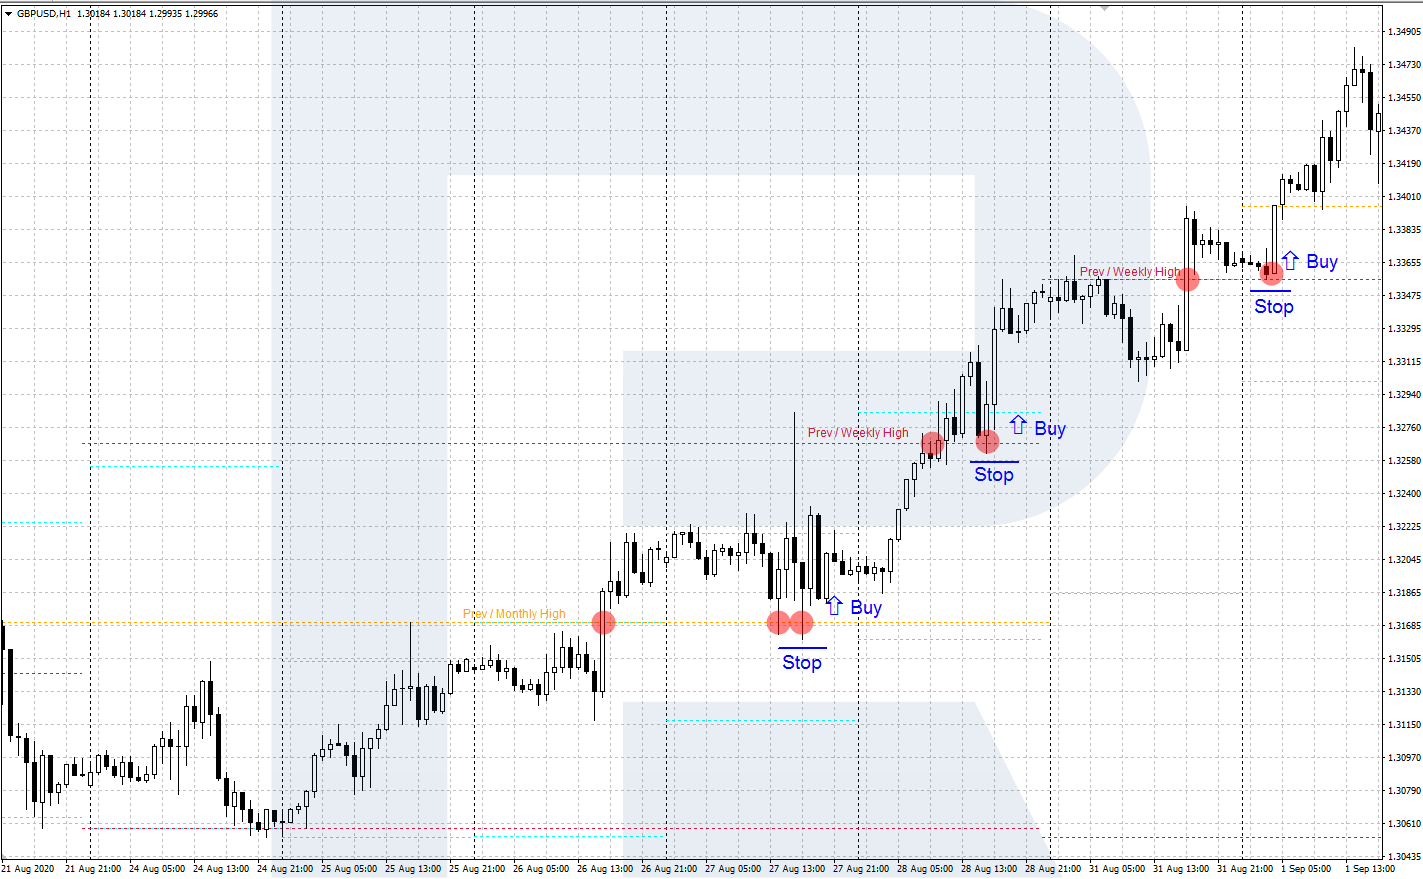
A breakaway of the indicator lines
Trading here is based on breakaways of support/resistance lines:
- The price breaks away an indicator line (and closes above/below it).
- Then it pulls back to the broken line; open a buying/selling position.
- Place the Stop Loss behind the broken indicator line.
- Take Profit - when the price reaches the next indicator line, or when clear evidence of a reversal appears.
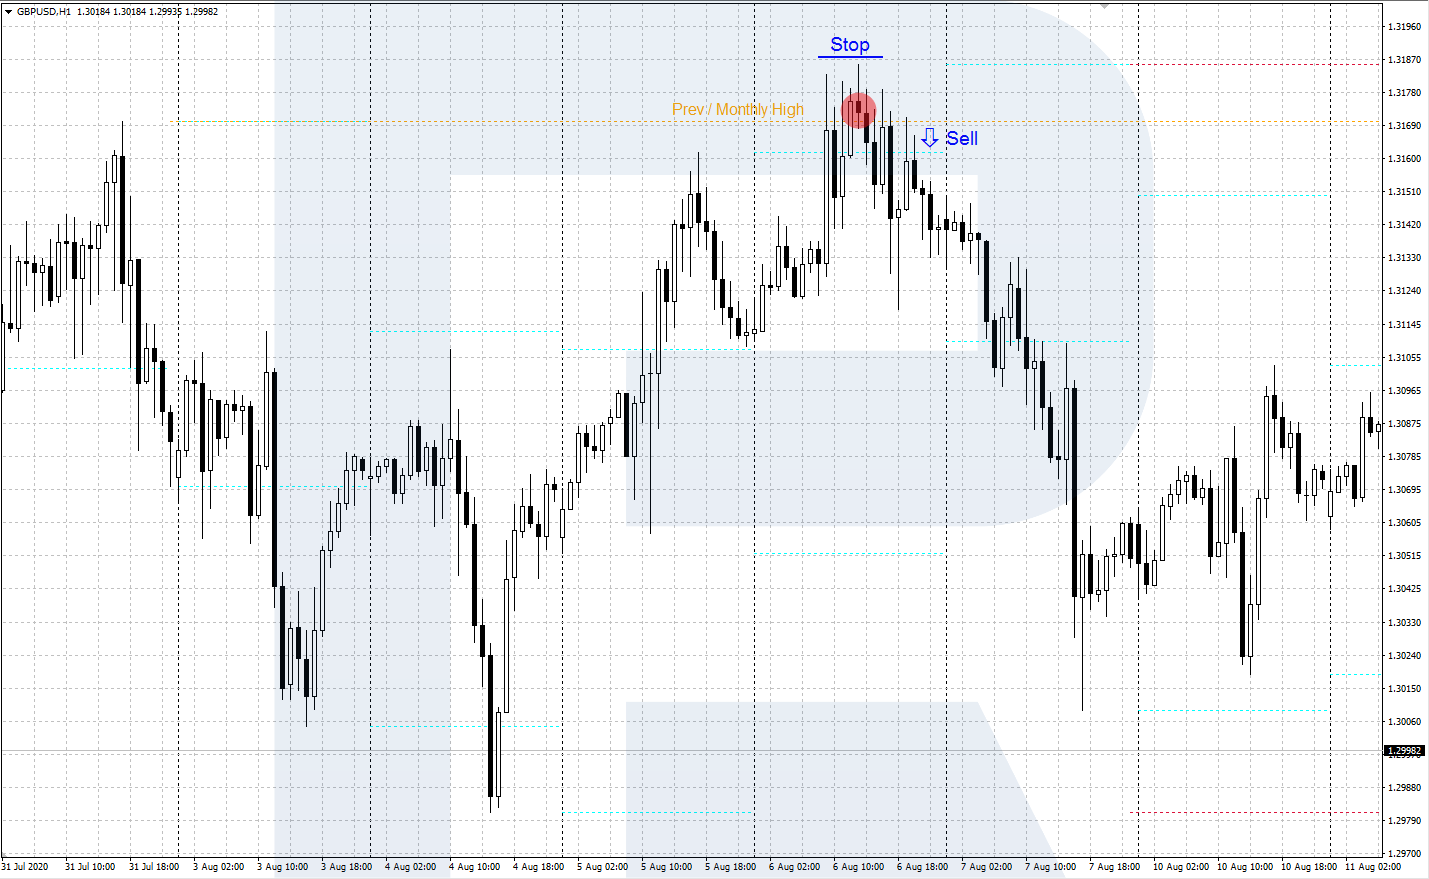
A bounce off the indicator line
Here, trading is based on bounces off strong support/resistance levels:
- The price reached an indicator line but failed to break it away.
- When the bounce forms, open a buying/selling position.
- Place the SL behind the indicator line off which the price has bounced.
- Take the profit when another important line of the indicator is reached, or when clear evidence of a reversal appears.
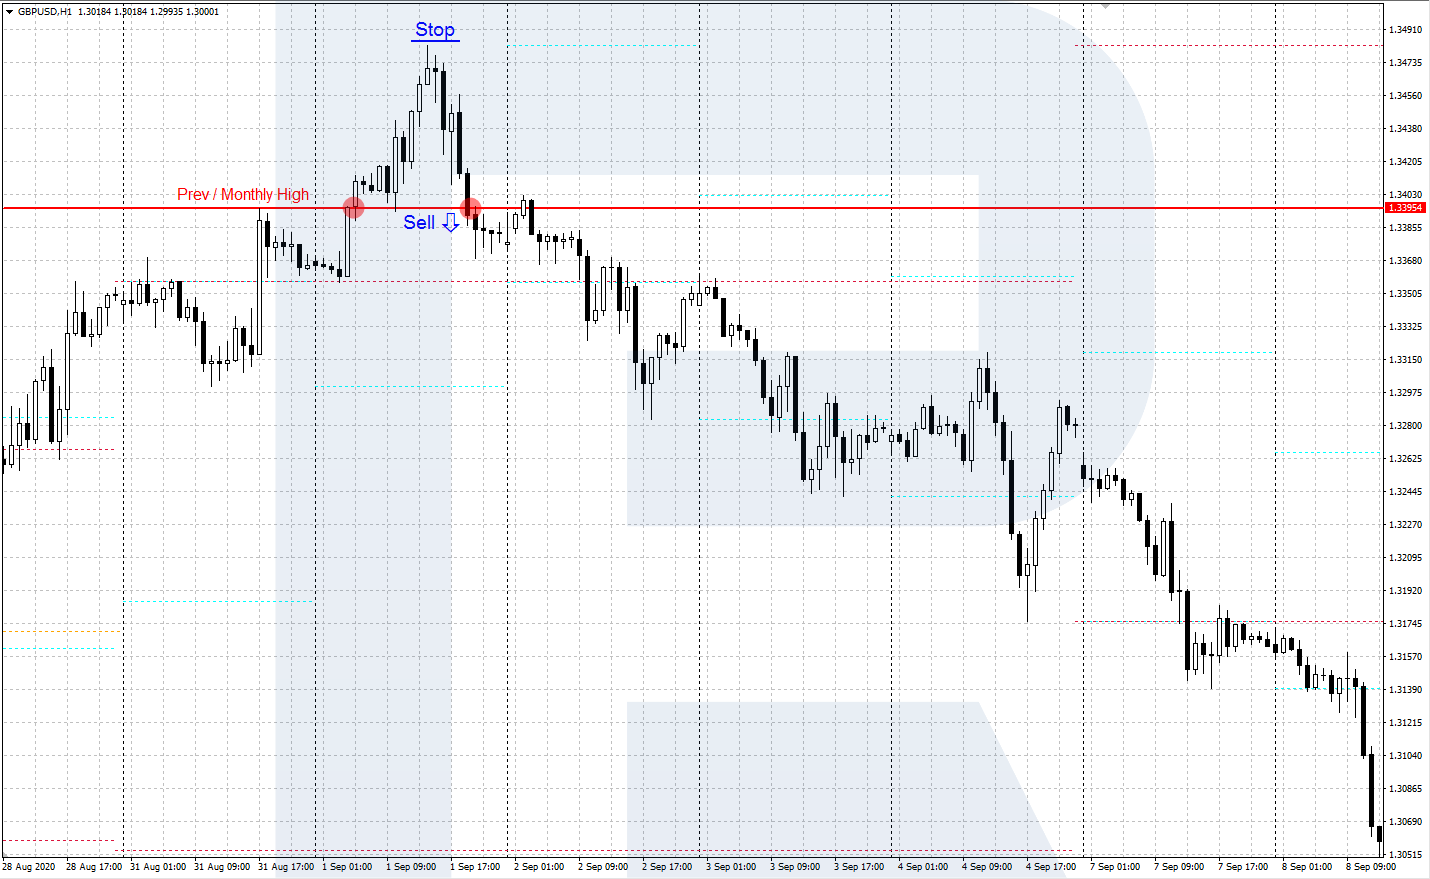
A false breakaway of the indicator line
Here, we use the technique of trading false breakaways of support/resistance levels:
- The price breaks an indicator line away but fails to secure there and returns behind the line.
- After the false breakaway formed, open a buying/selling position.
- Place the SL behind the high/low of the false breakaway.
- Take the profit when another important line of the indicator is reached, or when clear evidence of a reversal appears.
Closing thoughts
The High_Low indicator can help the trader analyze the market. It saves a lot of time and effort by automatically drawing important levels (based on monthly, weekly, and daily extremes).
To make trading signals more efficient, you can combine High_Low with other means of tech analysis: candlestick, price figures, or Price Action patterns.