Trading with Ichimoku and Awesome Oscillator

6 minutes for reading
Almost any trading strategy suggests using several indicators for finding market entry signals. In most cases, if a trend indicator is used, we supplement it with an oscillator to confirm the first signal and show the direction of the general trend.
Our strategy uses the Ichimoku and Awesome Oscillator indicators. Ichimoku Kinko Hyo is an excellent trend indicator that perfectly shows the current market trend. Awesome Oscillator demonstrates the deviation of the price from the average value. It is quite similar to the MACD indicator that demonstrates the divergence of the price chart and the indicator chart.
The strategy will give signals at trend reversals. According to authors and traders, such signals can be found on any currency pairs, which means the strategy suits both majors and less popular pairs. For market entry, we use H1, but longer timeframes are also worth trying.


Setting up the strategy Ichimoku + Awesome
As I said above, the strategy requires the use of two indicators only, which makes it suitable even for traders with minimum expertise. So, we need to add two indicators with standard parameters to the chart:
Ichimoku Kinko Hyo. As we have figured out, it shows the actual market trend. Normally, if the prices rest above the Ichimoku Cloud, the trend is bullish (ascending). Conversely, if the price has broken the Cloud away and turned out under it, the trend on the chart is descending. Also, the price may trade inside the Cloud, in which situation, traders speak of a flat and wait for the price to escape the Cloud to catch the beginning of a new wave.
Awesome Oscillator is an indicator that gives good signals in a flat. A strong signal is a divergence of the p[rice and indicator charts in the direction of the main trend. The color of the histogram and its position in relation to zero will also be important.
How to open a buying trade?
To open a buying position, the following is important:
The closing price of the candlestick broke through the Senkou Span A line from below, which means the candlestick closed above the upper border of the Ichimoku Cloud.
The Awesome Oscillator histogram is green and above zero. As a rule, this means an ascending impulse in the market.
As soon as you see such a situation, open a buying position on the next candlestick.
To place a Stop Loss, find the nearest support area and place it five points below this level. The Take Profit must equal the SL, or find the nearest resistance level on the price chart and place it there.
An example of buying by the Ichimoku + Awesome strategy
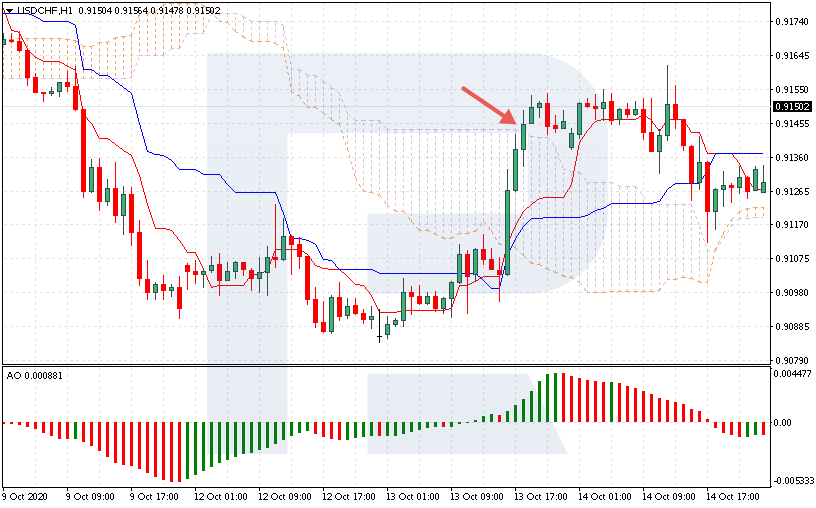
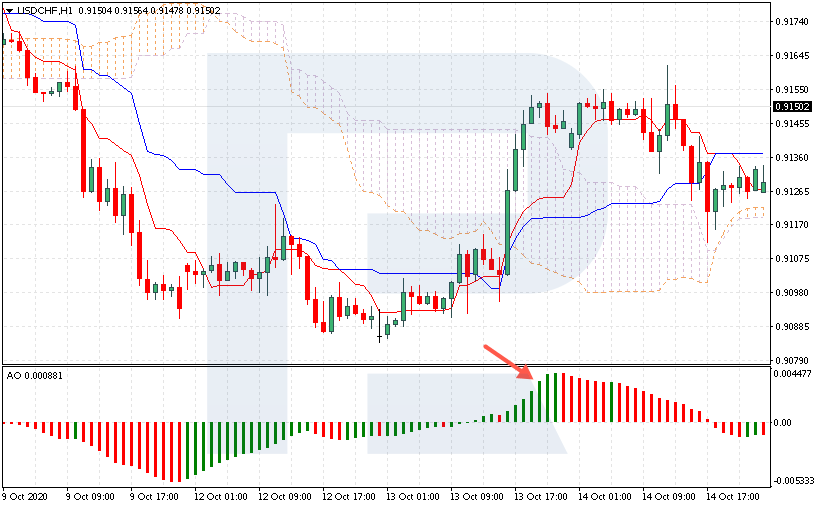
Let us discuss an example of the EUR/USD pair.
As we see, the price rose above Senkou Span A and closed above the Ichimoku Cloud. After receiving such a signal, we need to estimate the Awesome Oscillator signals – the histogram is above zero and green. When the next candlestick opens, open a buying position at the price of 1.1780.
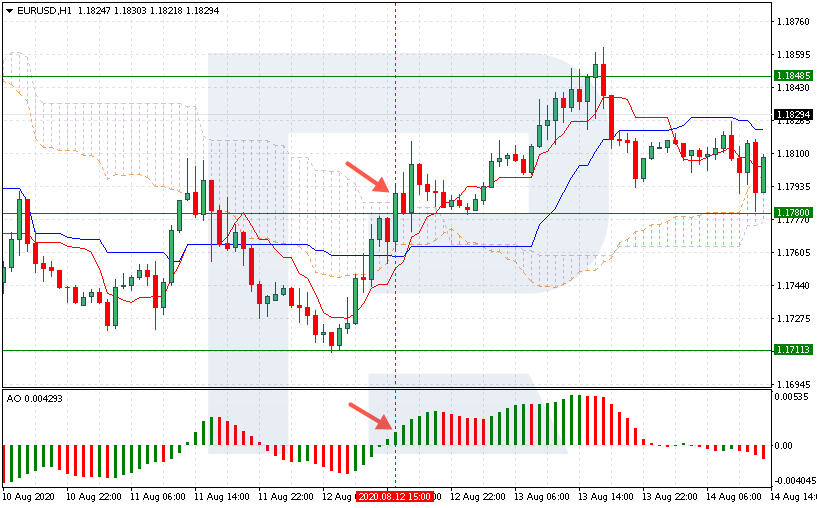
To find the level for the Stop Loss, find the nearest support area – at 1.1711. We cannot detect the support level up to a point, so each trader decides this based on tech analysis. From 1.1711, we count five points down and place an SL at 1.1706.
To place a TP, we find the nearest resistance area – 1.1905. Or, take the SL size, which is 74 points. Hence, we place the TP at 1.1854. As we see, the price reaches this level, and the position closes with a profit.


How to open a selling trade?
Normally, a selling trade reflects a buying one mirror-like. To open a selling position, the following is important:
The closing price of the candlestick broke through the Senkou Span A line from above, which means the candlestick closed under the lower border of the Ichimoku Cloud. This indicates a declining impulse, hence, it would be logical to sell.
The Awesome Oscillator histogram is red and below zero. As a rule, this means a bearish impulse in the market.
As soon as you see such a situation, open a selling position on the next candlestick.
To place an SL, find the nearest resistance level and place it five points below this level. The Take Profit must equal the SL, or find the nearest support area on the price chart and place it there.
An example of selling by the Ichimoku + Awesome strategy
Let us discuss an example of the EUR/USD pair.
As we see, the candlestick dropped and closed below the Senkou Span A of the Ichimoku indicator. After we receive this signal, look at the oscillator – the histogram is red and below zero. On the next candlestick, open a selling position at 1.1876.
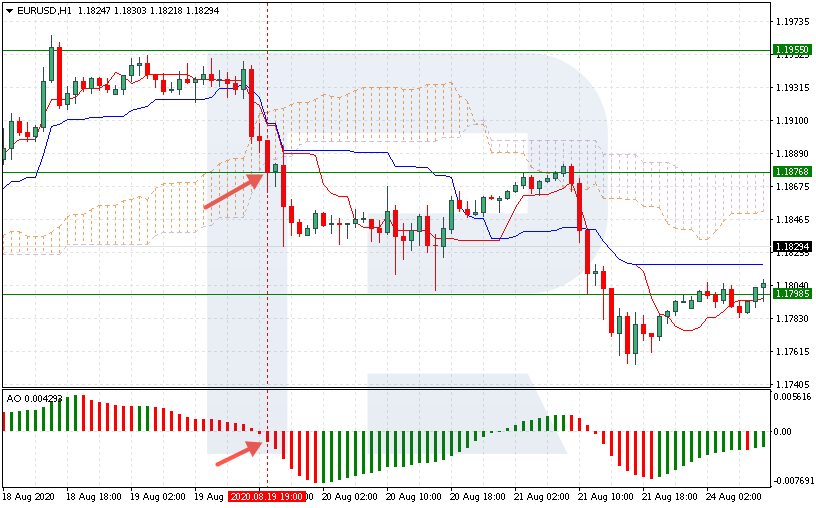
To figure out the SL level, find the nearest resistance area. In our case, it is at 1.1955. Take five points higher and place the SL on 1.1960.
To place a TP, find the nearest support area or take the size of the SL, which is 79 points. Hence, we place a TP at 1.1797. After a correction, the price does reach this level and closes with a profit.
Bottom line
In the strategy in question, we use two indicators – Ichimoku Kinko Hyo and Awesome Oscillator but not as just a trend indicator and an oscillator taken together.
The trader’s task here is to catch the beginning of a new trend and enter in the direction of the impulse. A breakaway of the Ichimoku Cloud is a strong signal as it is, and the signals of the oscillator just confirm them.
The advantage of the strategy is its simplicity. Even a beginner will easily master it in a couple of hours. Another advantage is trading the trend.
The disadvantage is the profit-to-loss ratio. The SL equals the TP, and many traders want the ratio to be at least 1:2, for the profit to cover for several losing trades. However, the rules allow us to find the nearest levels and place the TP in such a way that the profit will be higher than the SL.


