Best Medium-Term Strategies: Follow the Trend

6 minutes for reading
Using a strategy that follows the trend, we presume that the current trend is more likely to continue than to come to an end. Theoretically, things are simple: when the price is growing, we buy, and when it is falling, we sell.
Some tech analysis authors recommend trading breakaways of lows in a downtrend or look for an end of a bullish correction to catch a stronger movement.
A serious advantage of working by the trend is also the number of points that such an unhindered movement can bring you. If you look at a trend on the chart, you will notice that corrections take up not that much time or that many points. On the contrary, growing or falling by the trend, the price needs more time and space.
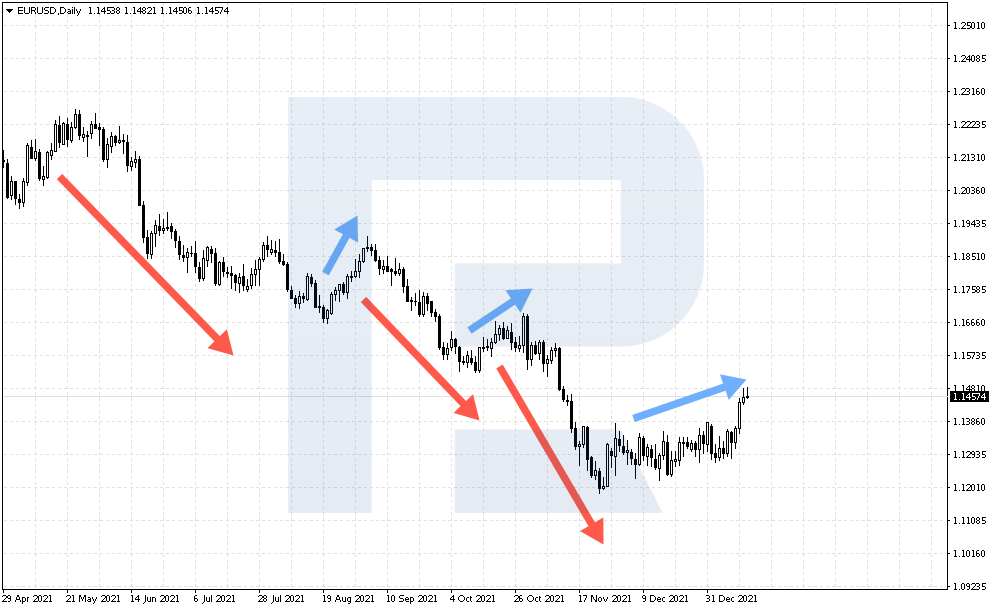
The “Follow the Trend” strategy uses three indicators – the Moving Averages, Moving Averages Convergence-Divergence (MACD), and Average Directional Movement Index (ADX).
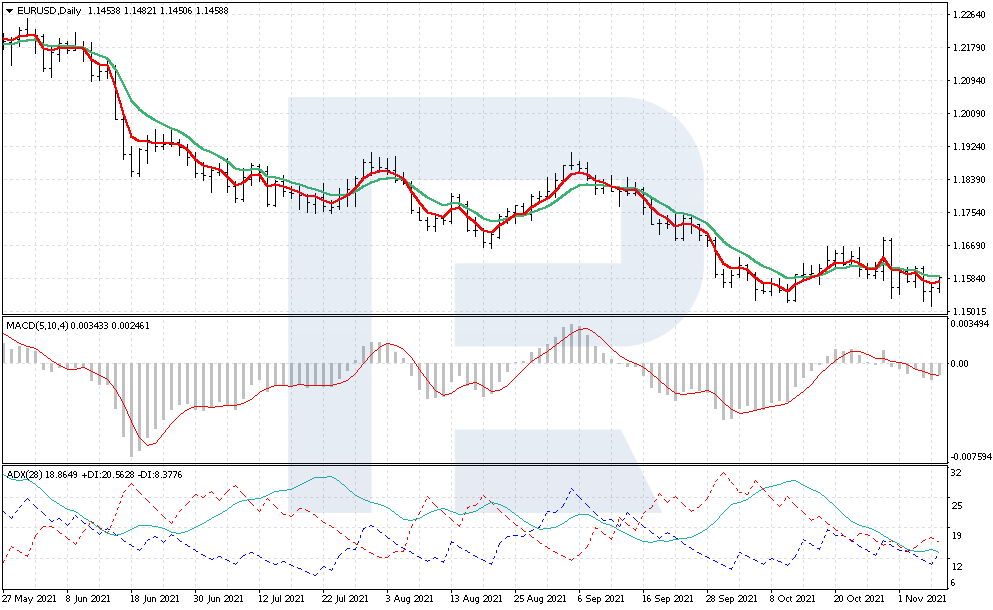
Let us see how we can use three indicators at once to trade the trend, figure out the rules and the details of assessing risks and profit.
Rules and principles of “Follow the Trend”
Use the H4 or D1 timeframes. Always keep in mind that the smaller the TF, the lower is your risk because movements on H4 are not as vast as on D1; however, movements by the trend will also be much smaller.
If you want lower risks and frequent exit signals, opt for H4. If you choose D1, there will be fewer signals but potential movements will be lengthier.
The strategy suits any currency pair; just use all the three indicators – the MAs, MACD, and ADX.
The strategy is based on the ADX (28) indicator. You will need to analyze its signal lines to find out what is the current market trend.
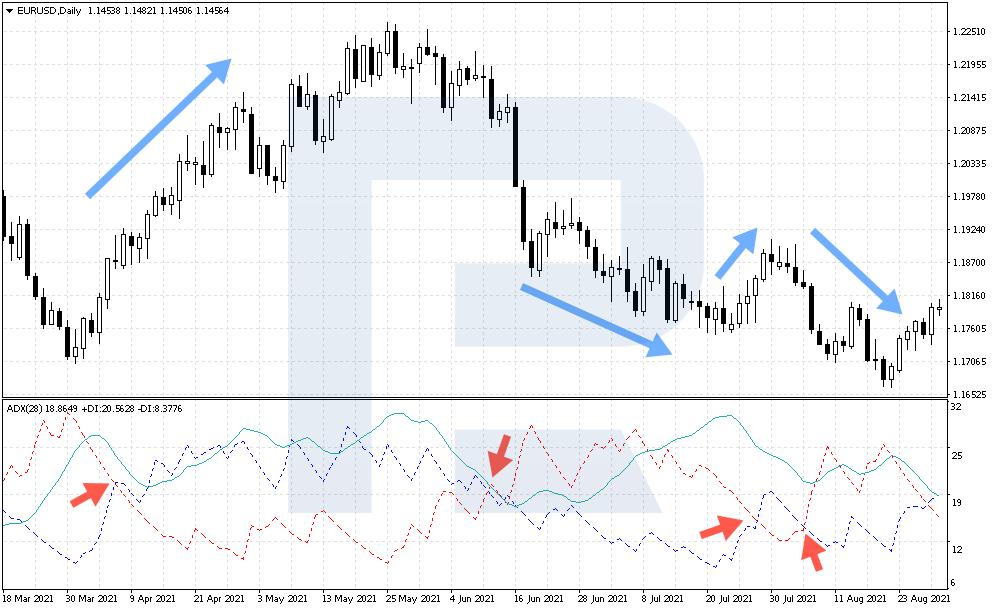
Analyzing ADX, look at +DI and –DI. When the +DI dotted line rises above –DI, the trend is ascending. Then analyze the remaining indicators to confirm your decision. And if –DI drops under +DI, the trend is bearish, so look for signals to sell.
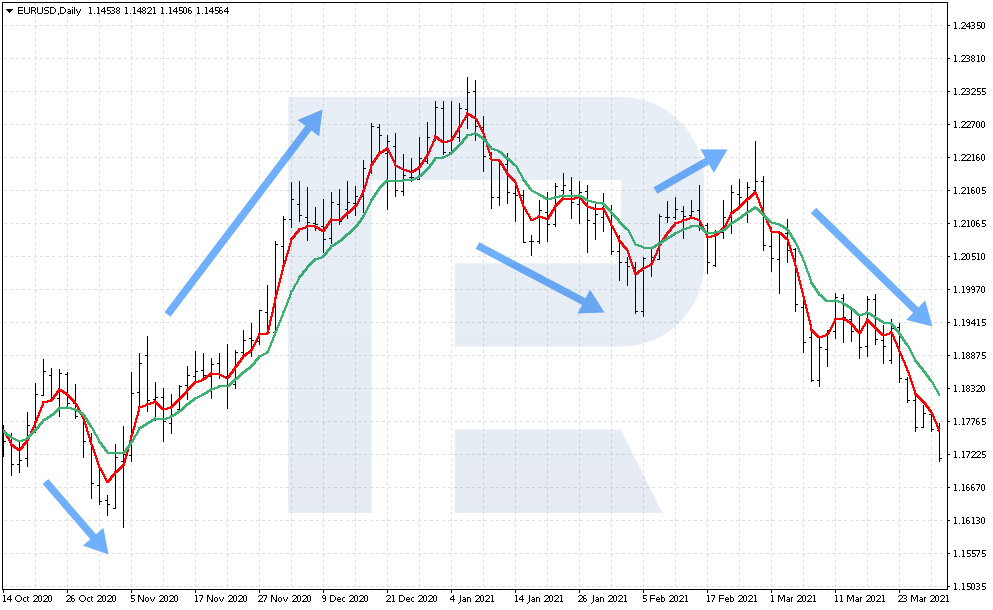
Two Exponential MA (4) and (10) will give confirmation signals for your trades. If EMA (4) breaks through EMA (10) from above, this is a signal to sell. If EMA (4) breaks through EMA (10 from below, consider opening a trade by the bullish trend.
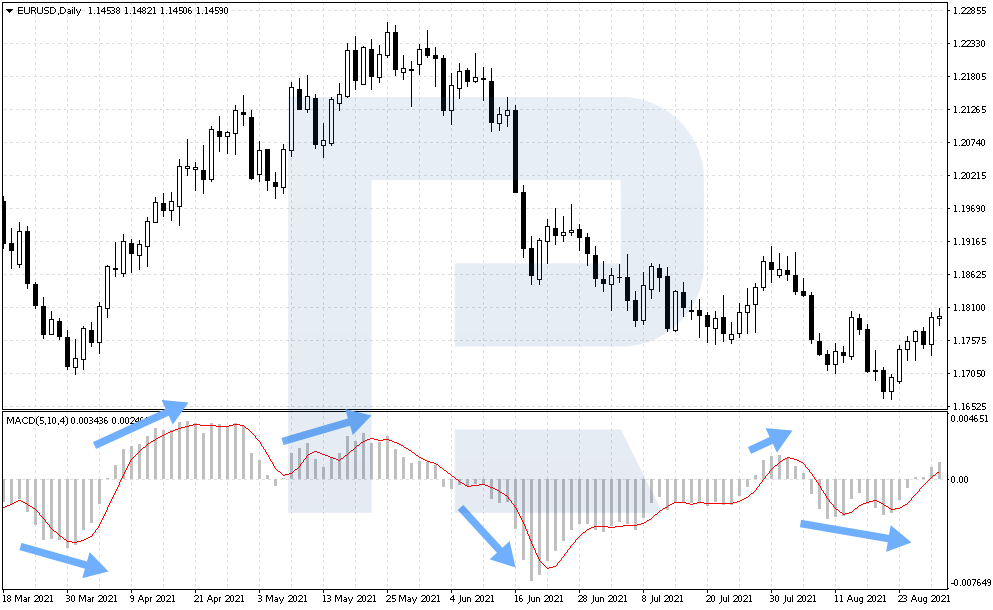
Parameters for the MACD are 5, 10, and 4. To confirm a signal to buy, the histogram must be above zero, and for a signal to sell to be confirmed, the histogram must drop below zero. As you remember, the MACD shows the distance between two MAs, and when the histogram breaks through the zero line, this is a signal for a trend reversal.
How to buy by “Follow the trend”
When all the indicators are on the chart, you can start learning the rules of opening a buying trade. To complete such an operation, we need three conditions to be fulfilled:
- The +DI signal line is above the –DI signal line.
- EMA (4) has crossed EMA (10) from below.
- The MACD histogram is above zero.
As soon as all conditions are fulfilled, open a buying position. If you work on an H4, place a Stop Loss 20 points below the entry point and a Take Profit – 60 points above it. And if you work on a D1, place a 200-points TP and a 70-points SL.
Example of a buying trade
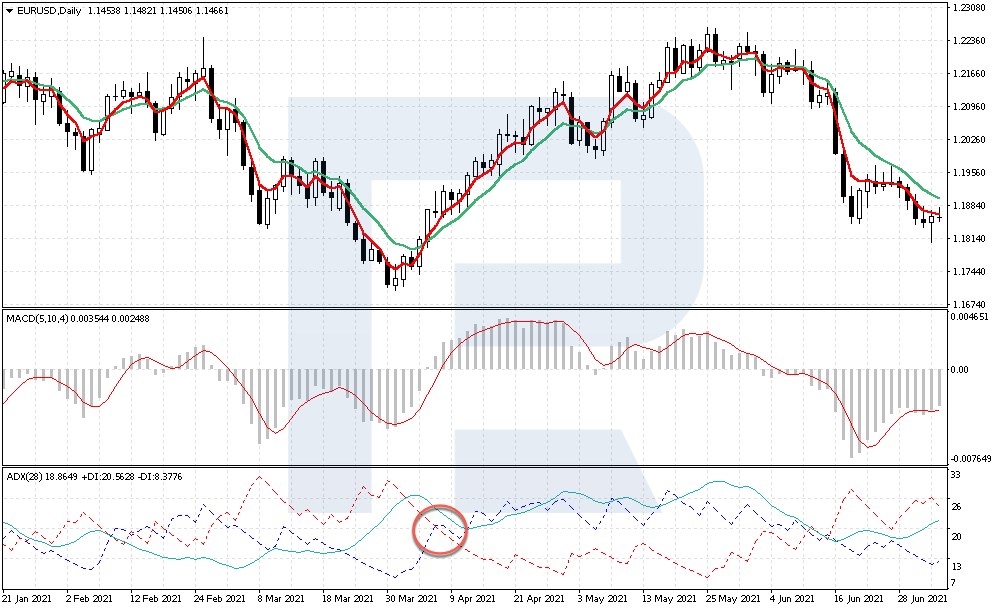
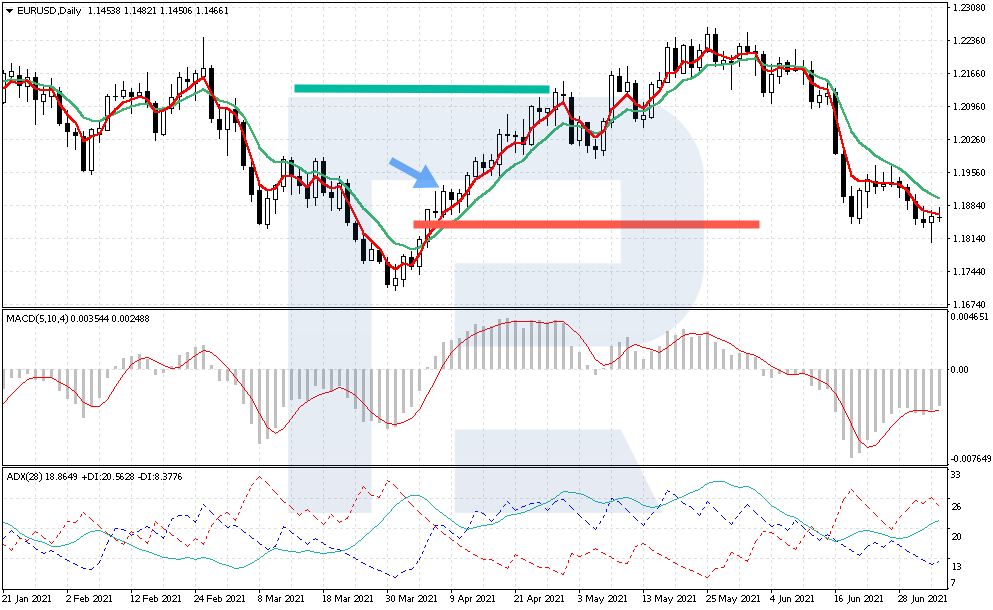
Let us see an example of trading EUR/USD. On April 8th, 2021, the +DI signal line of ADX broke through –DI and secured above it. This was the first signal to open a position by the bullish trade.
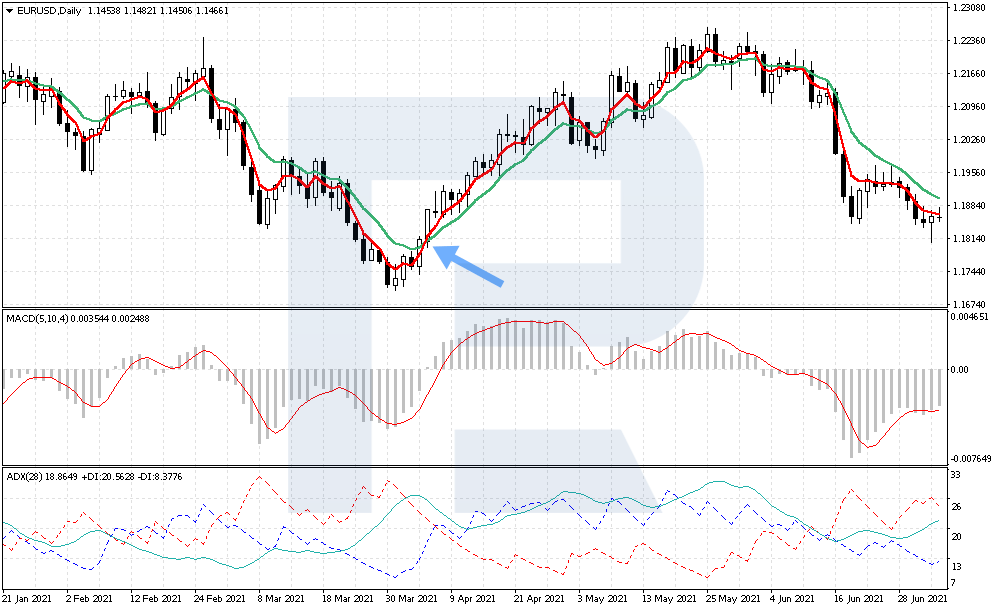
Then check out the position of the MAs: the EMA (4) is above the EMA (10) – and this is the second condition for the trade.
The third part is assessing the MACD histogram: note that the indicator values are above zero.
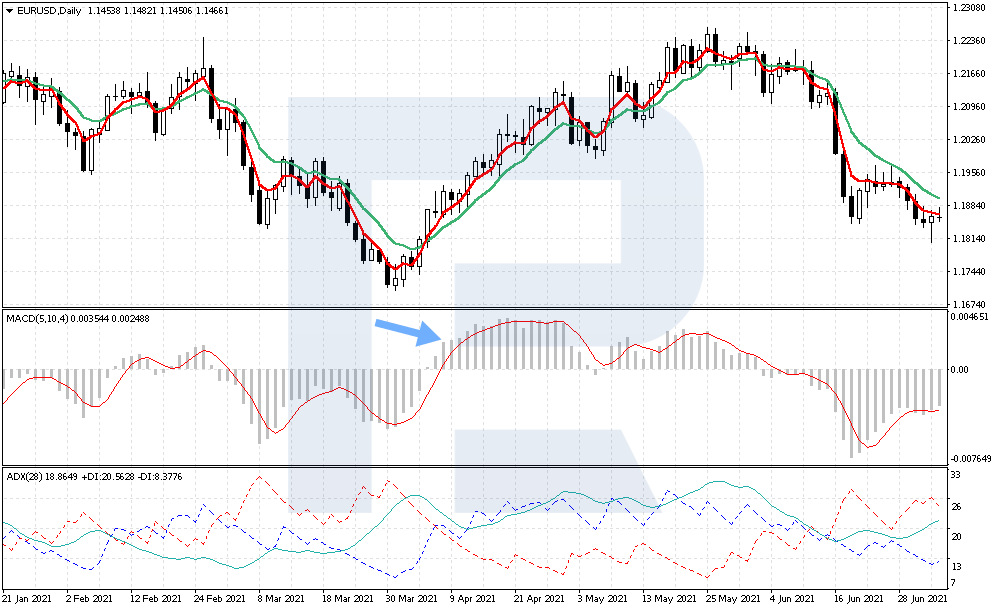
After you receive all the three signals, open your trade at 1.1915. Place an SL at 1.1845 and a TP – at 1.2115. After a small correction, the price reached the goal.
How to sell by “Follow the Trend”
Now let us discuss selling by the strategy “Follow the Trend”. Start by assessing the signals of the indicators and then open a position:
- -DI is under +DI.
- EMA (4) has crossed EMA (10) from above.
- The MACD histogram is below zero.
As soon as all the three conditions are fulfilled, go to opening a selling position.
Example of a selling trade
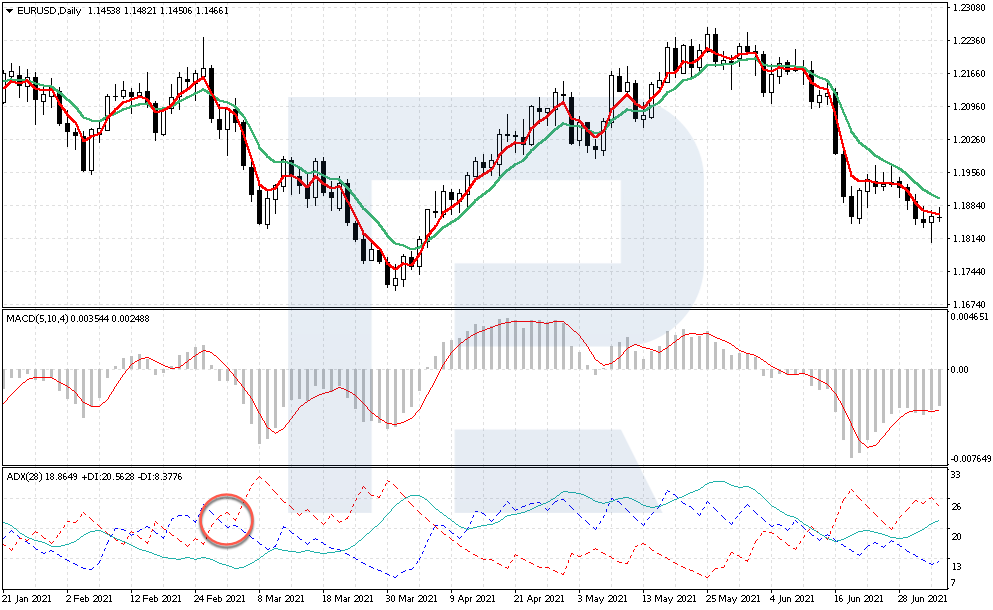
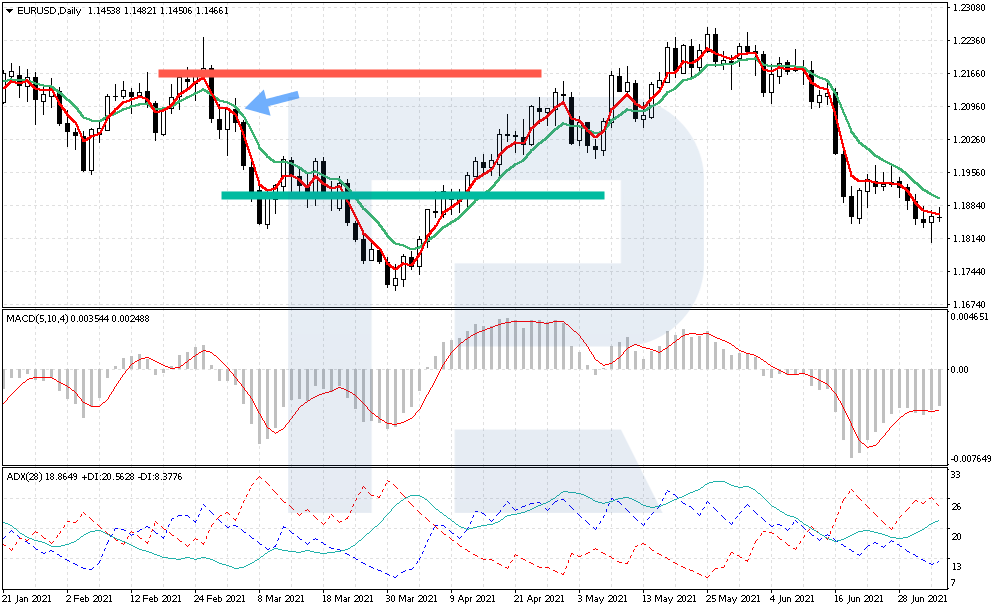
Let us have a look at an example with EUR/USD. On March 2nd, 2021, the +DI line broke the –DI line from below – this is the first signal to open a selling position.
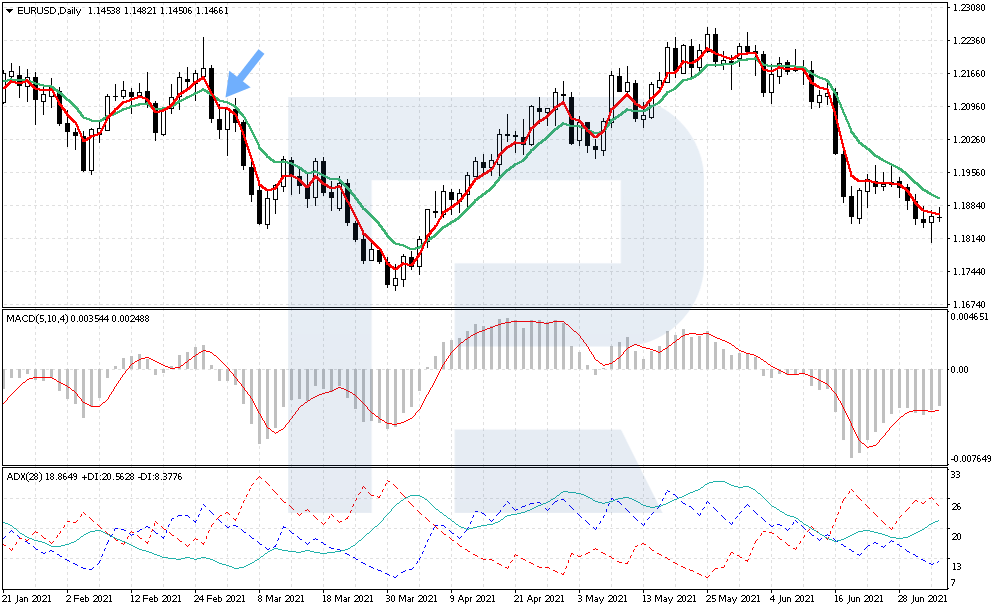
Go to the MAs: EMA (10) broke through EMA (4) from above, and this is the second signal.
Check out the MACD histogram: the values of the indicator broke through zero. This is the third and the last signal to open a selling trade at 1.2090. Place a Stop Loss at 1.2160.
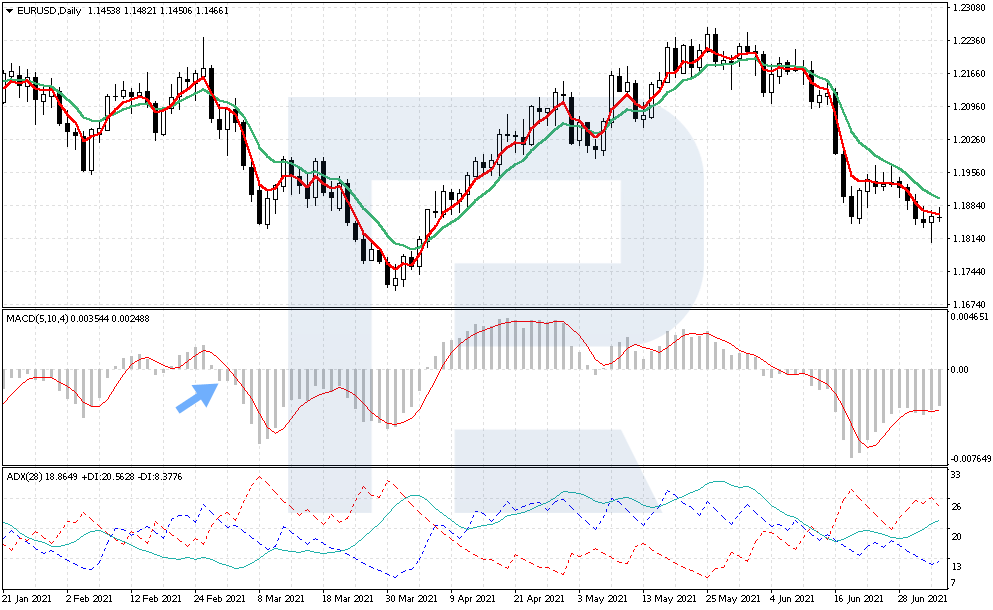
Place a Take Profit at 1.1890. In the end, the price reached the goal. However, do not hope that every trade will be profitable, so never neglect risk management.
On May 5th, 2021, there was a curious instance on the chart: the MAs crossed, advising to sell, the MACD histogram dropped under zero, while the +DI signal line on ADX remained above –DI, which indicates a bullish trend.
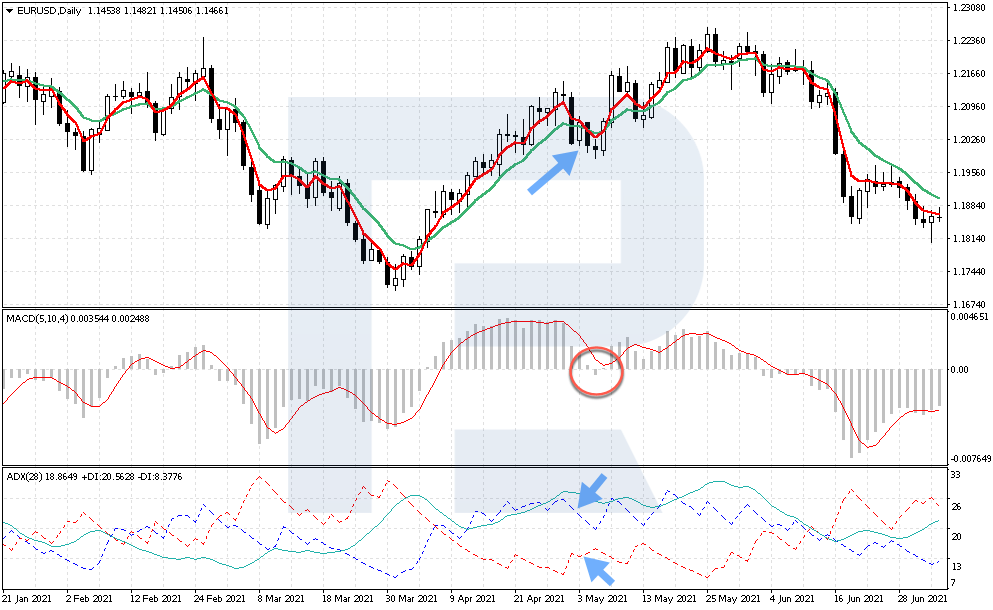
This signal should be skipped. However, if you used just the MAs, they would consider opening a selling trade, while by “Follow the Trend” such a signal must be ignored.
Closing thoughts
The “Follow the Trend” strategy uses three indicators that confirm opening a trade. All the three indicators are featured in the standard setup of most trading platforms, which means even a beginner can study the rules and use the strategy.
The advantage of the strategy is the opportunity to work on both D1 and H4. This allows choosing how frequently you want to receive signals, the size of your profit and possible losses. If you want to trade more often with smaller risks – take H4, and if you want to enter the market less often and hold your positions longer but with a larger profit – take D1 and work on it.
The authors of the strategy took care of risk management as well: they suggest using an SL three times smaller than the TP, which goes in line with the conditions of good trades in financial markets.


