How to Trade by Return to Average Strategy

5 minutes for reading
In this article, we will review a popular trading strategy called the Return to Average. The idea of this strategy is that after a serious deviation (growth or decline), the price tends to return to its average.
What is the strategy based on?
The strategy is based on a popular statistical concept Regression towards the Mean. This theory, voiced by statistician Francis Galton, states that extreme deviations are usually followed by regression to normal values. Galton supported his theory by some research of human physical characteristics.
In the world of finance, the Return to Average presumes that the price of an asset (or profitability) tends to normalize with time. When the current market price is higher than average, we expect it to fall in the future, and when it is below average, we wait for it to grow. In other words, this strategy is based on the expectation that after a certain deviation from the average the price will return to it anyway.
The concept of the Return to Average gave birth to a whole range of similar trading strategies used for all sorts of instruments. The deviation of the price from mean values is usually shown by various technical indicators.


Advantages and drawbacks of the strategy
Like any other one, the strategy of the Return to Average has its advantages and drawbacks.
The advantages are:
- the strategy works well in a flat when there is no clear up- or downtrend in the market;
- it provides a lot of trading opportunities. Normally, markets are trendy some 30% of the time, while 70% of the time it is consolidating somehow, which is perfect for the strategy;
- positions are held shortly, unlike in trend strategies.
The drawbacks are:
- when the market demonstrates a strong trend, the strategy signals against it, which might lead to losses if the trend continues without a correction and never returns to the mean;
- profit per trade is smaller than in trend strategies;
- the strategy does not account for new information that might change the long-term estimation of the instrument. For example, if a company goes bankrupt, its stocks might fall and never return to their average price.
Suitable instruments
To give signals, the Return to Average strategy uses trend indicators, oscillators, and their combinations. Such oscillators as the RSI or Stochastic help to see if the instrument is overbought or oversold. They can suggest entry levels when your trade aims at the reversal to the average.
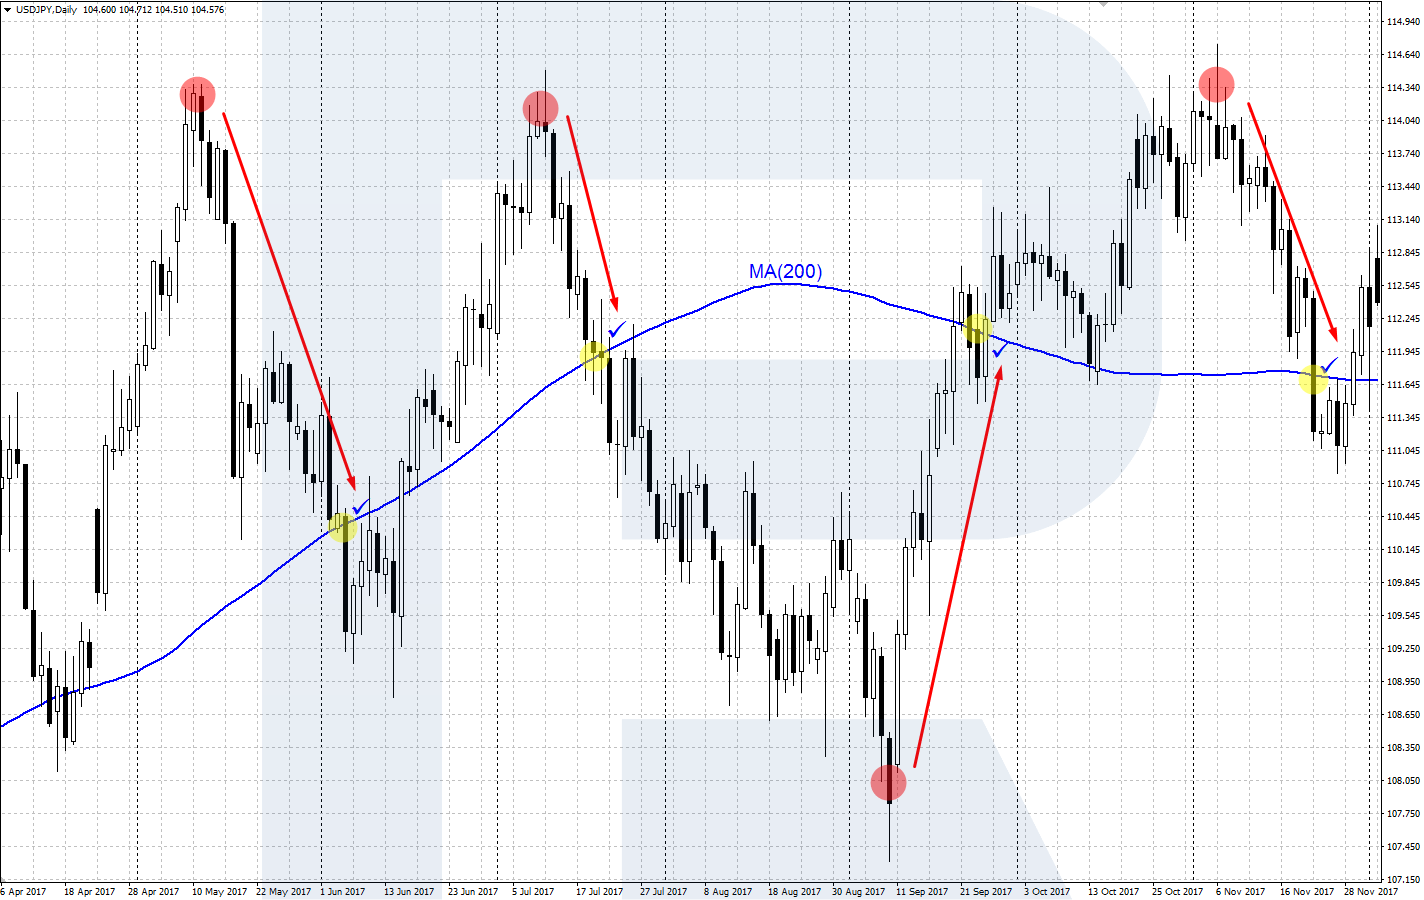
Trend indicators show the current state of the market – whether it is trendy or flat. The most popular trend indicators are various Moving Averages and complex indicators on their basis. They assess the current trend and how much the price has gone away from the average; also, they suggest levels for taking the profit. For example, the MA (200) can serve as a long-term landmark.
Examples of trading by the strategy
As I have said above, there are plenty of variants of the Return to Average strategy depending on which indicators they use. You can use a combination of simple trend indicators and oscillators or take a popular complex indicator. The examples we will discuss are based on a channel indicator called the Bollinger Bands.
The Bollinger Bands indicator appears directly on the price chart. The top and bottom lines of the indicator form a sort of a price channel, in which the price chart rests most of the time. For short-term trading by the Return to Average, you can use bounces off the upper and lower lines of the indicator that take the price back to the average line.


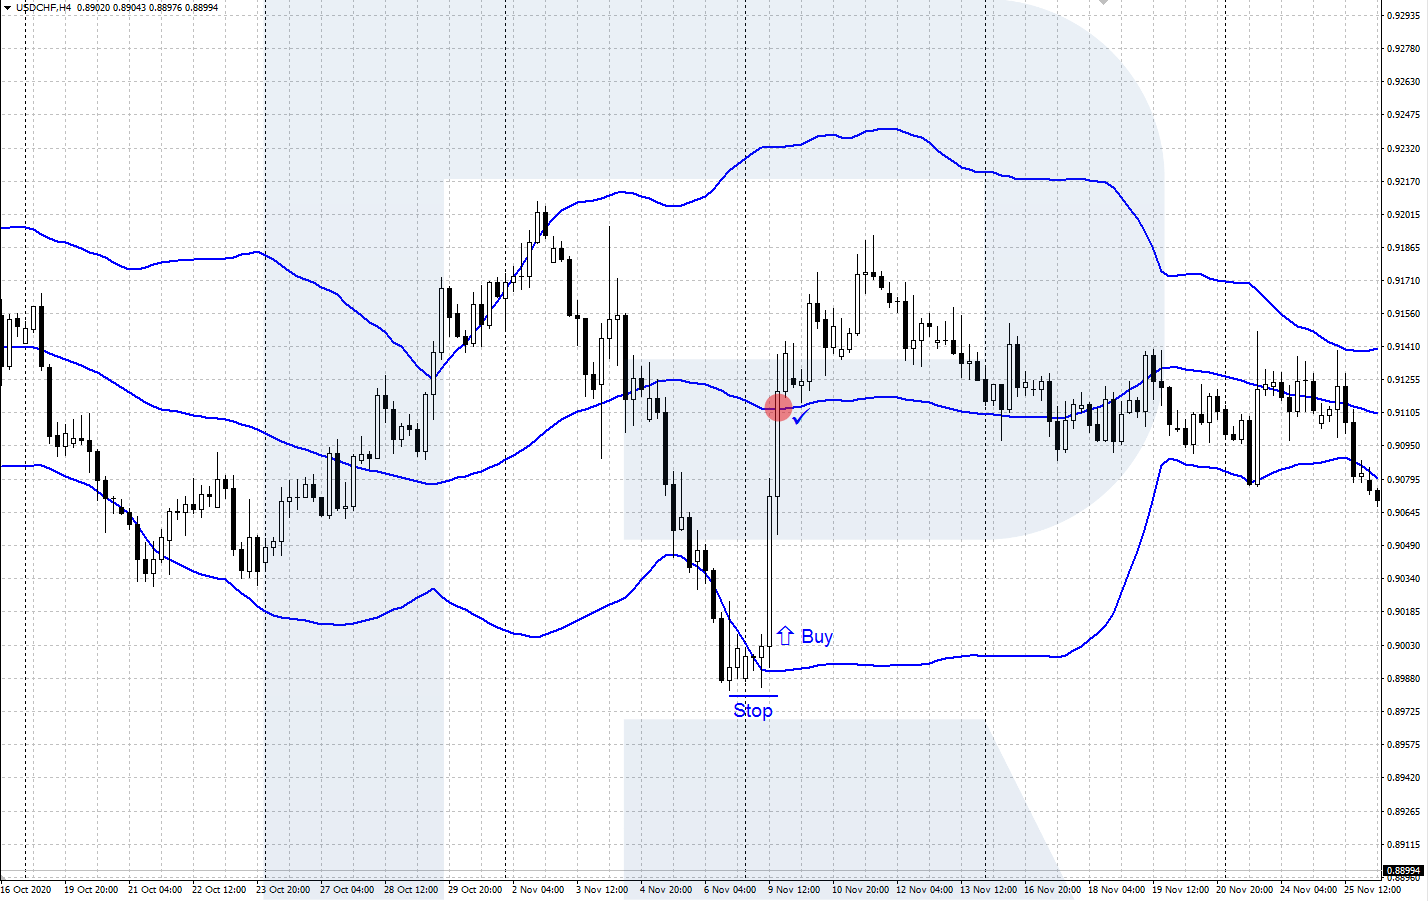
A signal to buy
- The market demonstrates a flat or a weak uptrend.
- The price drops to the lower border of the channel and bounces off it upwards. A confirmation of the bounce by a candlestick combination or Price Action pattern is desirable.
- Open a buying position, placing a Stop Loss behind the local low.
- Take the profit when the price reaches the average line of the indicator.
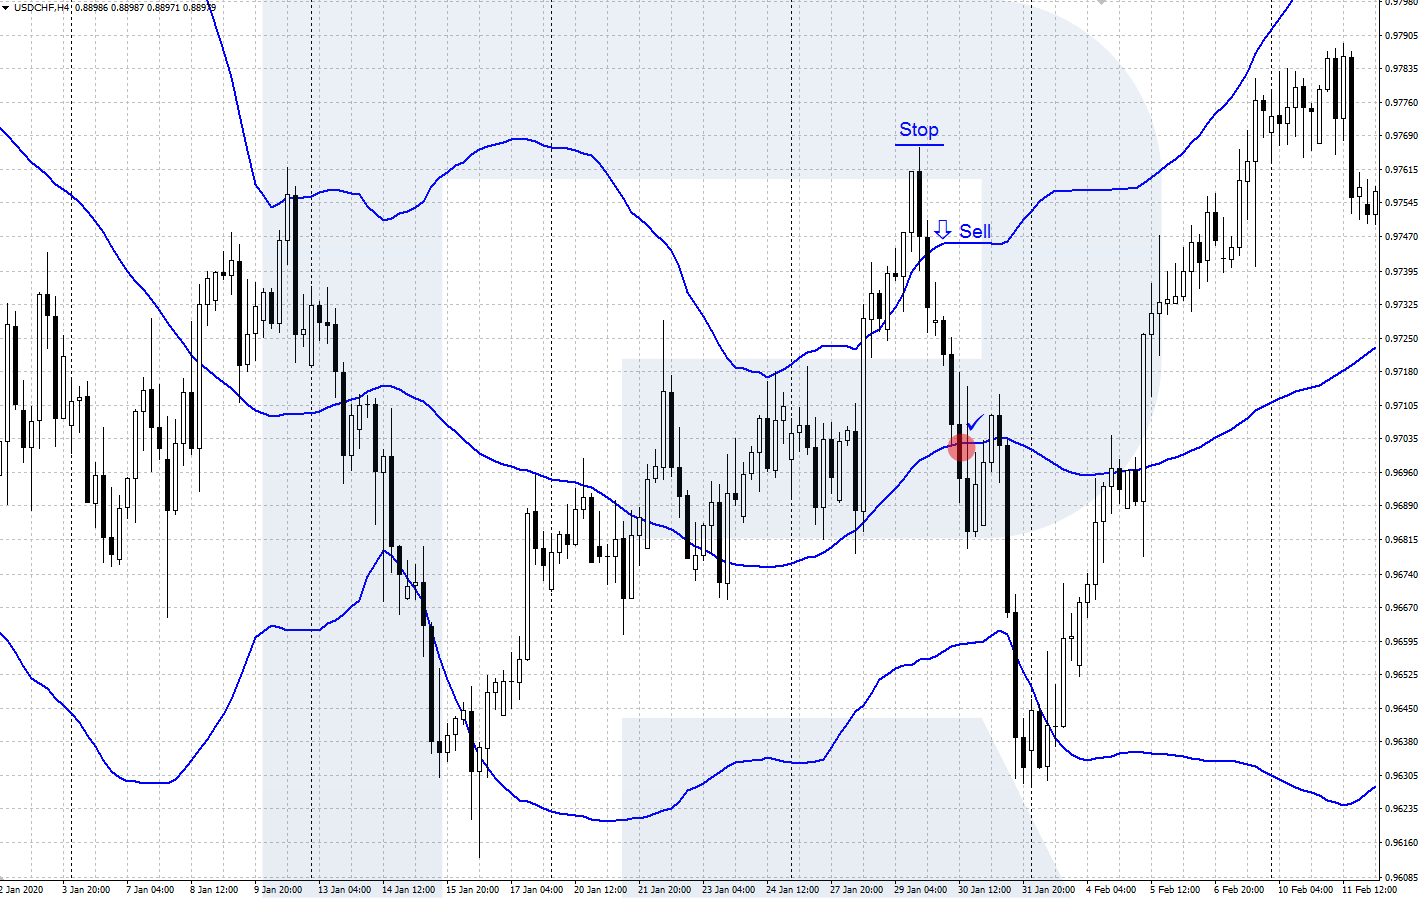
A signal to sell
- The market demonstrates a flat or a weak downtrend.
- The price rises to the upper border of the channel and bounces off it downwards. A confirmation of the bounce by a candlestick combination or Price Action pattern is desirable.
- Open a selling position, placing a Stop Loss behind the local high.
- Take the profit when the price reaches the average line of the indicator.
Bottom line
The Return to Average is a popular trading strategy based on the concept of the Regression to the Mean, or the idea that the price returns to average after some deviation. This strategy works well in times of consolidation but might entail losses in a strong trend when the price might never return to the mean.


