How to Trade Piercing Pattern and Dark Cloud Cover?

5 minutes for reading
Today the article is devoted to two patterns — the Piercing Pattern and Dark Cloud Cover — their forming and trading principles.
How do the patterns form?
The Piercing Pattern and Dark Cloud Cover are reversal candlestick patterns that predict a correction or reversal of the current trade
These patterns consist of two candlesticks each and mirror each other. The Piercing Pattern forms at the lows of the chart and forecasts a reversal upwards. The Dark Cloud Cover appears at the highs and warns of a decline beginning.
Speaking metaphorically, the emergency of the Dark Cloud Cover in a growing market shows that the bulls are stuck in a serious obstacle, and if they fail to overcome it, a downward correction will follow. And vice versa: if after a market decline the Piercing Pattern appears, the bears are losing the grip, and the bulls are optimistic about an upward reversal.
Dark Cloud Cover
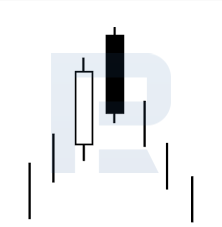
Japanese traders state that this pattern in the chart gives little chance for further growth. The pattern consists of two candlesticks, a white and a black ones.
At the white candlestick, the market is growing actively, and a new local high is set. Thanks to the optimism and the pressure applied by buyers, the next trading session opens with a gap upwards. But then the market falls, and the black candlestick closes in the middle of the body of the white one or even lower.
As a result, the optimism of the bulls reflected in the white candlestick gets fully destroyed by the black candlestick. The bears have managed to recover, stop the bulls, and are ready to fight back.
The farther the closing price of the black candlestick reaches behind the preceding white one, the stronger this signal is considered. The signal can be canceled by the growth of the price above the high of the pattern.
Piercing Pattern
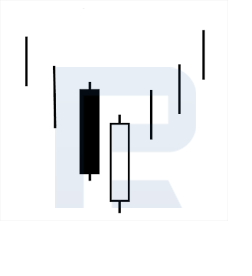
This pattern is quite opposite to the previous one: it appears on the market lows in a downtrend. It also consists of a white and black candlesticks. In a descending movement, a strong black candlestick forms, renewing local lows. The next trading session, propelled by sales, opens with a gap downwards, but then the market starts recovering and closes with a strong white candlestick in the midst of the body of the black candlestick or higher.
Thus, the bears fail to secure at the reached lows, and the bulls are ready to attack, which might end up in a correction or even a trend reversal.
The higher the body of the white candlestick closes, the stronger this signal to buy is. After this pattern appears on the chart, the price going above the high of the white candlestick tells us to buy. The signal can be cancelled by falling of the quotations below the low of the pattern.
Trading by the patterns
As long as this patterns are reversal ones, they are to be looked for on local lows and highs. In flats, the patterns can be used if they form at a bounce off the borders of a local range.
I recommend larger timeframes, from H4 and larger; almost all liquid assets will do: stocks, futures, currency pairs.
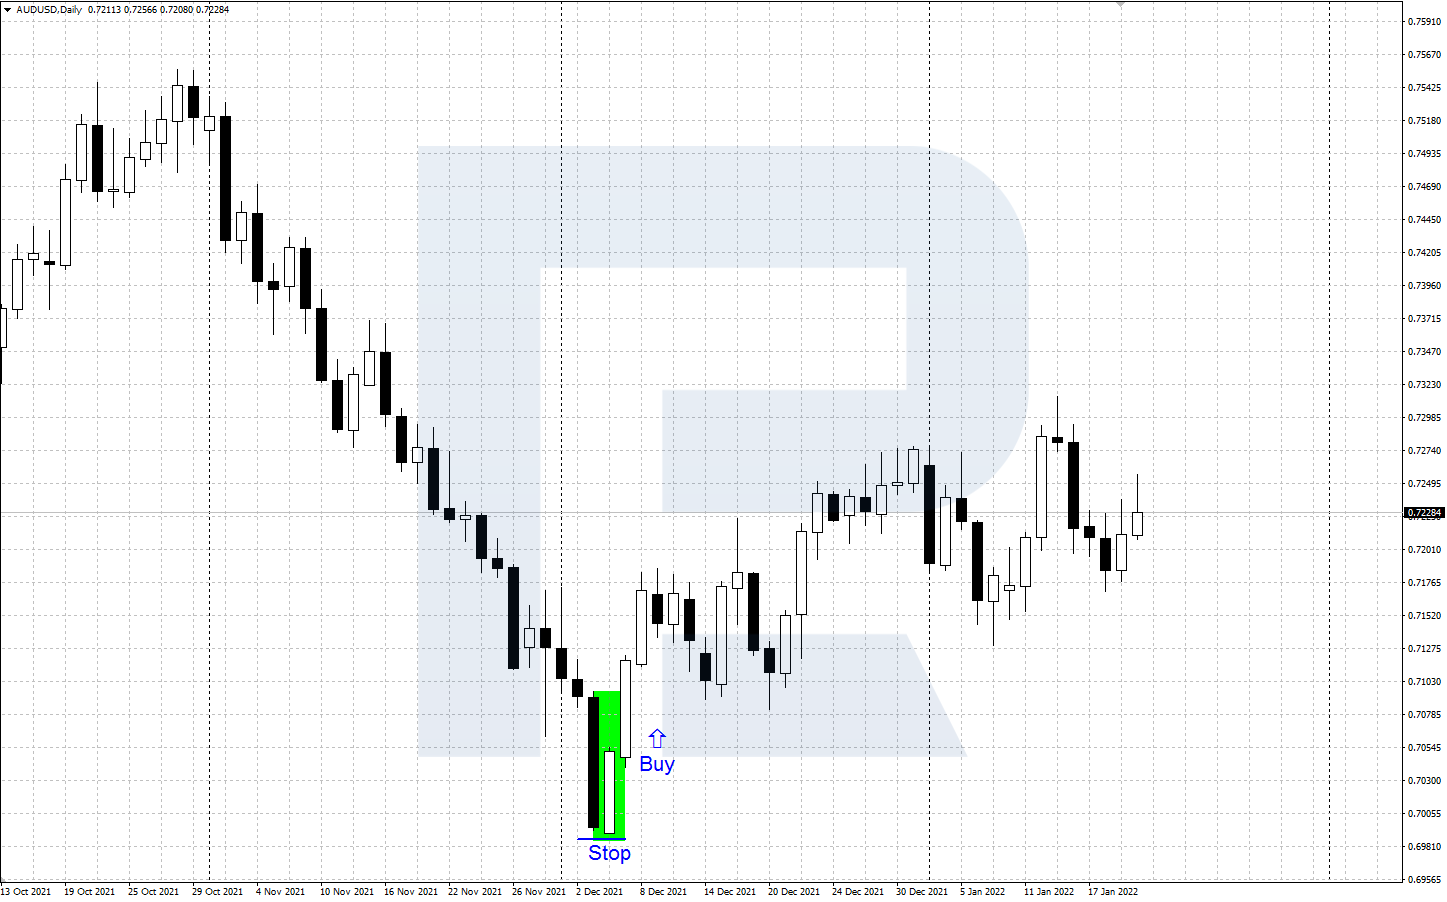
Piercing Pattern: buying
- In a downtrend, a reversal candlestick Piercing Pattern forms at the lows of the chart.
- After the white candlestick closes confidently and the quotations grow above its high, open a buying position.
- Place a Stop Loss a bit lower than the low of the pattern. Take your Profit at important resistant levels or Fibonacci correction lines.
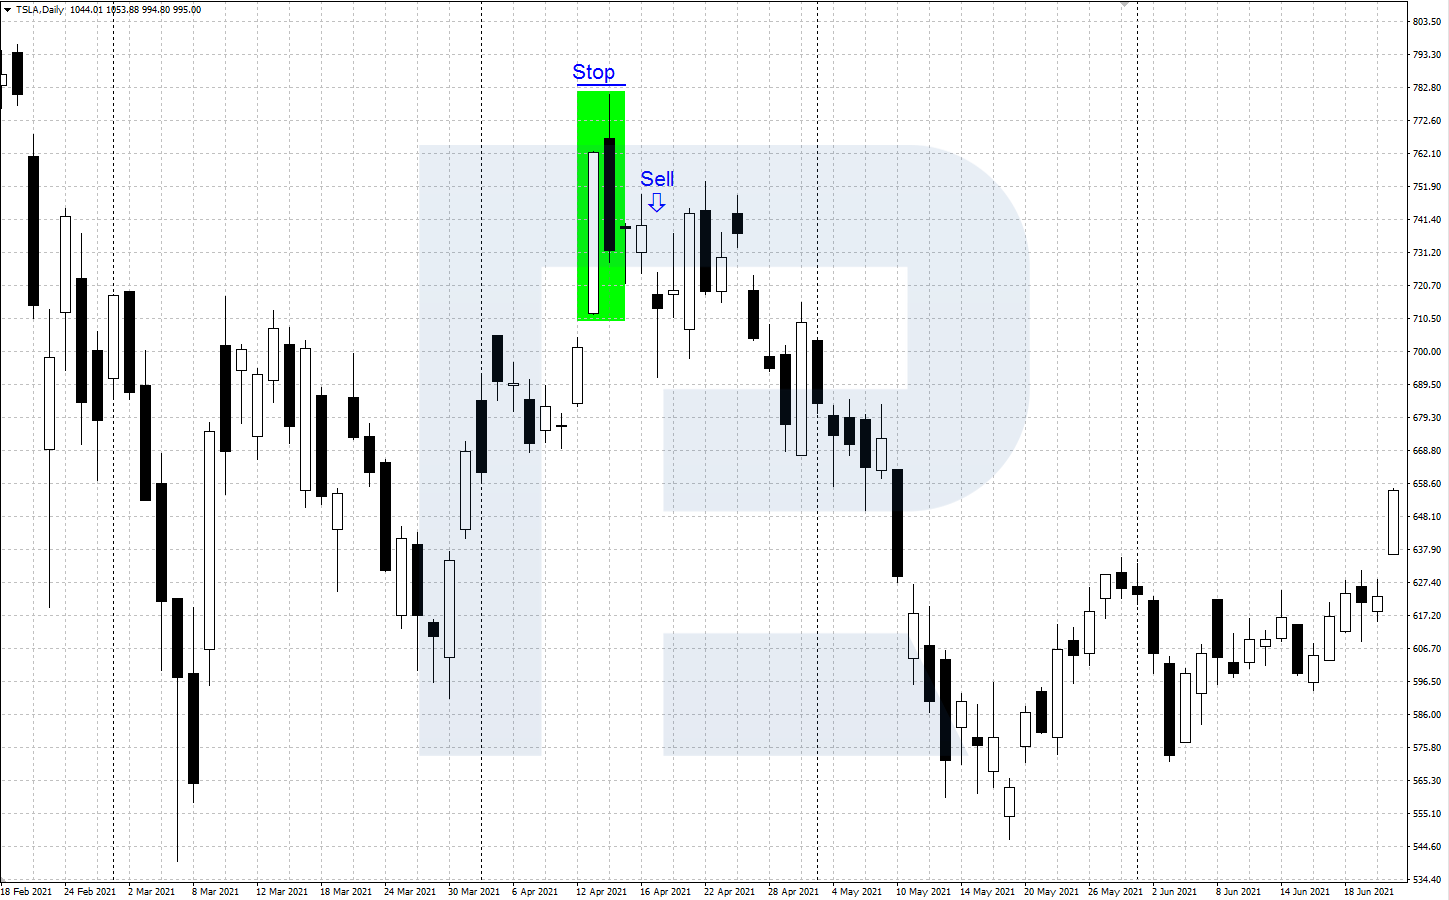
Dark Clouds Cover: selling
- In an uptrend, a reversal candlestick pattern Dark Clouds Cover forms at the highs of the chart.
- After the pattern is complete, and the quotations go below the low of the black candlestick, open a selling trade.
- Place an SL above the high of the pattern. Take your Profit at important support levels or Fibonacci lines.
Trading advice
Trading by these patterns, keep in mind the following:
- In the stock or futures markets, the second candlestick must open with a gap above/below the closing price (depending on the pattern) or above/below the high/low of the first candlestick.
- In Forex, because it works 24h a day, gaps are rare, so the patterns can be used without them.
- If the body of the second candlestick confidently covers more than a half of the body of the first one, this is a strong signal. If it covers less than a half, the signal is weak.
- In a flat, you can use these patterns to trade bounces off the borders of the range.
- Confirming signals from tech analysis and indicators will enhance the signals of the patterns.
Closing thoughts
The Piercing Pattern and Dark Cloud Cover form in a downtrend or an uptrend, respectively. They predict a reversal of the current trend.
Trading by these patterns can be augmented by tech analysis and indicators. In more details, this trading is described in a book called “Beyond Candlesticks: New Japanese Charting Techniques Revealed” by Steve Nison.
You can read more about trading patterns in our blog.


