How to Trade USD/ZAR
6 minutes for reading
USD/ZAR — US dollar vs South African rand — is quite an exotic currency pair, not really popular among traders. Trading this asset has certain peculiarities and internal laws.
Some say that, compared to other pairs, this one is less liquid. However, on the D1 of USD/ZAR one could see a lengthy uptrend from the end of 2011 till the beginning of 2016. That time the quotations rose from 6.40 to 17.97, then declined several times in the form of corrections, and then started growing again.
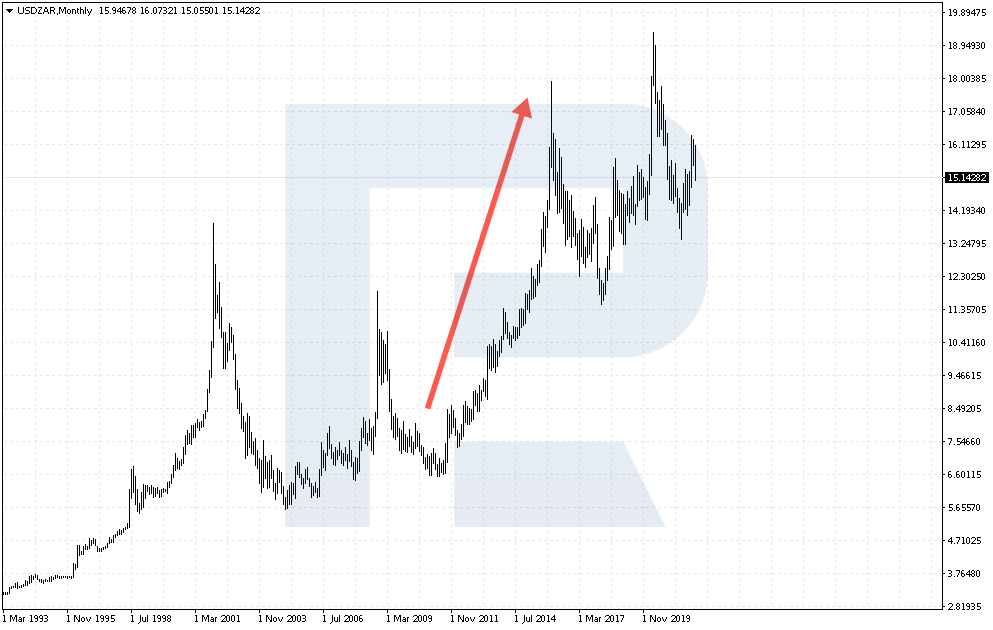
At the very first glance you can see that USD/ZAR is capable of strong movements. And not only ascending ones that prevail but also lengthy declines. Do you want to know right now how to trade this currency pair, making use of all its characteristics? Let me tell you.
Main info about the rand
South Africa got its national currency is 1961 instead of the South African pound. At that time, 1rand cost 1.4 USD. However, in 1982 already sanctions imposed on South Africa made the exchange rate fall to 1 USD.
Subsequent economic recovery was short-term and prevented the national currency from returning to previous levels. New political turmoil that started in the 1990s made the rate fall deeper down.
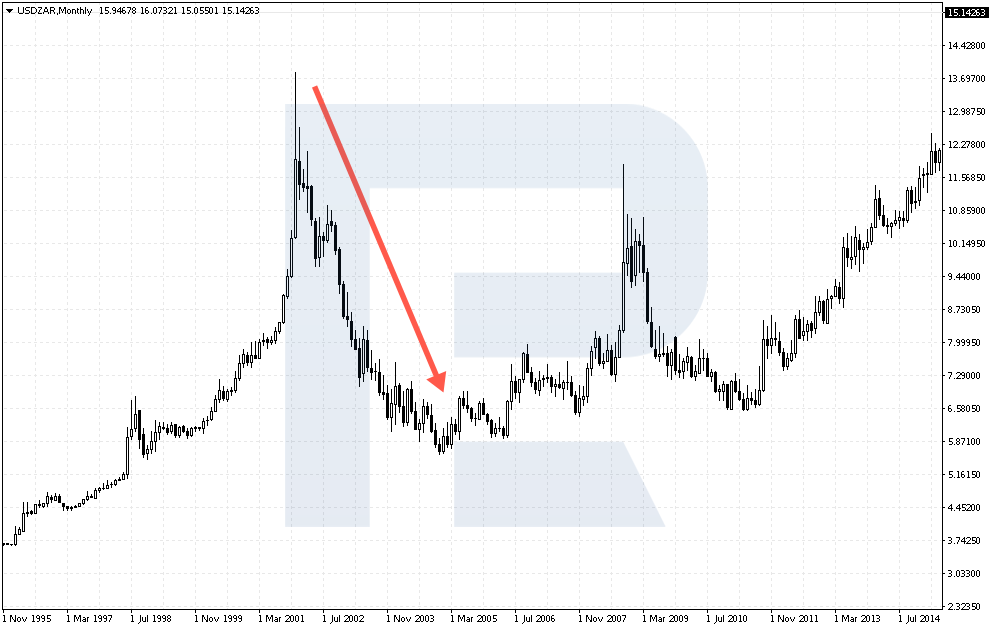
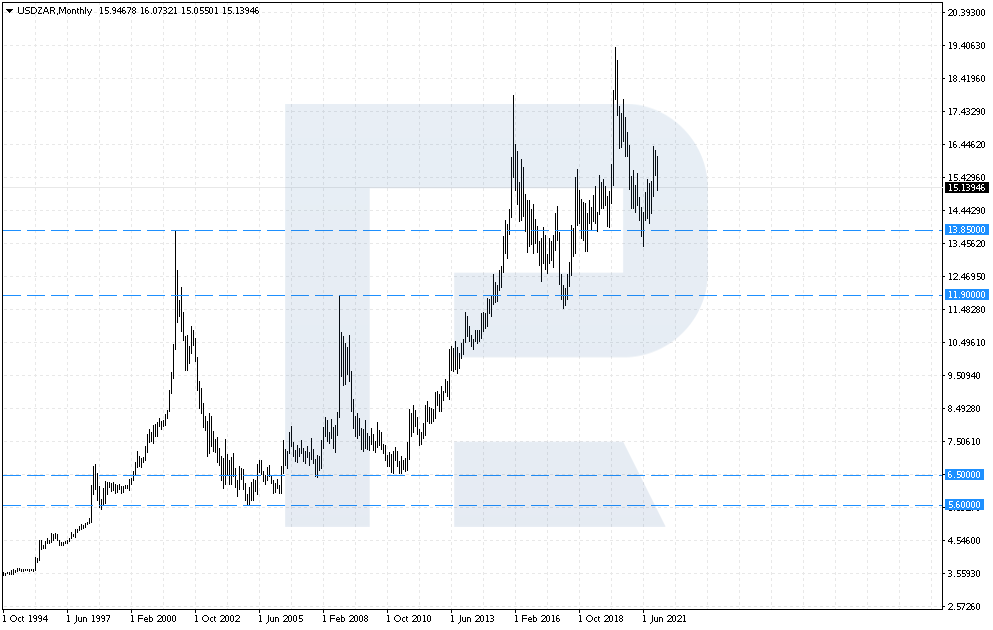
The economy recovered in 2001. At that time, the rate shrunk from 13.85 to 5.60 in over 3 years. However, the slow-down of the economy of China, which is the main trade partner of South Africa, pushed the rate of rand down to 11.90 by the end of 2008.
In 2015, USD/ZAR renewed the highs of 2001 and remains above these levels.
The trend remains bullish for the USD, and a serious support level is between 13.85 and 11.90. Sellers have not yet managed to break through this area. A decline below 11.50 might send the pair to the lows of 6.50 and 5.60.
Economic characteristics
In South Africa, the income is above average, and the economy of the country makes up for about 25% of the GDP of the whole continent. However, certain problems are hindering its development, such as poor education levels, high unemployment and crime rates, uneven spreading of income in the population, electricity problems.
The key sectors of economy are mining, food, and car industries, agriculture, fishing, retailing and wholesale, and tourism. The driver of the economy is gold and diamond mining.
Political unrest alongside increasing unemployment and crime rates deteriorate the economic situation in the country and make the national currency retreat. Foreign investors lose interest in the rand and prefer investing in less risky assets.
The South African rand is a commodity currency, so its rate depends heavily on commodity prices.
Trading characteristics of the currency pair
The pair reflects the relation of the US dollar to the South African rand. When I was preparing this article, you could buy a bit more than 15 ZAR for 1 USD. The growth of the pair means that the dollar is becoming stronger, and falling means that the rand is growing.
Trading characteristics:
- Trading time. The pair trades 24 hours a day on weekdays. Volatile movements take place during the European session.
- Volatility. Assessed by the ATR, it reaches 230 points a day on average. Minimal ATR levels were reached in the middle of 2021 and maximal — in July 2020. The difference is quite noticeable — the low was 180 points and the high was 380 points, all these during one year.
- Spread. It is quite low, reaching about 0.8 points at the calm market.
Which factors influence the quotations
- Decisions of the South African Reserve Bank on the interest rate
- South African CPI
- Trade balance of the country
- Absa PMI in industry
- Markit PMI
- Production levels in South African manufacturing
How to trade USD/ZAR
The currency pair can be traded by indicators, levels, and graphic patterns.
Trading by indicators
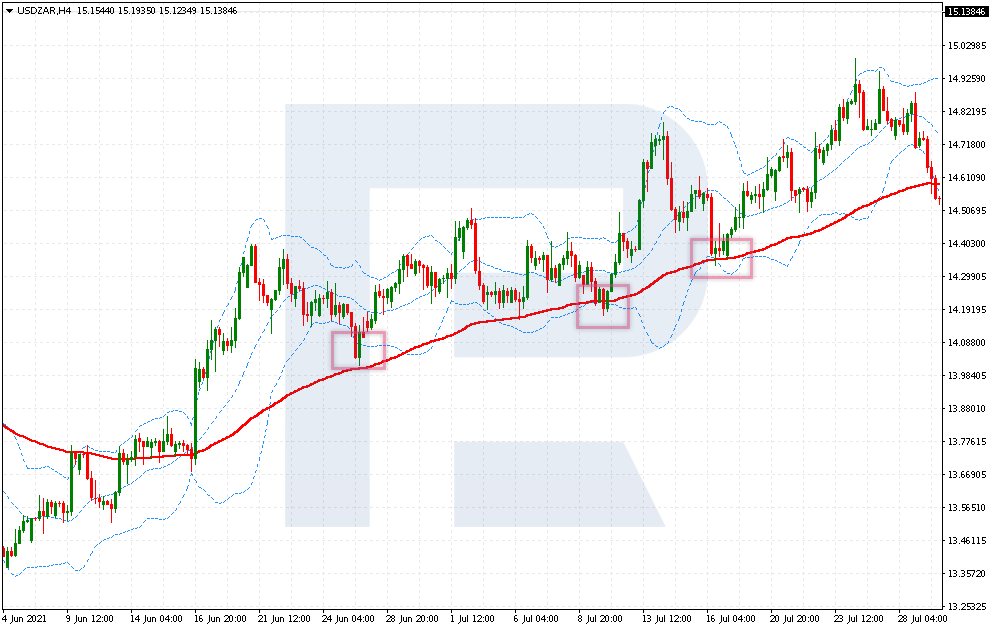
The pair is trendy, so a combination of Moving Averages will yield good results. You can choose tactics from the article “Top-7 Forex Trading Strategies in 2022” If you want something unique, add to the chart an EMA (95) and Bollinger Bands. Use an H4 chart.
Buying rules
- The price has secured above EMA (95) – this indicates a bullish trend.
- The price tests the lower border of the Bollinger Bands indicator that shows the lows.
- Place a Take Profit at the upper border of Bollinger Bands.
- The Stop Loss will be two times smaller than the TP.
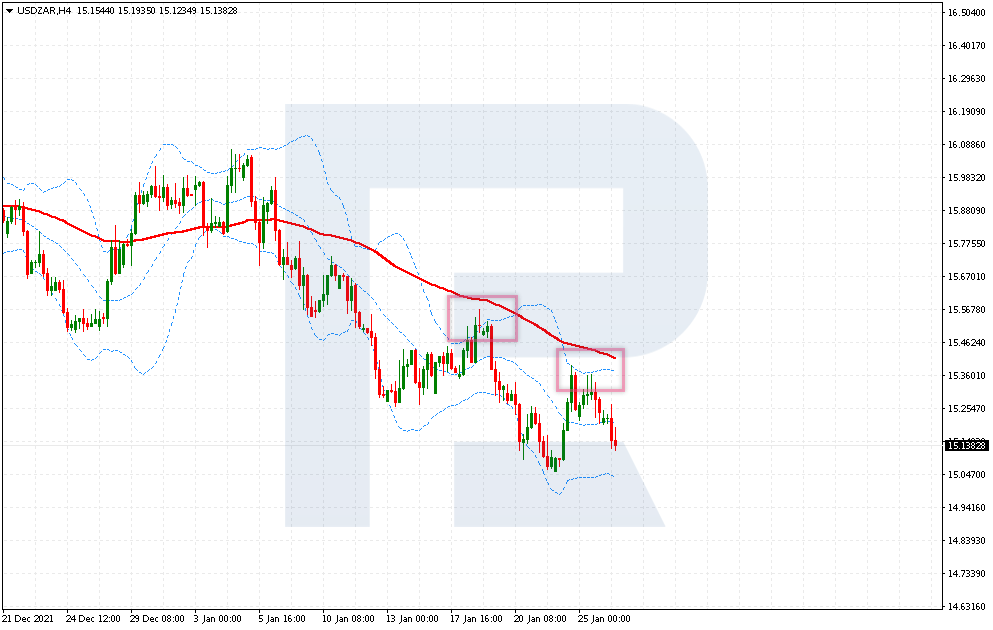
Selling rules
- The price has secured below EMA (95) – this indicates a bearish trend.
- The price tests the upper border of the Bollinger Bands indicator that shows the highs.
- Place a Take Profit at the lower border of Bollinger Bands.
- The Stop Loss will be two times smaller than the TP.
Trading by levels
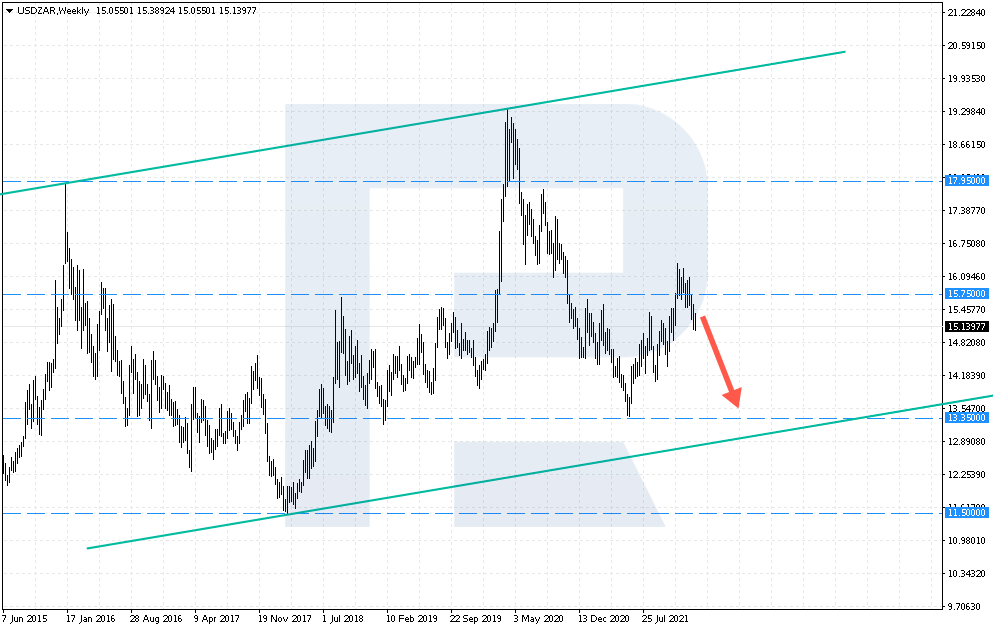
On MN, you can see the nearest support and resistance levels. For example, the price pushes off the resistance level at 15.75, while the support level is at 13.30. In the nearest future, the USD/ZAR quotations are likely to aim at this area. To trade intraday, switch to smaller timeframes and draw the levels there.
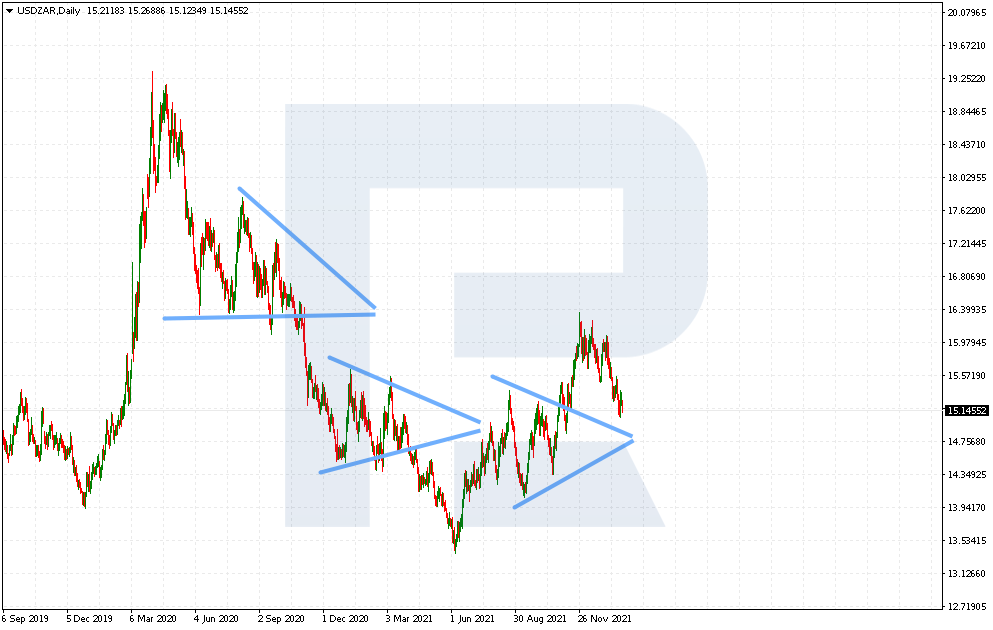
Trading by graphic patterns
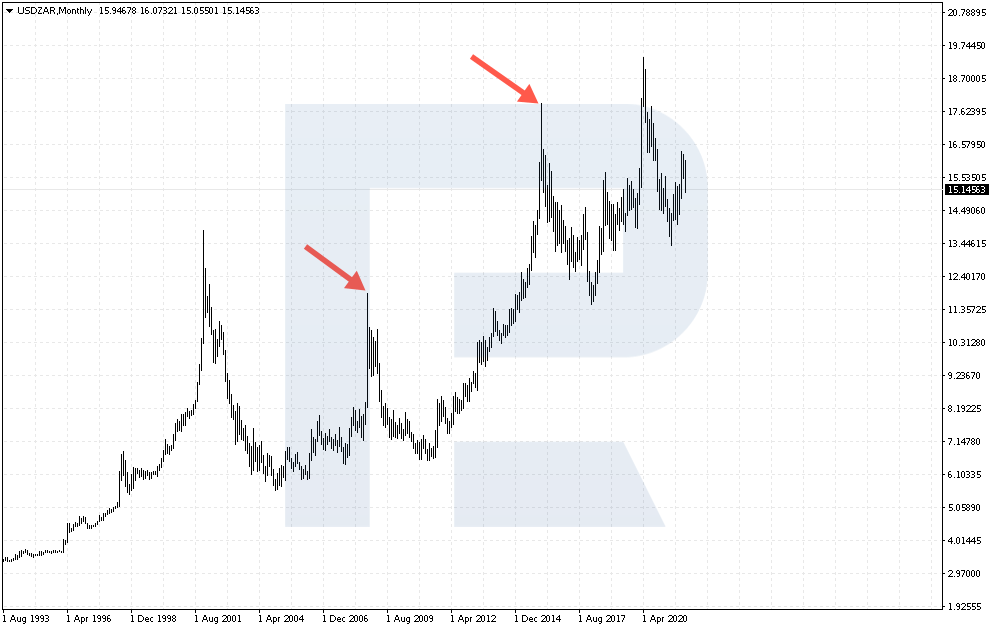
The instrument is trendy, so the most frequent price pattern to encounter is the Triangle. The chart has gone through three Triangles over just a year. To work intraday, this pattern on H1 will be enough.
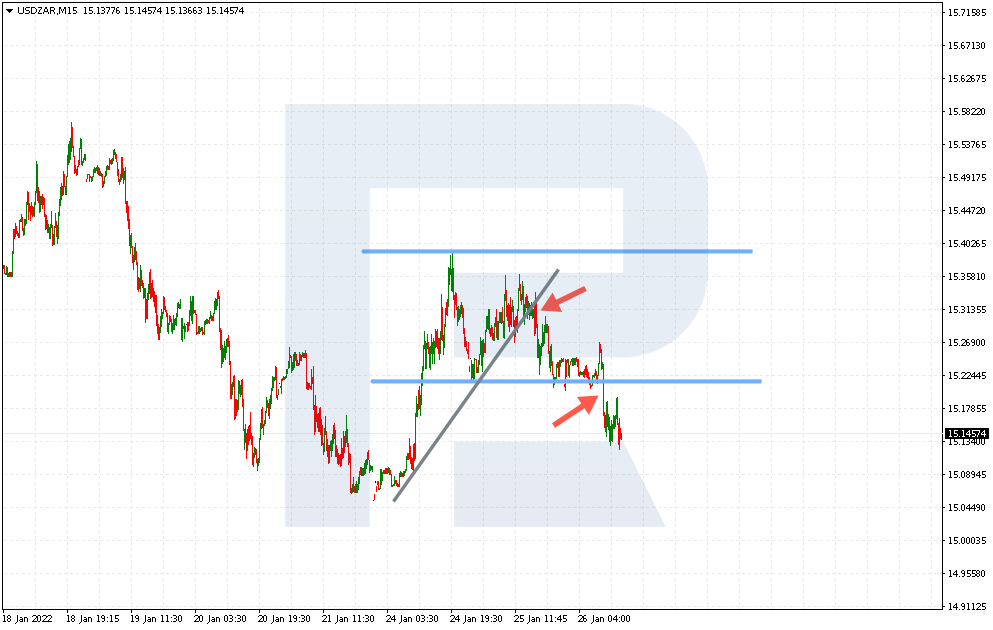
For example, the latest decline of the pair from 15.30 happened by the Double Top pattern. As you can see, after the second test of the resistance level, the quotations went down. The signal to decline is a breakaway of the trendline or the low of the pattern.
Bottom line
USD/ZAR is an exotic currency pair with high volatility. Movements can exceed 300 points over a trading day. Regardless of this, spreads remain minimal in the calm market.
To trade this instrument, you can use trend strategies and tactics based on graphic analysis – horizontal levels and patterns. Get acquainted with this pair on a demo account and switch to a real one after you master all nuances and details.


