Best Long-Term Trading Strategies: “Daily Breakout and Moving Average”

7 minutes for reading
Almost any trend strategy uses Moving Averages as they help traders to quickly define the trend. However, the tactics named “Daily Breakout and Moving Average” works differently.
According to this strategy, a trader will trade against the direction of Moving Averages. In order to do that, they will have to follow quite unusual rules of using Moving Averages.
If Moving Averages show a bullish trend, then a trader should look for a signal to sell. If Moving averages show a bearish trend – vice versa, a trader should look for a signal to buy. It turns out to be some kind of a countertrend strategy.
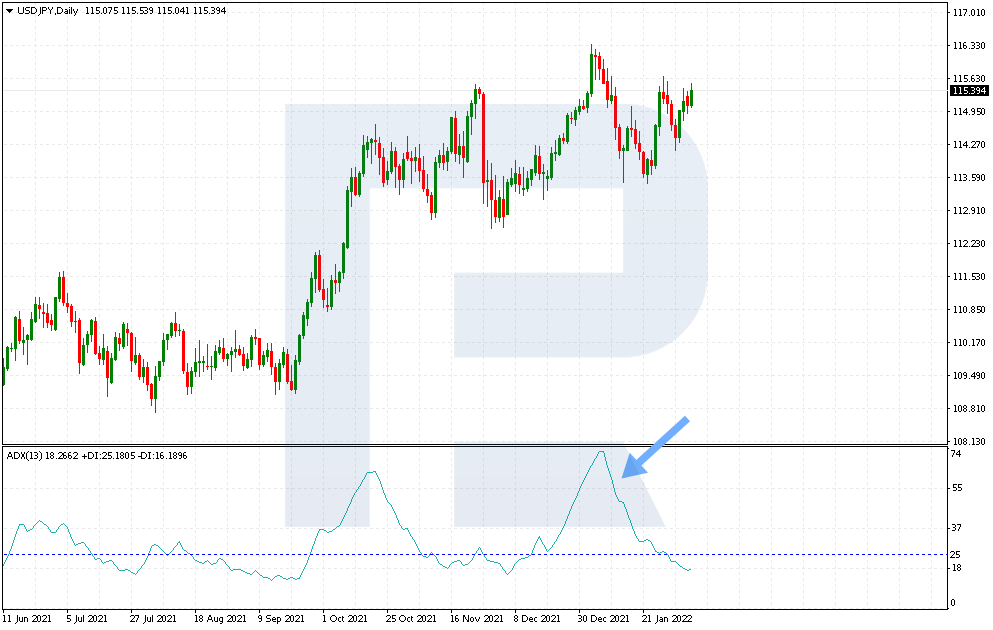
More to that, the ADX indicator is usually added here to get a confirmation to enter the market. This combination of indicators allows to “catch” the completion of the current tendency ahead of time.
Authors of the strategy believe that it can be used for working with any instrument but only on a daily timeframe.
The article goes into the details of the “Daily Breakout and Moving Average” strategy – we’ll discuss how to trade against the dominating tendency and try to “catch” a breakout using simple indicators.


How to customise indicators to trade by the strategy
To use the strategy, you need to apply three indicators to a daily time frame.
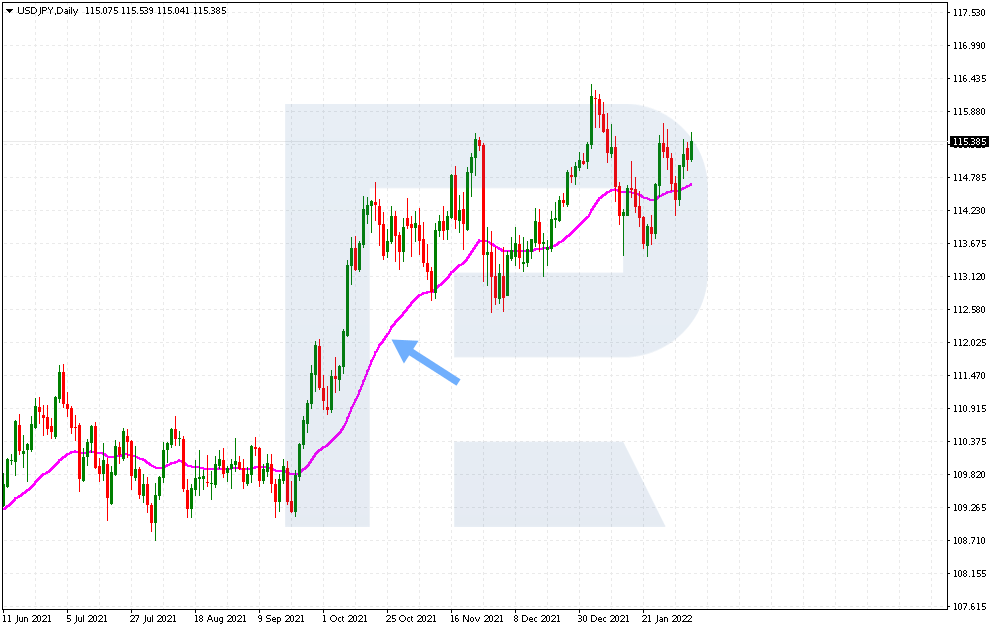
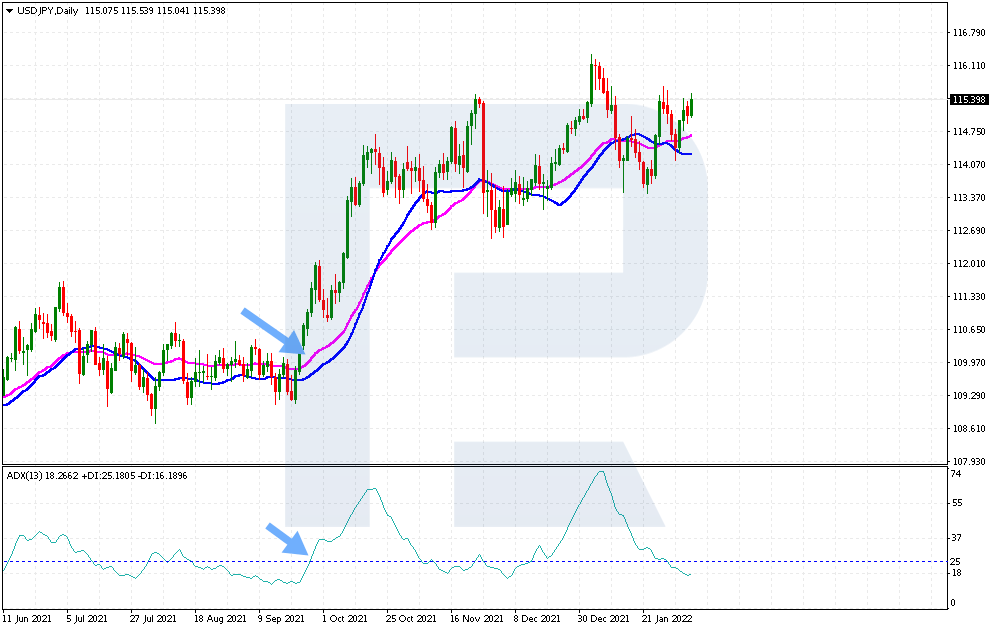
1. Simple Moving Average (SMA) with a period of 20, building at the lowest prices and choosing Low. An arithmetical average that uses the lowest prices over the period instead of the closing prices.
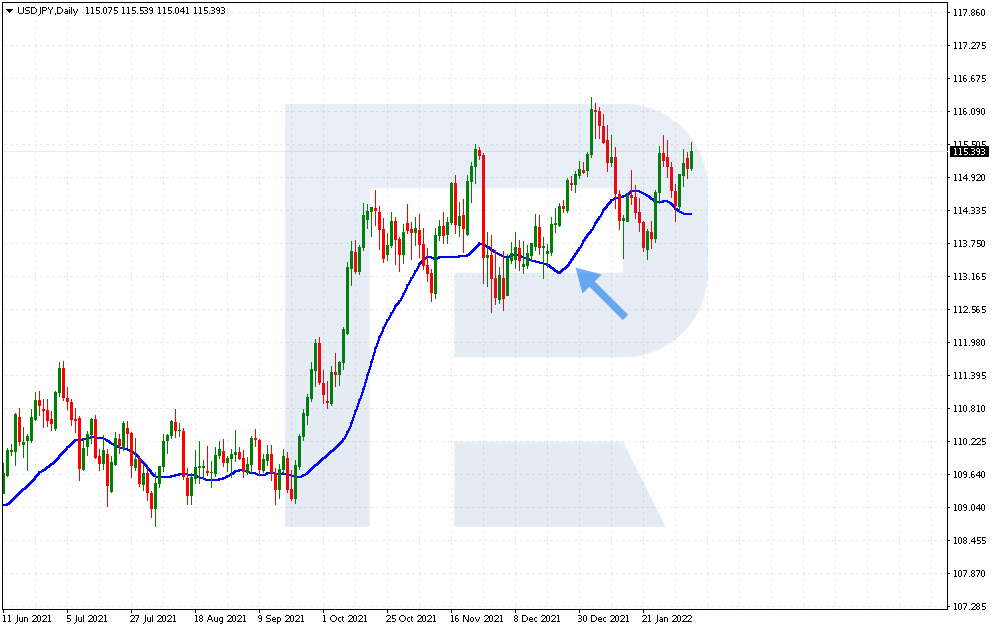
2. Exponential Moving Average (EMA) with a period of 34. Exponential Moving Average differs from Simple Moving Average because it pays more attention to the latest data. This is the most popular Moving Average with traders.
3. ADX with a period of 13. A faster period than a more frequently used period of 14. The signal formation requires a level of 25 on the indicator chart. You can delete extra lines in settings, leaving only the key line and the specified level.


How to buy by “Daily Breakout and Moving Average”
After adding indicators, a trader needs to assess the behaviour of each of them to find signals to open a position. Let’s take a closer look at how to buy by the strategy:
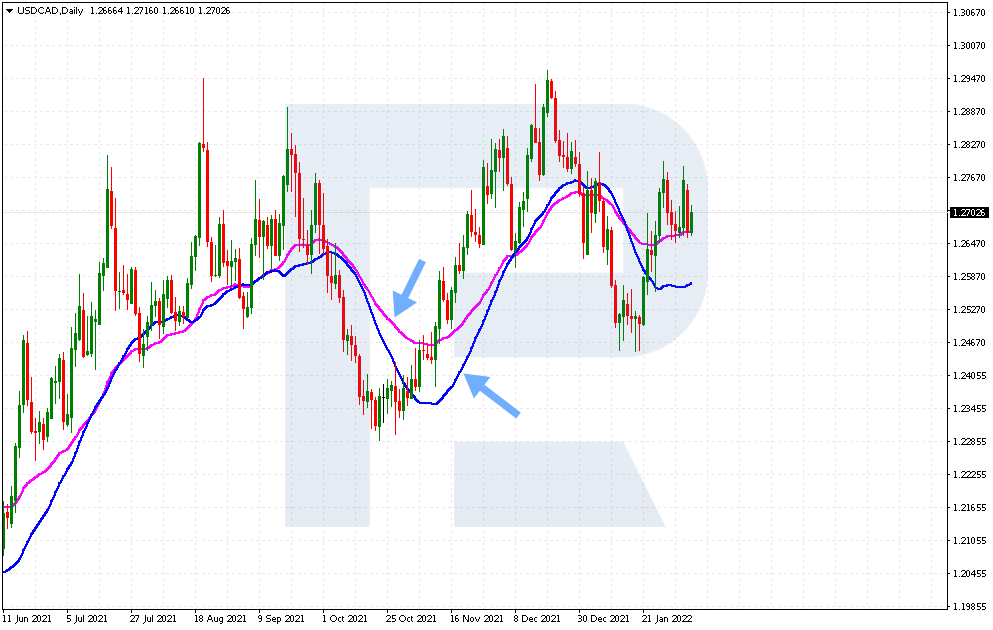
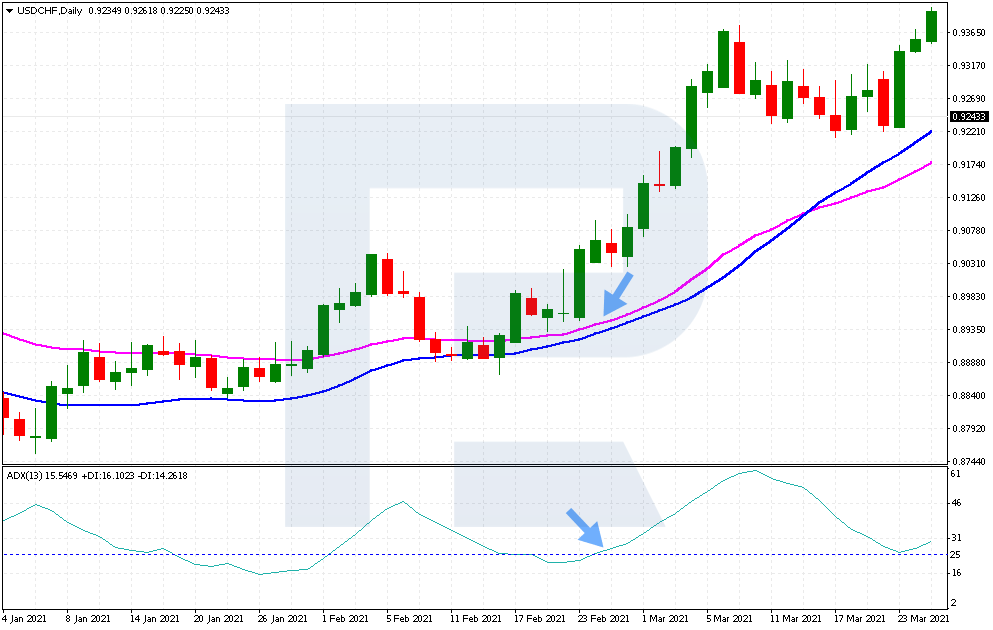
- The EMA 34 line is above the SMA 20 line. Pay attention that the trend is descending.
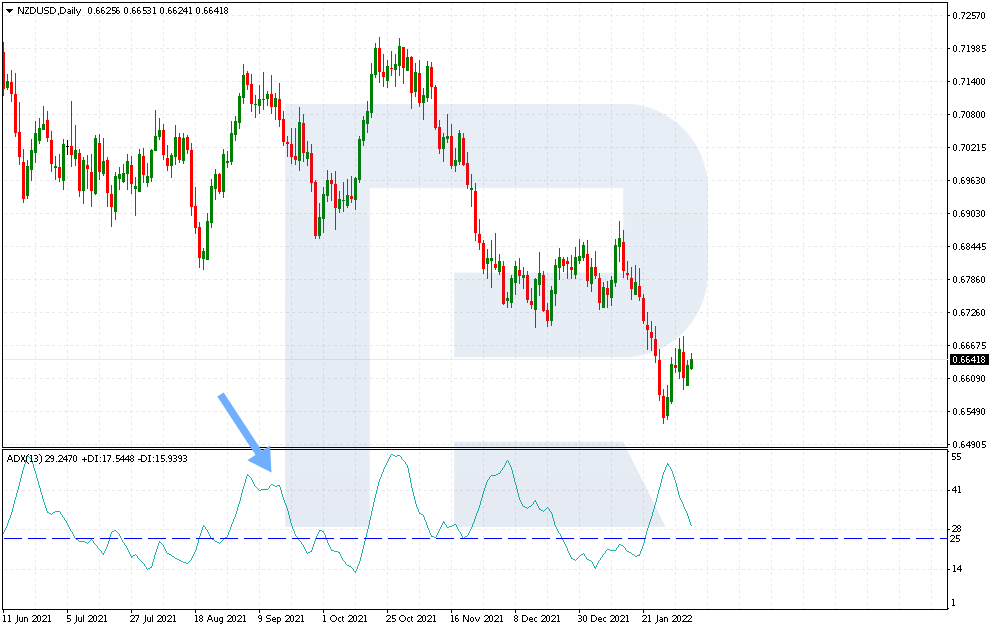
- The ADX indicator broke 25 and moved higher.
Methods to exit a long position:
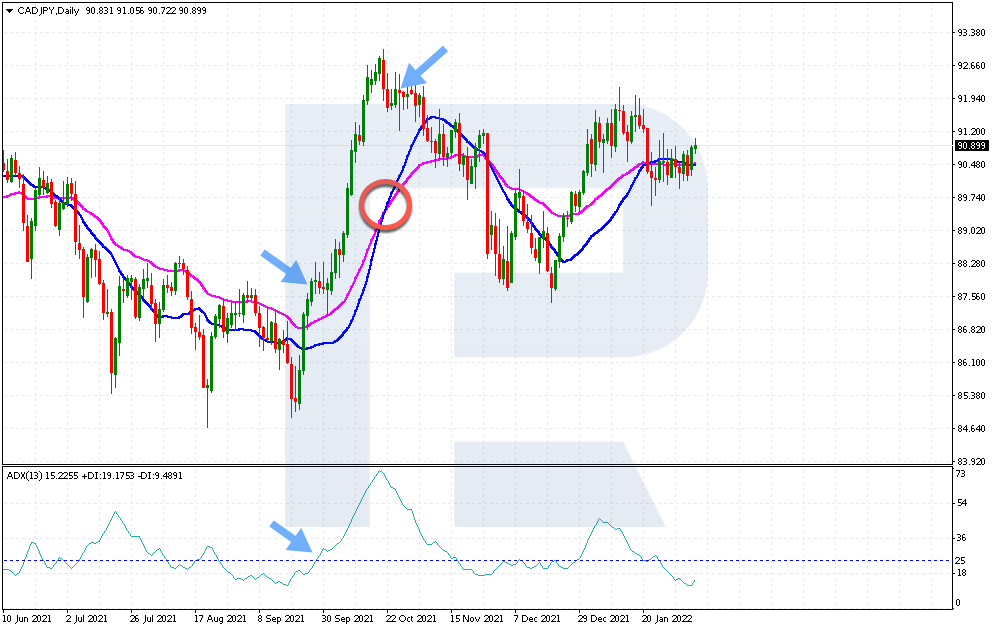
1. A trader closes a position when Moving Averages intersect. We wait for the SMA 20 lines to cross the EMA 34 line from the bottom upwards.
The advantage of this method is that a trader doesn’t take profit too early but only after getting a signal from Moving Averages. That’s why the potential profit from this deal may be much bigger than from fixed levels. The Stop Loss order size is 30–50 pips.
2. An alternative method is placing fixed take profit and stop loss levels regardless of the intersection of Moving Averages. The Take Profit order is placed 100-150 pips away from the entry point. The Stop Loss order size is 30–50 pips.
The disadvantage of this method is the strict take profit level, which prevents a trader from making 200 or 300 pips on a deal. The size will always be the same regardless of how the market behaves. However, this profit size matches the average price fluctuation during the day.
An example of buying by “Daily Breakout and Moving Average”
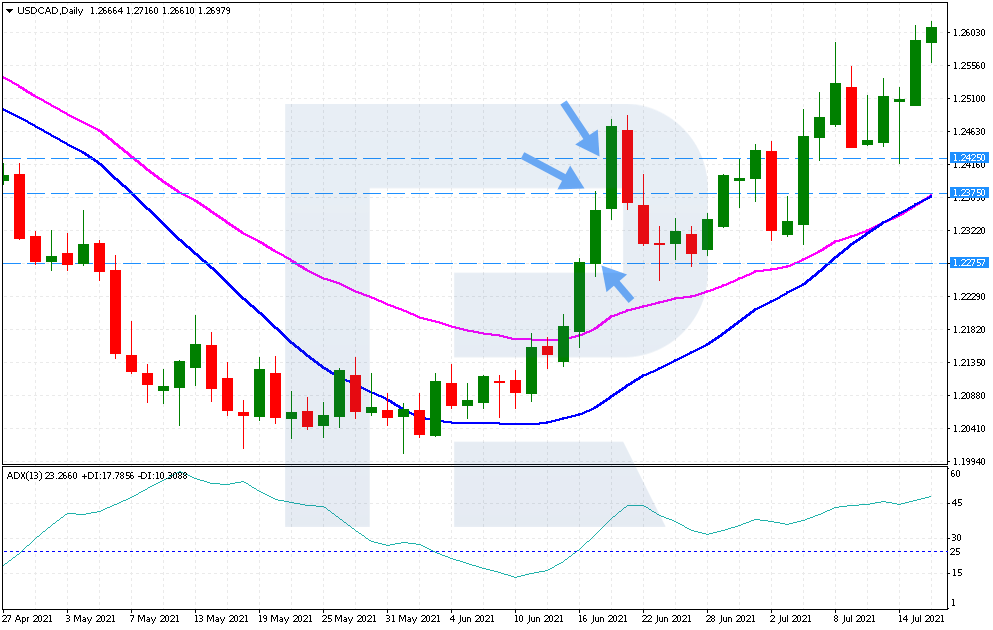
In the example, let’s take a look at the USD/CHF chart for 24 February 2021. First of all, we assess the position of Moving Averages. The EMA 34 line is moving above the SMA 20 line. That’s the first signal to open a long position.
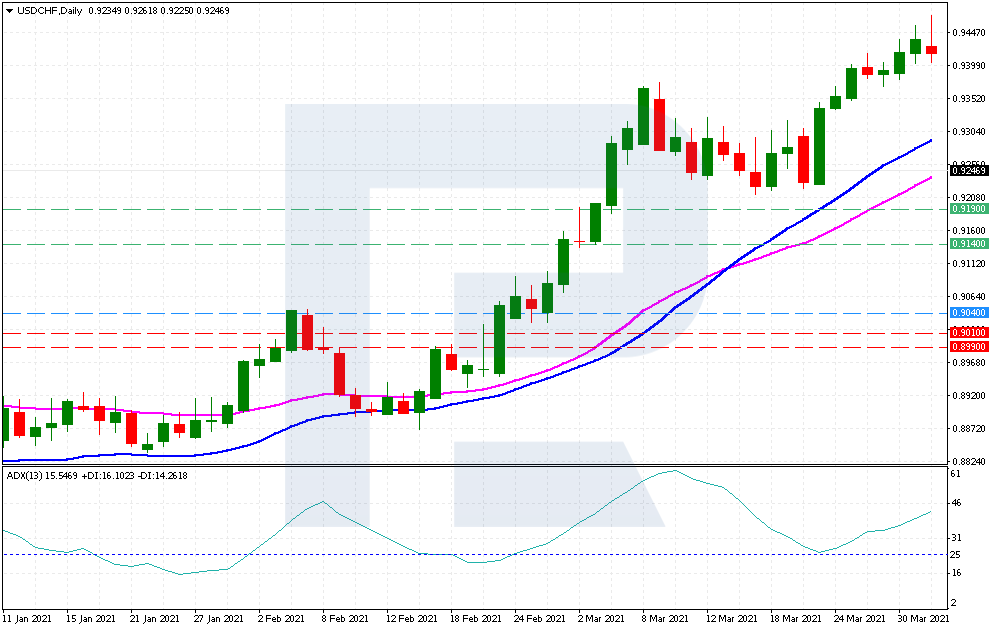
The ADX indicator value is over 25 and closing above it. It’s the second signal for a trader to open a long position at the beginning of the next trading day. That’s why we open a buy order at 0.9040.
The Stop Loss order is placed at 0.9010 or 0.8990, while Take Profit – at 0.9140 or 0.9190. Later, the price reached the Take Profit level.
If we had used the other method, in which a position is closed when the SMA 20 line crosses the EMA 34 line from the bottom upwards, the potential profit might have been 50 pips more.
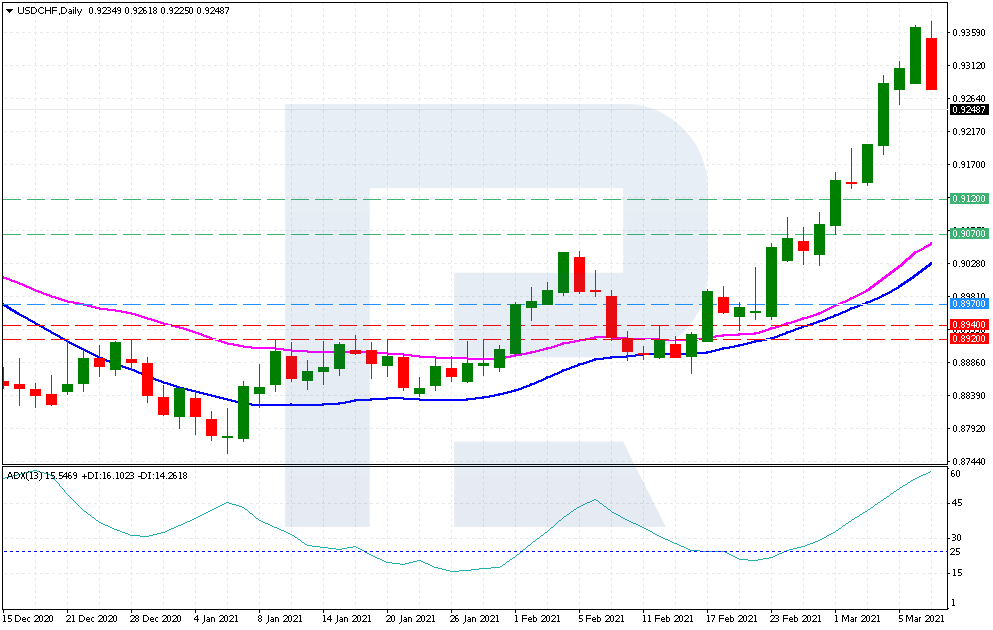
Another example is an order in USD/CHF on 2 February 2021. The EMA 34 line is above the SMA 20 line, and the ADX indicator value is over 25.
A long position is opened at 0.8970. The Stop Loss order is placed at 0.8940 or 0.8920. The Take Profit order is placed at 0.9070 or 0.9120. However, the price only reached 0.9047 and then reversed.
A position was closed with a loss. Probably, to reduce the risks, a trader should move the Stop Loss order to the entry point when the profit reaches 50–60 pips. In the example above, the profit reached 77 pips, but a position eventually turned out to be loss-making.
How to sell by “Daily Breakout and Moving Average”
A short position by the strategy also has its rules:
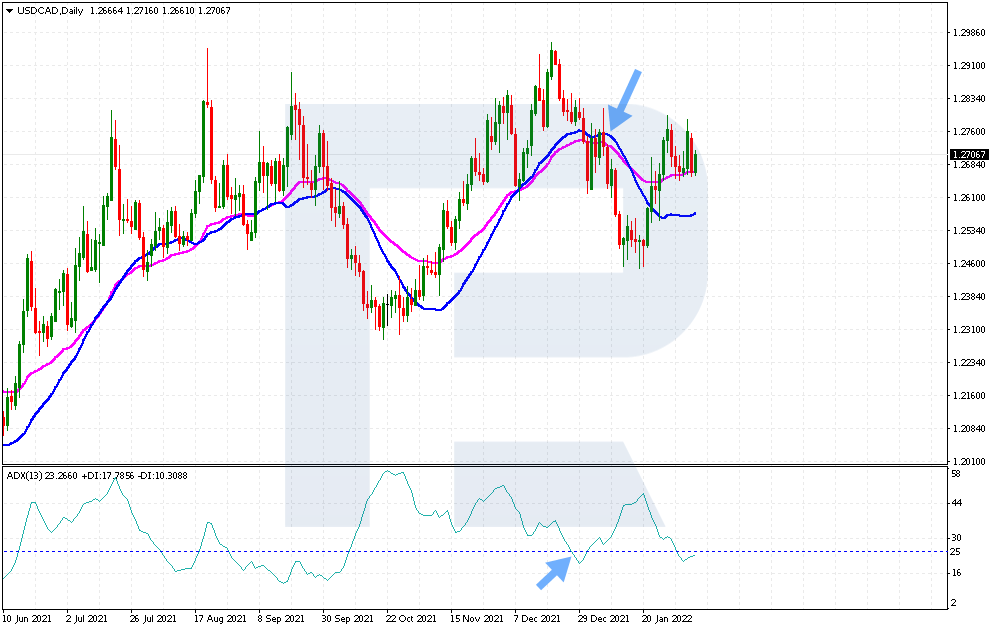
- The EMA 34 line is below the SMA 20 line. The current trend is ascending, but a trader is looking for a signal to sell.
- The ADX indicator broke 25 and moved lower.
Methods to exit a short position are the same as a long one:
Methods to exit a short position:
- A trader closes a position when Moving Averages intersect. We wait for the SMA 20 line to cross the EMA 34 line from top to bottom. The Stop Loss order size is 30–50 pips.
- The Take Profit order is placed 100-150 pips away from the opening price. The Stop Loss order size is 30–50 pips.
An example of selling by “Daily Breakout and Moving Average”
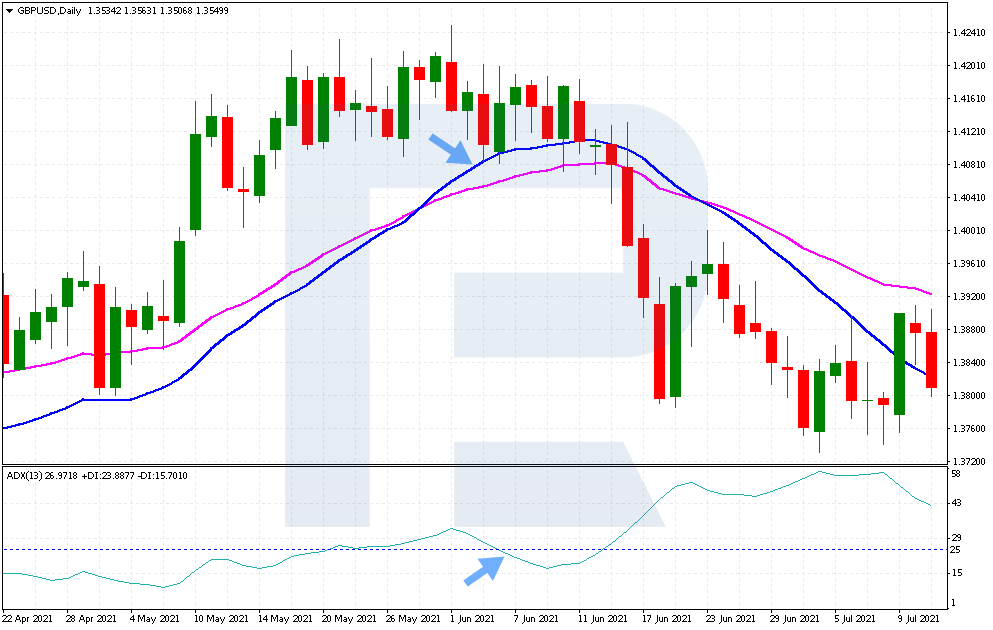
In the example, let’s take a look at the GBP/USD chart for 7 June 2021. The EMA 34 line is moving below the SMA 20 line. The ADX indicator value dropped below 25. These are two signals to open a short position, so a trader can open a sell order.
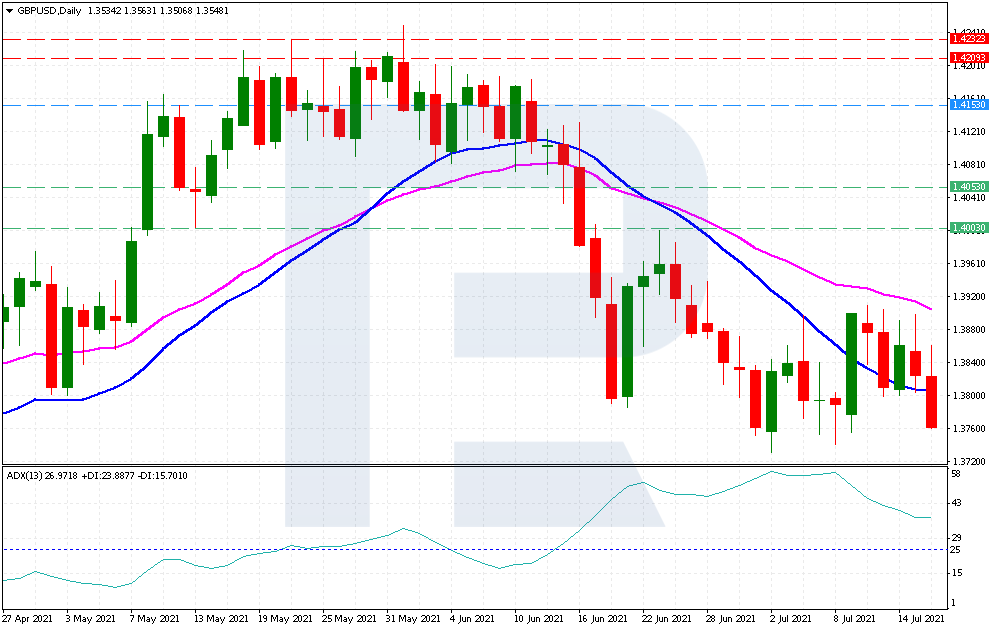
A trader opens a short position at 1.4153. The Stop Loss order is placed at 1.4183 or 1.4203, while Take Profit – at 1.4053 or 1.4003. Later, after a slight correction, the price reaches these levels. The biggest decline was 368 pips, down to 1.3785. Probably, it might be a good idea to add Trailing Stop to the strategy when the Stop Loss order is moving after the price chart.
Conclusion
The “Daily Breakout and Moving Average” strategy is an unusual method of using Moving Averages. In other words, a trader trades against the major trend.
Signals to sell appear when Moving Averages show the uptrend, and signals to buy – the downtrend. Due to the behaviour and peculiarities of the ADX indicator, authors of the strategy are trying to “catch” the moment when the trend is over and trade against it.
Significant arguments in favour of the strategy are the opportunity to work with all trading instruments and fixed rules of placing Stop Loss and Take Profit. These rules may be adjusted to increase profit and minimise risks.


