Price Channel in Trading: How to Draw and Use

5 minutes for reading
This overview is devoted to the use of price channels in trading: what does this term mean? How to find a price channel on the chart? Where to open and close trading positions?
What is price channel
According to a definition from tech analysis, price channel is the fluctuation of the asset price between two parallel support and resistance lines inside the current trend.
In other words, a price channel appears on the chart when the movements of the quotes of a certain asset over a certain timeframe are limited by two parallel lines: one up, one down.
Types of price channel
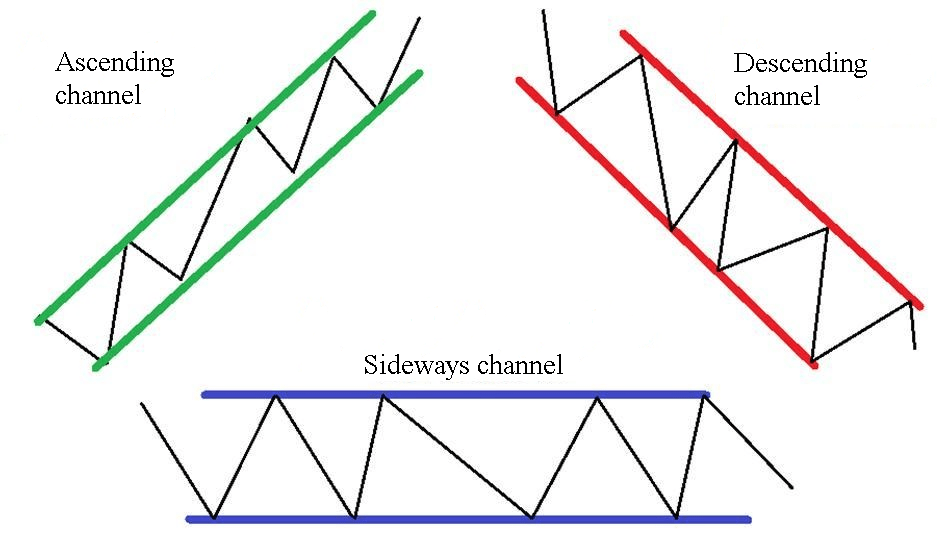
Depending on the direction of the support and resistance lines, three main types of price channel can be singled out:
- Ascending price channel: the lines are headed upwards, the market is growing
- Descending price channel: the lines are headed down, the market is falling
- Sideways price channel: the lines are horizontal, the quotes fluctuate in a limited range.
Why price channel is useful
Traders, and especially those who use tech analysis, look for price patterns on the chart that can help them make trading decisions. Price channel is one of such important graphic patterns.
Analysing the direction of the price channel, the trader can determine the prevailing market trend and work accordingly.
Let us single out the advantages of price channels:
- It helps determine the market trend that, in turn, gives directions for trading;
- It shows promising entry and exit points;
- While the quotes remain inside the channel, its borders give good landmarks for trading;
- It signals about trend changes. When the quotes escape the channel, this might mean either speeding up of the trend or its end and reversal.
How trade in price channel
Do you remember the motto of tech analysis? It goes: "Trend is your friend", i.e. one should trade the trend. Finding an active price channel on the chart, the trader does not only see the trend direction but also gets interesting entry and exit points for their positions. Let us get into classic ways of trading price channels.
Trading ascending channels
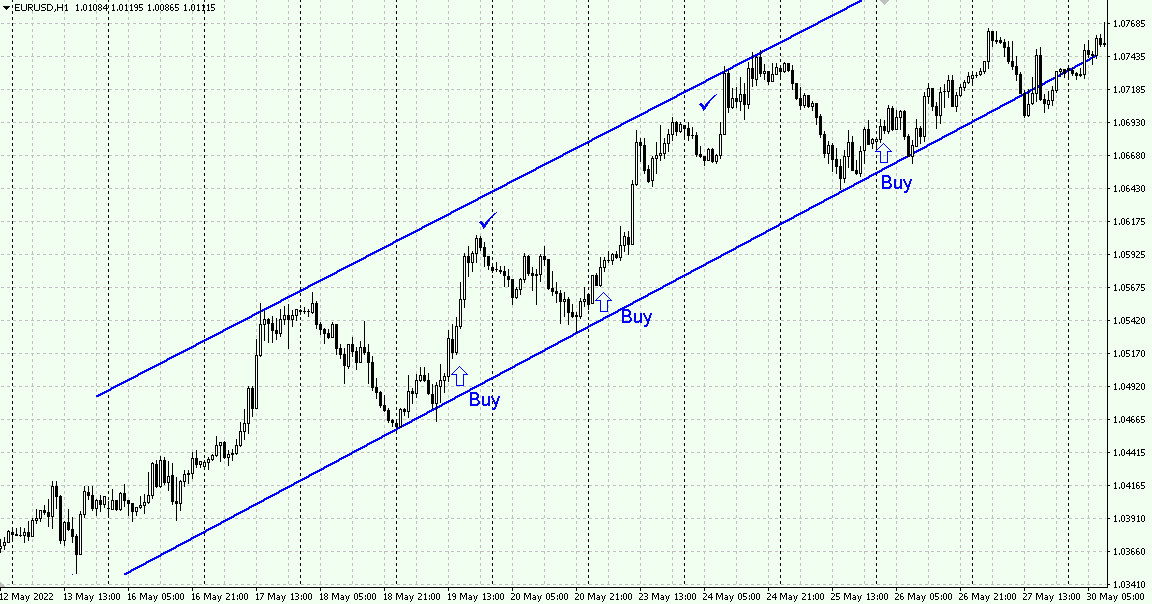
The channel forms in an uptrend: each new high is above the previous one, and so is each new low. The support line goes through lows — this is the main line of the channel, the trendline. The resistance line goes through the highs. In ascending channels, only buys are valid.
Main ways of trading:
- The main thing is that buys are only opened at the support line. The Stop Loss is placed beneath this line. Positions are closed at the resistance line. Trading may go this way while the price remains inside the channel.
- When the quotes break through the support line, the ascending impulse is over. The price escapes the channel and reverses. From now on, selling can be considered.
Trading descending channels
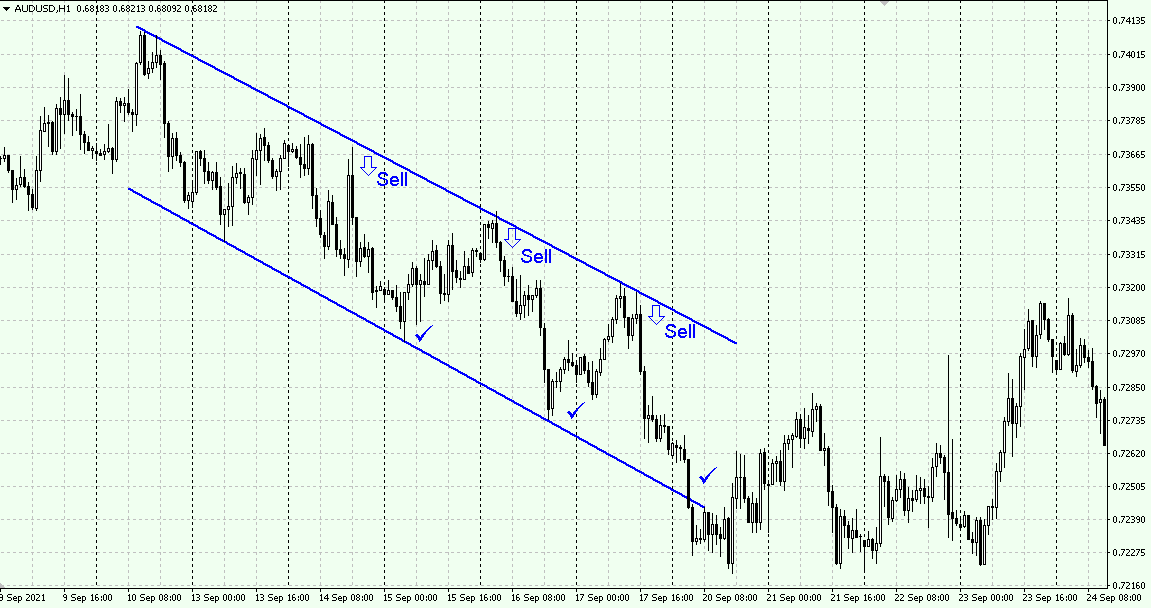
The channel forms in an active downtrend: each new high is lower than the previous one, and so is each new low. The resistance line goes through the highs — this is the mainline of the channel (the trendline). The support level goes through the lows. Only selling trades may be opened in a descending price channel.
Main trading principles:
- Most importantly, sales open at the resistance line only. The Stop Loss is placed above this line. Positions close at the support line. Trading may go on until the quotes escape the channel.
- When the price breaks through the resistance line upwards, trading will be over. The trend might be reversing, and buying positions may be opened.
Trading sideways channels
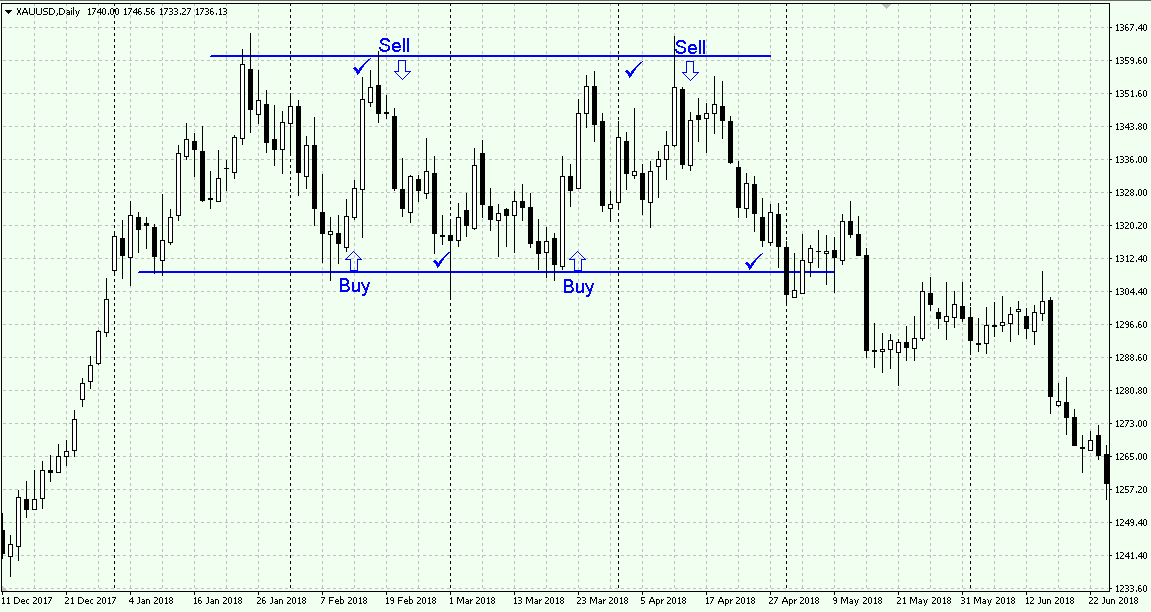
This channel means the market is in no trend now, it is flat. Highs and lows neither grow nor drop, remaining at roughly the same levels. The resistance line of the channel goes through the highs and the support level — through the lows. In this channel, they are equal. The quotes have no clear direction, which means the trader may both buy and sell.
Main trading principles:
- Trading may go in both directions. Sell at the resistance line, placing the SL behind it and closing positions at the support line.
- Buy from the support line, placing the SL below it and closing your position at the resistance line.
- When the price breaks through a border, the flat is be over, and a price impulse starts. Positions may be opened in the direction of the breakaway with an SL behind the nearest channel line.
Trading dynamic price channels
Apart from classic tech analysis channels, dynamic ones are also used. In them, support and resistance lines are calculated by special instruments and are not parallel.
The lines kind of circumference the quotes on the chart, following the price. To calculate channel borders, traders normally use the Moving Averages and their standard deviations.
Like classic channels, dynamic ones may be going up, down, or sideways, hence, trading methods are similar. The most popular dynamic channels should be the Bollinger Bands, Donchian Channel, Keltner Channel.
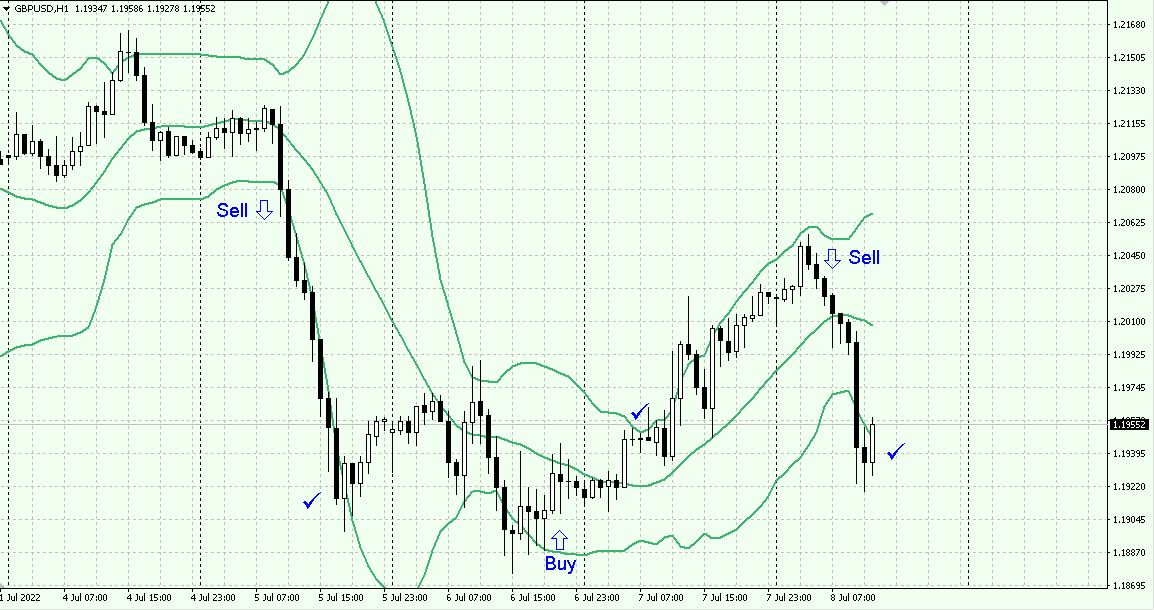
For example, the following signals are used for the Bollinger Bands:
- bounce off the outer channel borders;
- breakaway of the outer channel borders;
- trading from the middle line of the Bollinger Bands.
Bottom line
Price channel is one of the most important graphic patterns of tech analysis. The trader can base their trades in it. Price channels help find current trend direction and promising exit and entry levels.
Modern indicators let us see on the chart dynamic price channels. The react more accurately to price changes and give extra open/close signals, thus enhancing the trader's opportunities.


